In the previous tutorial, I have explained the Integration of the Allure Report with Selenium and JUnit4. In this tutorial, I will explain how to Integrate Allure Report with Cucumber7 and JUnit4.
Below example covers the implementation of Allure Reports in Selenium using JUnit4, Java and Maven.
Table of Contents
- Prerequisite
- Dependency List
- Project Structure
- Implementation Steps
- Update Properties section in Maven pom.xml
- Add dependencies to POM.xml
- Update Build Section of pom.xml in Allure Report Project
- Create Feature file in src/test/resources
- Create the Step Definition class or Glue Code
- Create a Cucumber Runner class
- Create allure.properties in src/test/resources
- Run the Test and Generate Allure Report
- Generate Allure Report
Prerequisite
- Java 11 or above installed
- Maven installed
- Eclipse or IntelliJ installed
- Allure installed and configured
Dependency List:
- Selenium – 4.16.1
- Java 17
- Cucumber – 7.15.0
- Maven – 3.9.5
- Allure BOM – 2.25.0
- Aspectj – 1.9.21
- Allure Maven – 2.12.0
- JUnit – 4.13.2
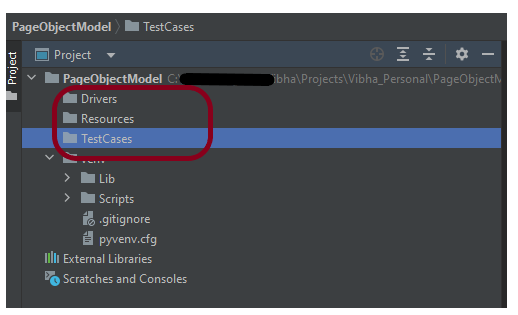
Project Structure
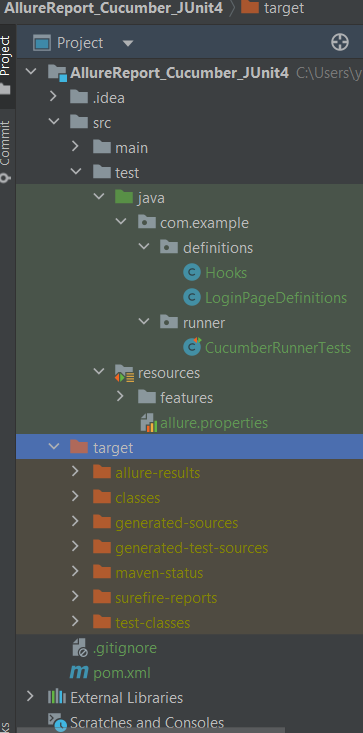
Implementation Steps
Step 1 – Update Properties section in Maven pom.xml
<properties>
    <project.build.sourceEncoding>UTF-8</project.build.sourceEncoding>
    <cucumber.version>7.15.0</cucumber.version>
    <selenium.version>4.16.1</selenium.version>
    <junit.version>4.13.2</junit.version>
    <maven.compiler.plugin.version>3.12.1</maven.compiler.plugin.version>
    <maven.surefire.plugin.version>3.2.3</maven.surefire.plugin.version>
    <maven.compiler.source.version>17</maven.compiler.source.version>
    <maven.compiler.target.version>17</maven.compiler.target.version>
    <allure.junit4.version>2.25.0</allure.junit4.version>
    <aspectj.version>1.9.21</aspectj.version>
    <allure.version>2.25.0</allure.version>
    <allure.maven>2.12.0</allure.maven>
 </properties>
Step 2 – Add dependencies to POM.xml
Add Cucumber5, Selenium, JUnit4, Allure-Cucumber5 and Allure-JUnit4 dependencies in POM.xml
 <dependencies>

     <!--Cucumber Dependencies-->
    <dependency>
      <groupId>io.cucumber</groupId>
      <artifactId>cucumber-java</artifactId>
      <version>${cucumber.version}</version>
    </dependency>

    <dependency>
      <groupId>io.cucumber</groupId>
      <artifactId>cucumber-junit</artifactId>
      <version>${cucumber.version}</version>
       <scope>test</scope>
    </dependency>

   <!--Selenium Dependency-->
    <dependency>
      <groupId>org.seleniumhq.selenium</groupId>
      <artifactId>selenium-java</artifactId>
      <version>${selenium.version}</version>
    </dependency>

   <!--Hamcrest Dependency-->
    <dependency>
      <groupId>org.hamcrest</groupId>
      <artifactId>hamcrest</artifactId>
      <version>2.2</version>
      <scope>test</scope>
    </dependency>

   <!--Allure Cucumber Dependency-->
      <dependency>
        <groupId>io.qameta.allure</groupId>
        <artifactId>allure-cucumber5-jvm</artifactId>
        <version>${allure.cucumber5.version}</version>
    </dependency>

     <!--Allure Reporting Dependency-->
    <dependency>
        <groupId>io.qameta.allure</groupId>
        <artifactId>allure-junit4</artifactId>
        <version>${allure.junit4.version}</version>
        <scope>test</scope>
    </dependency>

  </dependencies>
Step 3 – Update Build Section of pom.xml in Allure Report Project
<build>
        <plugins>
            <plugin>
                <groupId>org.apache.maven.plugins</groupId>
                <artifactId>maven-compiler-plugin</artifactId>
                <version>${maven.compiler.plugin.version}</version>
                <configuration>
                    <source>${maven.compiler.source.version}</source>
                    <target>${maven.compiler.target.version}</target>
                </configuration>
            </plugin>
            <plugin>
                <groupId>org.apache.maven.plugins</groupId>
                <artifactId>maven-surefire-plugin</artifactId>
                <version>${maven.surefire.plugin.version}</version>
                <configuration>
                    <argLine>
                        -javaagent:"${settings.localRepository}/org/aspectj/aspectjweaver/${aspectj.version}/aspectjweaver-${aspectj.version}.jar"
                    </argLine>
                </configuration>
                <dependencies>
                    <dependency>
                        <groupId>org.aspectj</groupId>
                        <artifactId>aspectjweaver</artifactId>
                        <version>${aspectj.version}</version>
                        <scope>runtime</scope>
                    </dependency>
                </dependencies>
            </plugin>
            <plugin>
                <groupId>io.qameta.allure</groupId>
                <artifactId>allure-maven</artifactId>
                <version>${allure.maven}</version>
                <configuration>
                    <reportVersion>${allure.maven}</reportVersion>
                </configuration>
            </plugin>
        </plugins>
    </build>
The complete pom.xml is shown below:
<project xmlns="http://maven.apache.org/POM/4.0.0" xmlns:xsi="http://www.w3.org/2001/XMLSchema-instance"
         xsi:schemaLocation="http://maven.apache.org/POM/4.0.0 http://maven.apache.org/xsd/maven-4.0.0.xsd">
    <modelVersion>4.0.0</modelVersion>

    <groupId>com.example</groupId>
    <artifactId>AllureReport_Cucumber_JUnit4</artifactId>
    <version>1.0-SNAPSHOT</version>
    <packaging>jar</packaging>

    <name>AllureReport_Cucumber_JUnit4</name>
    <url>http://maven.apache.org</url>

    <properties>
        <project.build.sourceEncoding>UTF-8</project.build.sourceEncoding>
        <cucumber.version>7.15.0</cucumber.version>
        <selenium.version>4.16.1</selenium.version>
        <junit.version>4.13.2</junit.version>
        <maven.compiler.plugin.version>3.12.1</maven.compiler.plugin.version>
        <maven.surefire.plugin.version>3.2.3</maven.surefire.plugin.version>
        <maven.compiler.source.version>17</maven.compiler.source.version>
        <maven.compiler.target.version>17</maven.compiler.target.version>
        <allure.junit4.version>2.25.0</allure.junit4.version>
        <aspectj.version>1.9.21</aspectj.version>
        <allure.version>2.25.0</allure.version>
        <allure.maven>2.12.0</allure.maven>
    </properties>

    <!-- Add allure-bom to dependency management to ensure correct versions of all the dependencies are used -->
    <dependencyManagement>
        <dependencies>
            <dependency>
                <groupId>io.qameta.allure</groupId>
                <artifactId>allure-bom</artifactId>
                <version>${allure.version}</version>
                <type>pom</type>
                <scope>import</scope>
            </dependency>
        </dependencies>
    </dependencyManagement>


    <dependencies>

        <dependency>
            <groupId>io.cucumber</groupId>
            <artifactId>cucumber-java</artifactId>
            <version>${cucumber.version}</version>
        </dependency>

        <dependency>
            <groupId>io.cucumber</groupId>
            <artifactId>cucumber-junit</artifactId>
            <version>${cucumber.version}</version>
            <scope>test</scope>
        </dependency>

        <!-- Selenium -->
        <dependency>
            <groupId>org.seleniumhq.selenium</groupId>
            <artifactId>selenium-java</artifactId>
            <version>${selenium.version}</version>
        </dependency>

        <!-- JUnit4 -->
        <dependency>
            <groupId>junit</groupId>
            <artifactId>junit</artifactId>
            <version>${junit.version}</version>
            <scope>test</scope>
        </dependency>

        <!--Allure Cucumber Dependency-->
        <dependency>
            <groupId>io.qameta.allure</groupId>
            <artifactId>allure-cucumber7-jvm</artifactId>
            <scope>test</scope>
        </dependency>

        <!--Allure Reporting Dependency-->
        <dependency>
            <groupId>io.qameta.allure</groupId>
            <artifactId>allure-junit4</artifactId>
            <scope>test</scope>
        </dependency>

    </dependencies>

    <build>
        <plugins>
            <plugin>
                <groupId>org.apache.maven.plugins</groupId>
                <artifactId>maven-compiler-plugin</artifactId>
                <version>${maven.compiler.plugin.version}</version>
                <configuration>
                    <source>${maven.compiler.source.version}</source>
                    <target>${maven.compiler.target.version}</target>
                </configuration>
            </plugin>
            <plugin>
                <groupId>org.apache.maven.plugins</groupId>
                <artifactId>maven-surefire-plugin</artifactId>
                <version>${maven.surefire.plugin.version}</version>
                <configuration>
                    <argLine>
                        -javaagent:"${settings.localRepository}/org/aspectj/aspectjweaver/${aspectj.version}/aspectjweaver-${aspectj.version}.jar"
                    </argLine>
                </configuration>
                <dependencies>
                    <dependency>
                        <groupId>org.aspectj</groupId>
                        <artifactId>aspectjweaver</artifactId>
                        <version>${aspectj.version}</version>
                        <scope>runtime</scope>
                    </dependency>
                </dependencies>
            </plugin>
            <plugin>
                <groupId>io.qameta.allure</groupId>
                <artifactId>allure-maven</artifactId>
                <version>${allure.maven}</version>
                <configuration>
                    <reportVersion>${allure.maven}</reportVersion>
                </configuration>
            </plugin>
        </plugins>
    </build>
</project>
Step 4 – Create Feature file in src/test/resources
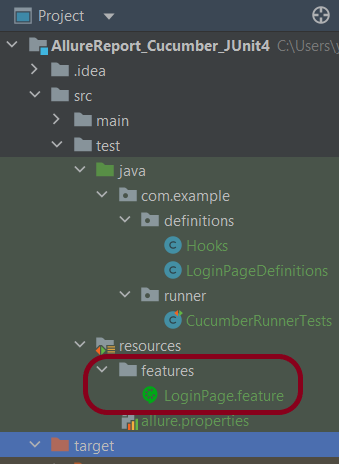
Create source folder – src/test/resources and features folder within src/test/resources to create test scenarios in Feature file. Feature file should be saved as an extension of .feature. Add the test scenarios in this feature file. I have added sample test scenarios. In this feature file, I have created a scenario for successful login and one Scenario Outline for failed login. The test scenarios are written in Gherkins language.
Feature: Login to HRM Application

  Background:
    Given User is on HRMLogin page "https://opensource-demo.orangehrmlive.com/"

  @ValidCredentials
  Scenario: Login with valid credentials

    When User enters username as "Admin" and password as "admin123"
    Then User should be able to login successfully and new page open

  @InvalidCredentials
  Scenario Outline: Login with invalid credentials

    When User enters username as "<username>" and password as "<password>"
    Then User should be able to see error message "<errorMessage>"

    Examples:
      | username   | password    | errorMessage                      |
      | Admin        | admin12$$ | Invalid credentials               |
      | admin$$     | admin123   | Invalid credentials               |
      | abc123       | xyz$$          | Invalid credentials               |
      | 234             | xyz$$         | Invalid credentials!              |
Step 5 – Create the Step Definition class or Glue Code
The stepdefinition class is created in src/test/java.
Below is the code for the LoginDefinition class.
package com.example.definitions;

import io.cucumber.java.en.Given;
import io.cucumber.java.en.Then;
import io.cucumber.java.en.When;
import org.junit.Assert;
import org.openqa.selenium.By;

public class LoginPageDefinitions {

   Hooks hooks;

    @Given("User is on HRMLogin page {string}")
    public void loginTest(String url) {

        hooks.driver.get(url);

    }

    @When("User enters username as {string} and password as {string}")
    public void goToHomePage(String userName, String passWord) {

        // login to application
        hooks.driver.findElement(By.name("username")).sendKeys(userName);
        hooks.driver.findElement(By.name("password")).sendKeys(passWord);
        hooks.driver.findElement(By.xpath("//*[@class='oxd-form']/div[3]/button")).submit();

        // go the next page
    }

    @Then("User should be able to login successfully and new page open")
    public void verifyLogin() {

        String homePageHeading = hooks.driver.findElement(By.xpath("//*[@class='oxd-topbar-header-breadcrumb']/h6")).getText();

        //Verify new page - HomePage
        Assert.assertEquals("Dashboard",homePageHeading);

    }

    @Then("User should be able to see error message {string}")
    public void verifyErrorMessage(String expectedErrorMessage) {

        String actualErrorMessage = hooks.driver.findElement(By.xpath("//*[@class='orangehrm-login-error']/div[1]/div[1]/p")).getText();

        // Verify Error Message
        Assert.assertEquals(expectedErrorMessage,actualErrorMessage);

    }

}
Hook.java
package com.example.definitions;

import io.cucumber.java.After;
import io.cucumber.java.Before;
import io.cucumber.java.Scenario;
import org.openqa.selenium.OutputType;
import org.openqa.selenium.TakesScreenshot;
import org.openqa.selenium.WebDriver;
import org.openqa.selenium.chrome.ChromeDriver;
import org.openqa.selenium.chrome.ChromeOptions;

import java.time.Duration;

public class Hooks {
    protected static WebDriver driver;
    public final static int TIMEOUT = 5;

    @Before
    public void setUp() {

        ChromeOptions options = new ChromeOptions();
        options.addArguments("--start-maximized");
        driver = new ChromeDriver(options);
        driver.manage().timeouts().implicitlyWait(Duration.ofSeconds(TIMEOUT));

    }

    @After
    public void tearDown(Scenario scenario) {
        try {
            String screenshotName = scenario.getName();
            if (scenario.isFailed()) {
                TakesScreenshot ts = (TakesScreenshot) driver;
                byte[] screenshot = ts.getScreenshotAs(OutputType.BYTES);
                scenario.attach(screenshot, "img/png", screenshotName);
            }
        } catch (Exception e) {
            e.printStackTrace();
        }
        driver.quit();
    }
}
Step 6 – Create a Cucumber Runner class
We need to create a class called Runner class to run the tests. This class will use the JUnit annotation @RunWith(), which tells JUnit what is the test runner class.
package com.example.runner;

import org.junit.runner.RunWith;
import io.cucumber.junit.Cucumber;
import io.cucumber.junit.CucumberOptions;

@RunWith(Cucumber.class)
@CucumberOptions(tags = "", features = {"src/test/resources/features"}, glue = {"com.example.definitions"},
        plugin = {"pretty","io.qameta.allure.cucumber7jvm.AllureCucumber7Jvm"})

public class CucumberRunnerTests  {

}
Step 7 – Create allure.properties in src/test/resources
Allure, by default, saves test results in the project’s root directory. However, it is recommended to store your test results in the build output directory. To configure this, create an allure.properties file and place it in the test resources directory of your project, which is typically located at src/test/resources:
allure.results.directory=target/allure-results
Step 8 – Run the Test and Generate Allure Report
To run the tests, use the below command
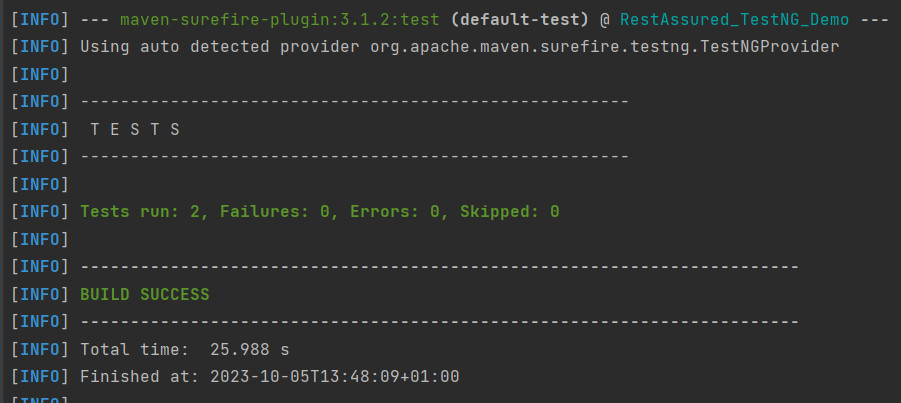
mvn clean test
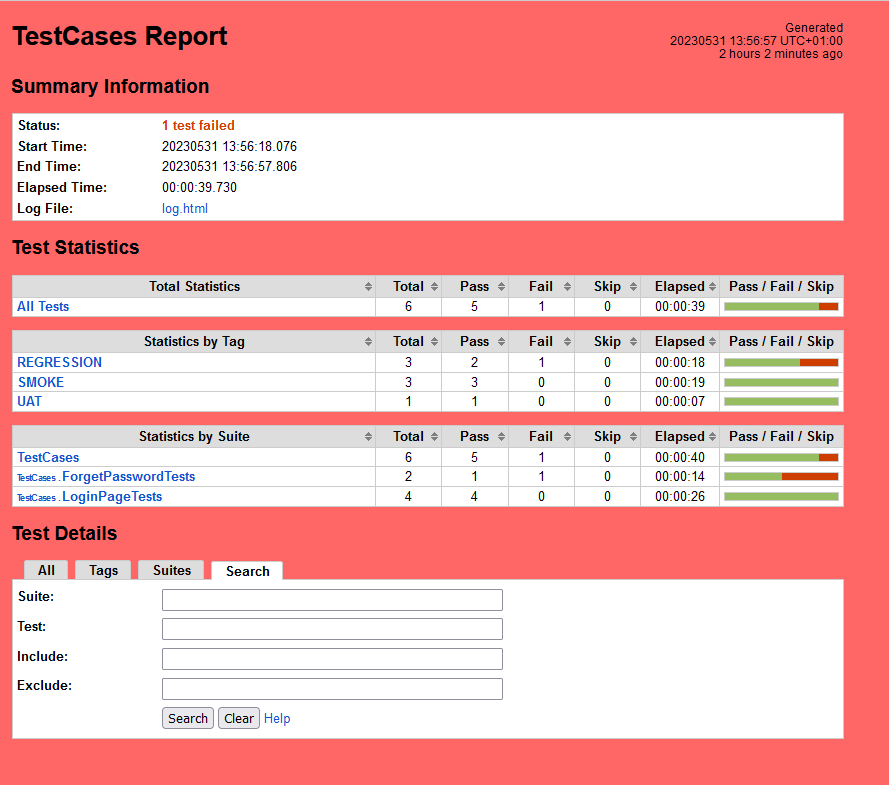
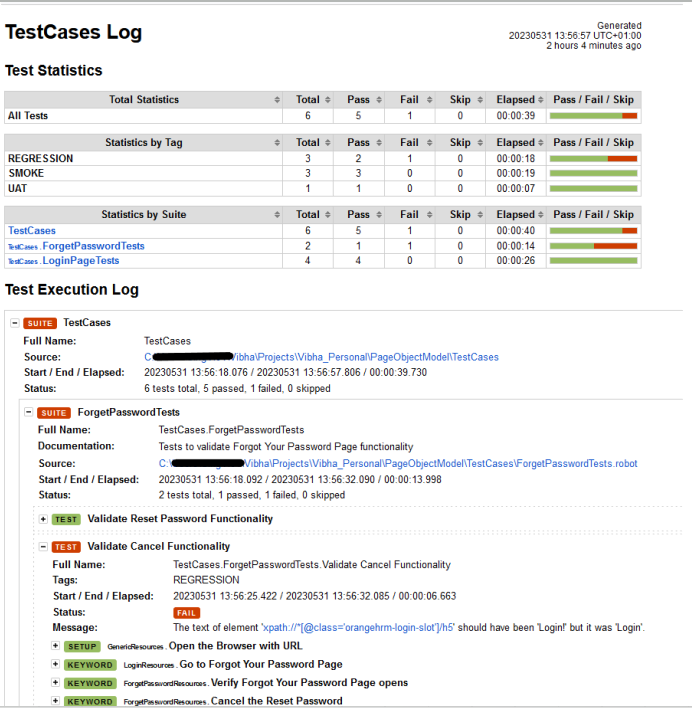
In the below image, we can see that one test is failed and four passed out of five tests.
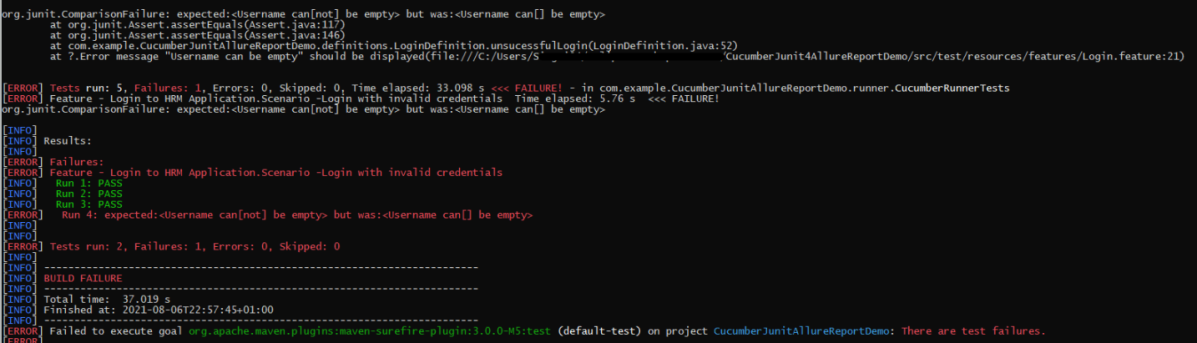
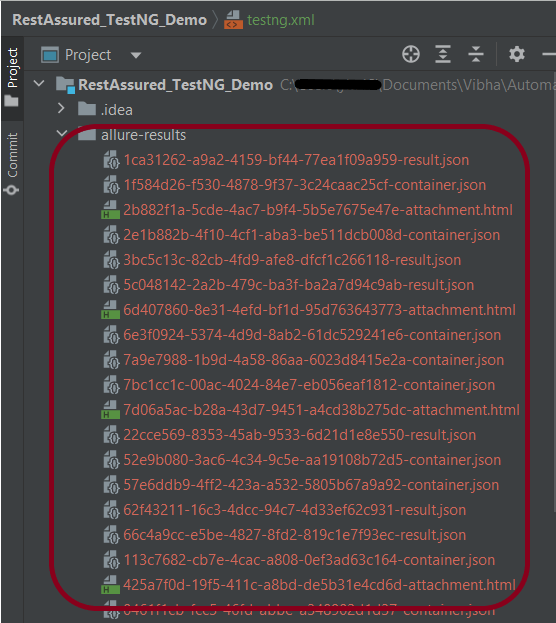
This will create allure-results folder with all the test report. These files will be use to generate Allure Report.
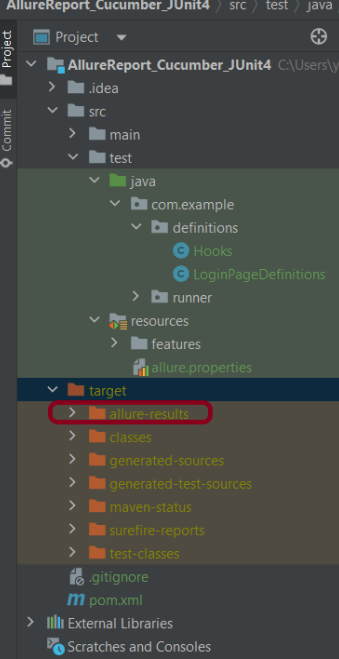
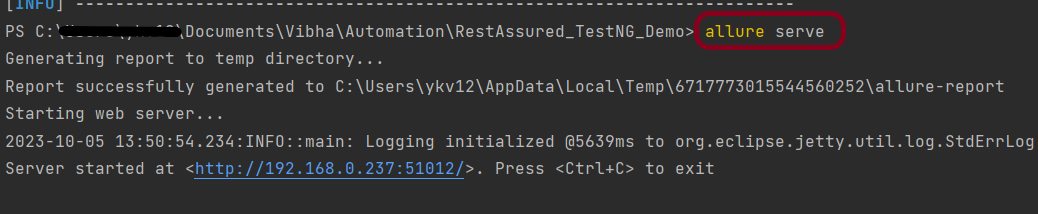
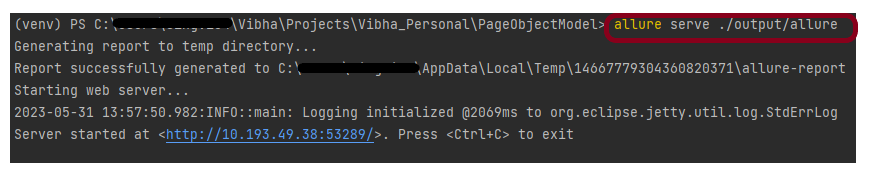
Step 9 – Generate Allure Report
Change current directory to target directory and then use the below command to generate the Allure Report
allure serve
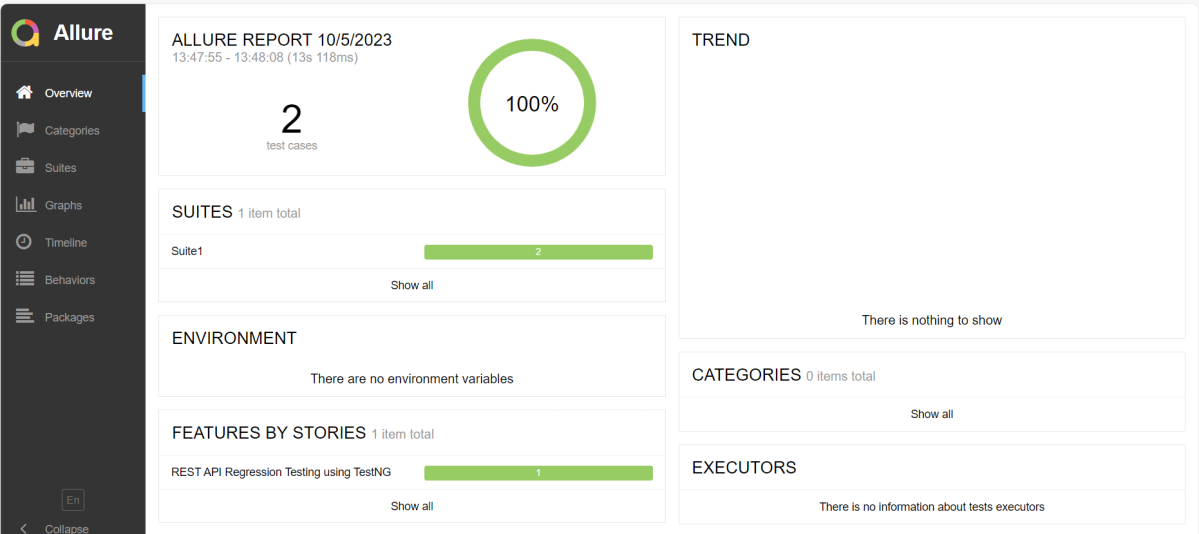
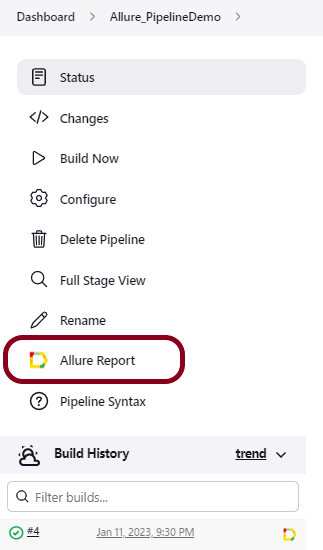
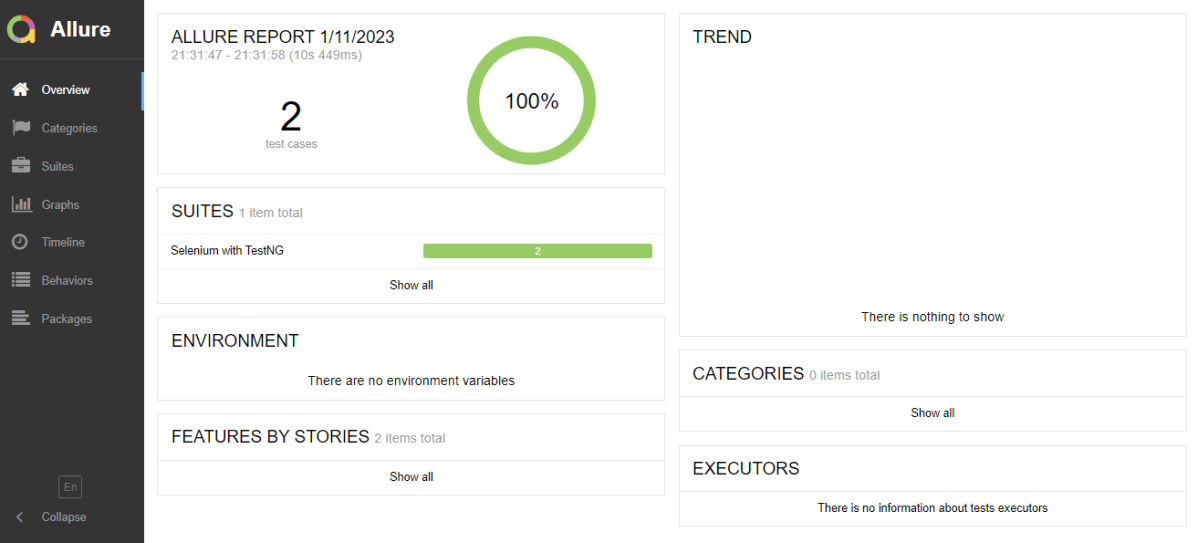
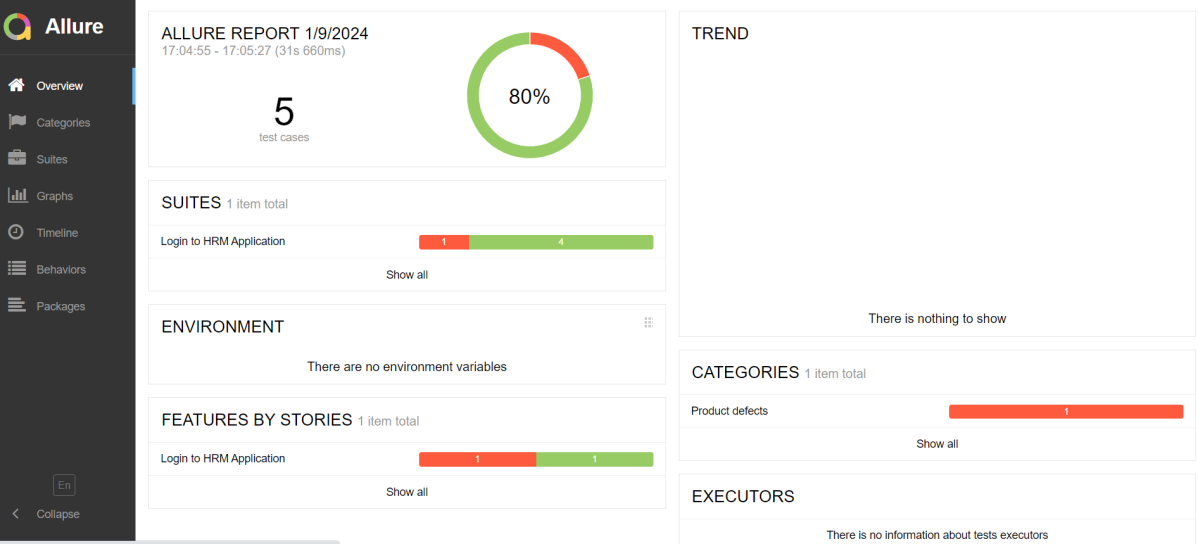
This will generate the beautiful Allure Test Report as shown below.
Allure Report Dashboard
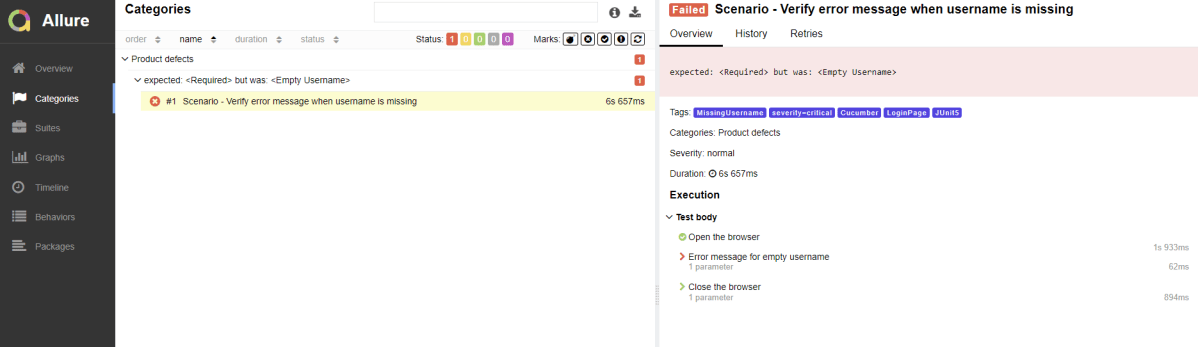
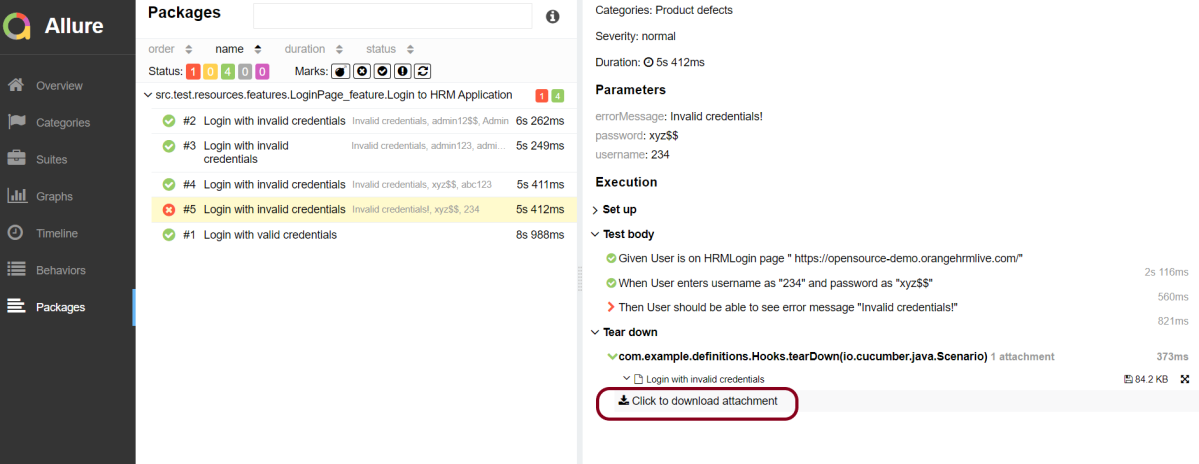
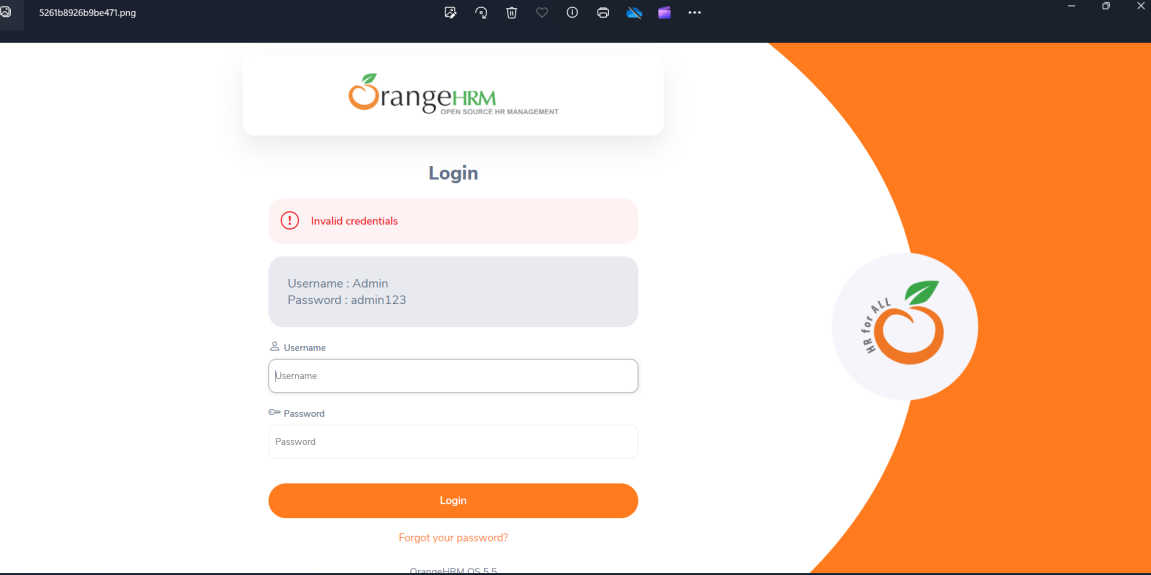
It shows detail of all the test steps and the screenshot of the failed test step also as shown below.
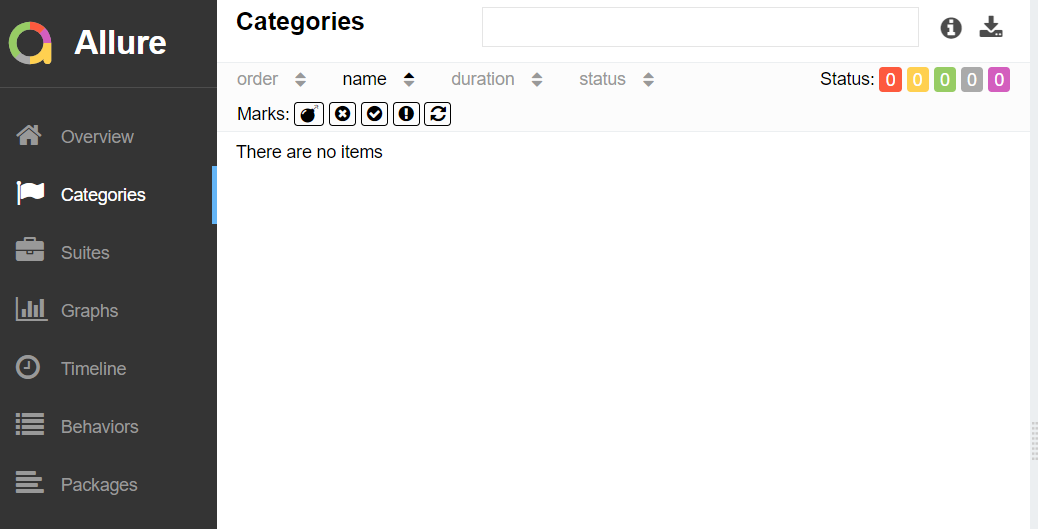
Categories in Allure Report
Categories tab gives you the way to create custom defects classification to apply for test results. There are two categories of defects – Product Defects (failed tests) and Test Defects (broken tests).

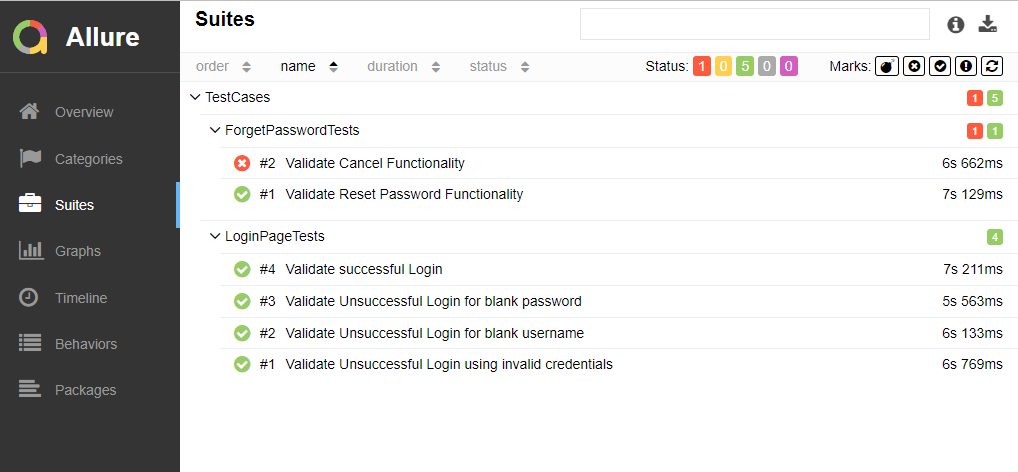
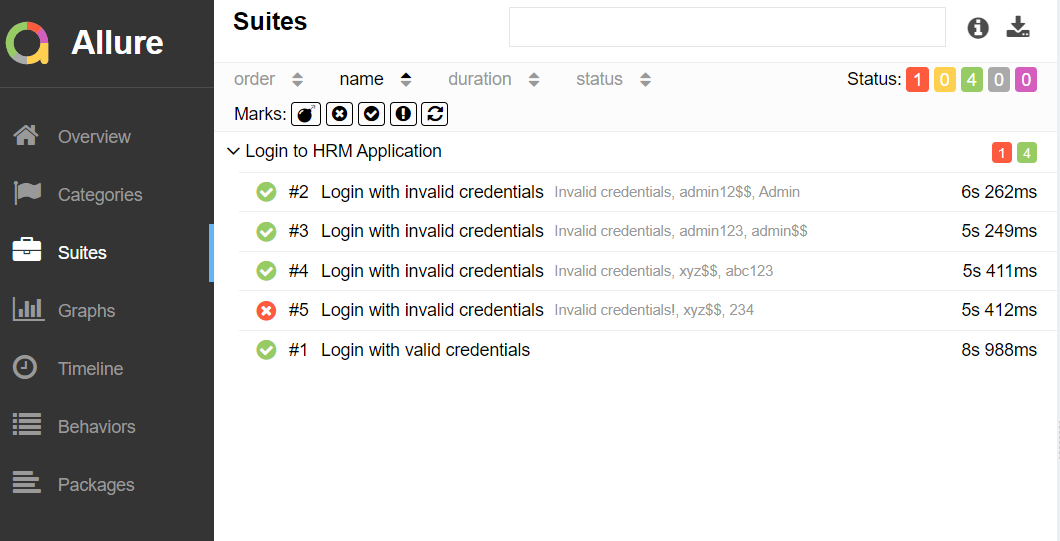
Suites in Allure Report
On the Suites tab a standard structural representation of executed tests, grouped by suites and classes can be found.
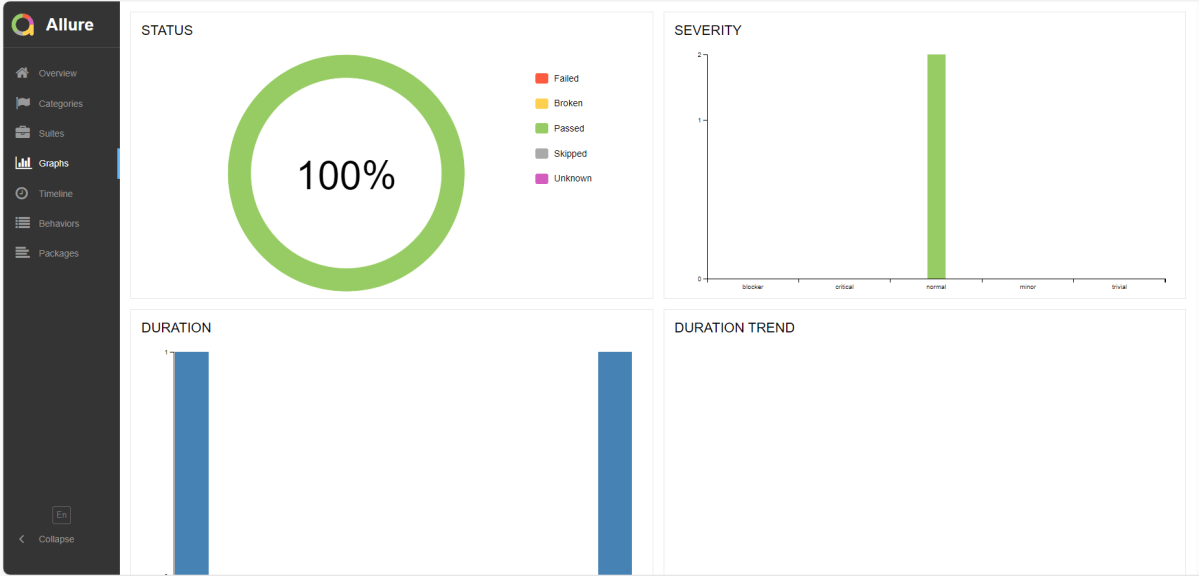
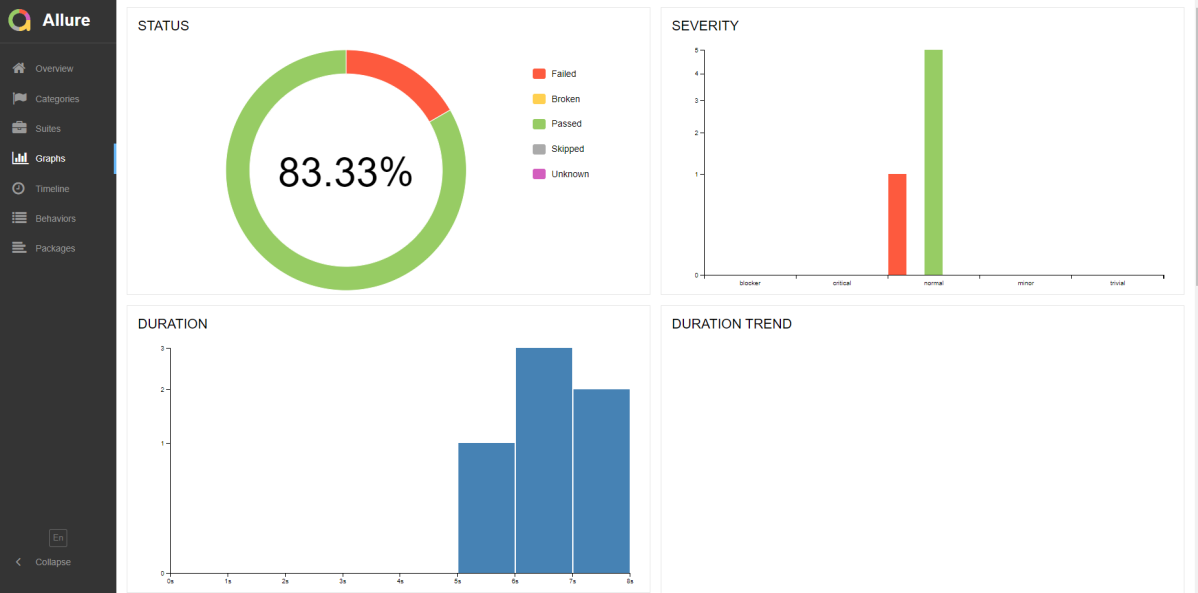
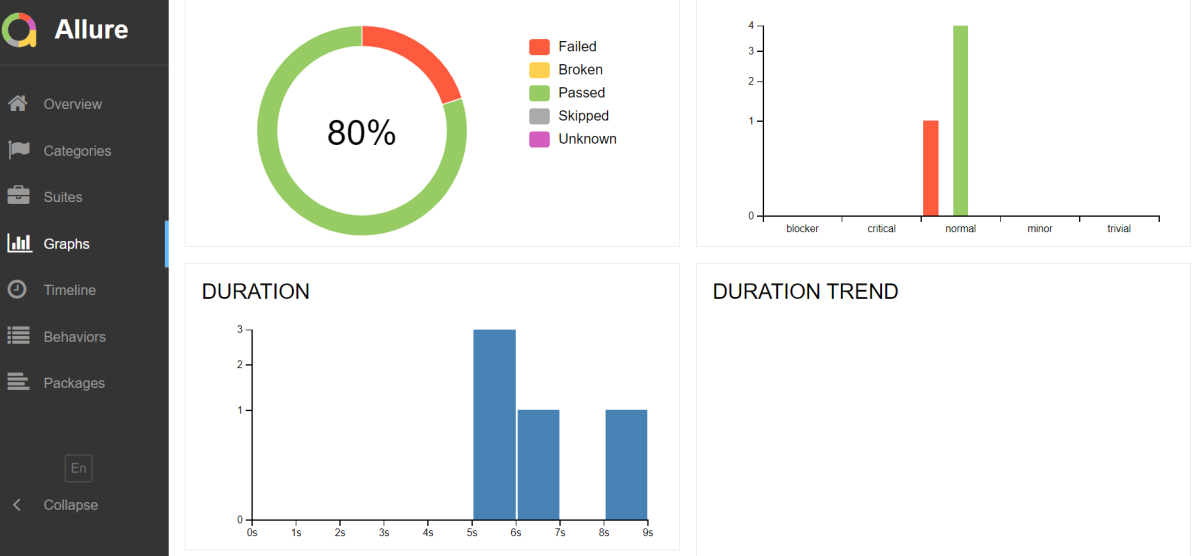
Graphs in Allure Report
Graphs allow you to see different statistics collected from the test data: statuses breakdown or severity and duration diagrams.
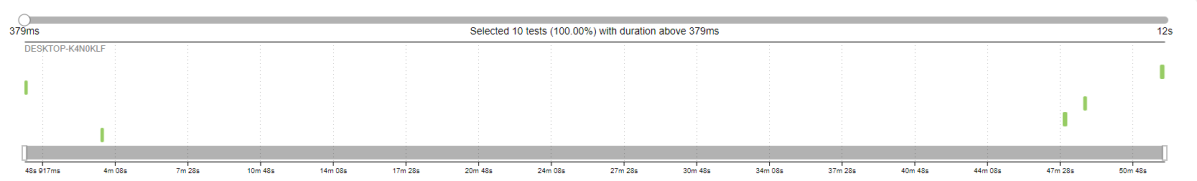
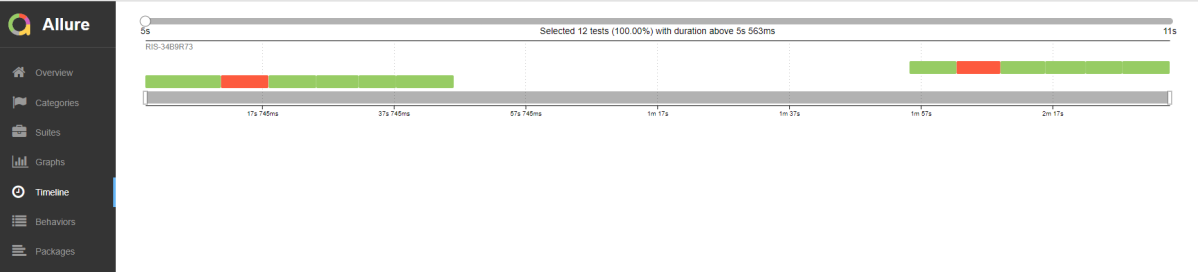
Timeline in Allure Report
Timeline tab visualizes retrospective of tests execution, allure adaptors collect precise timings of tests, and here on this tab they are arranged accordingly to their sequential or parallel timing structure.

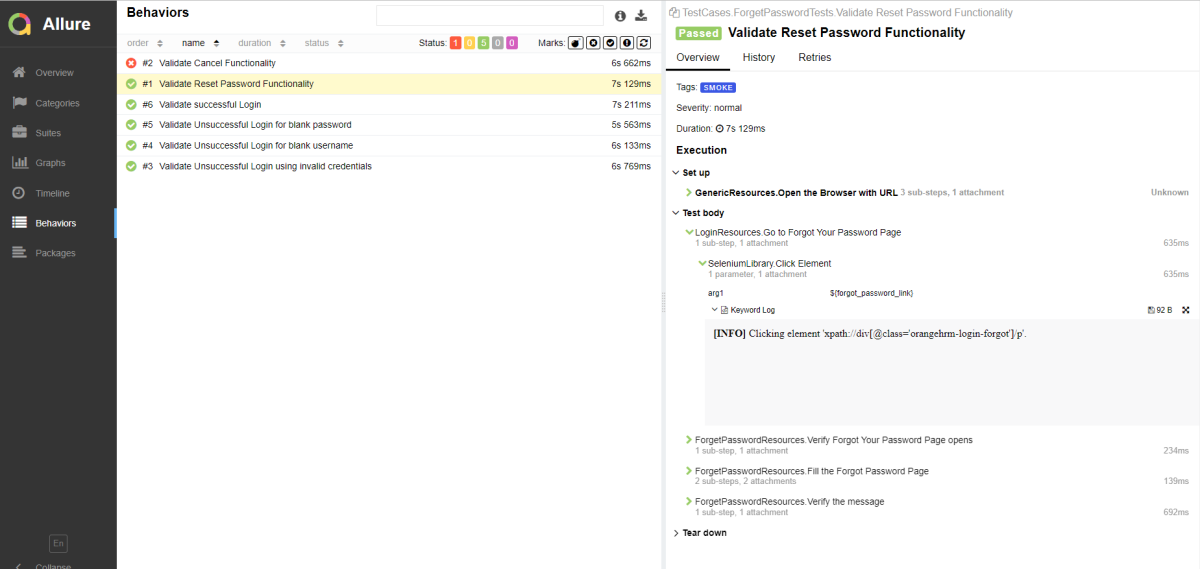
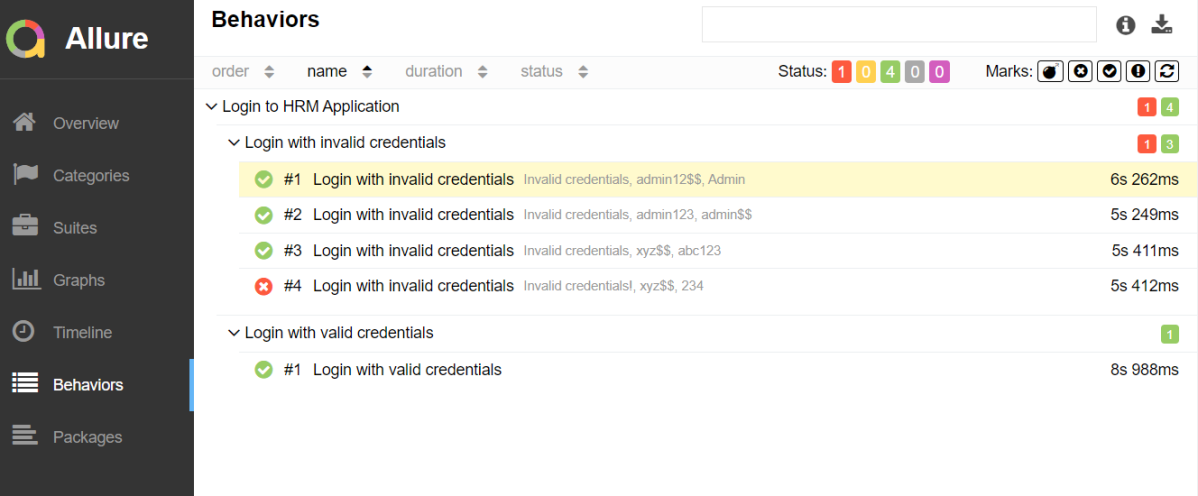
Behaviors of Allure Report
This tab groups test results according to Epic, Feature and Story tags.
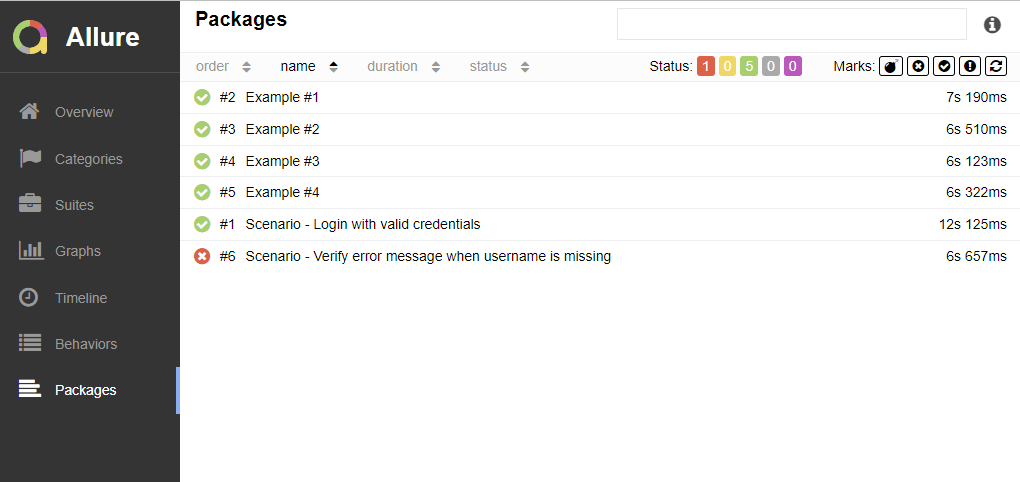
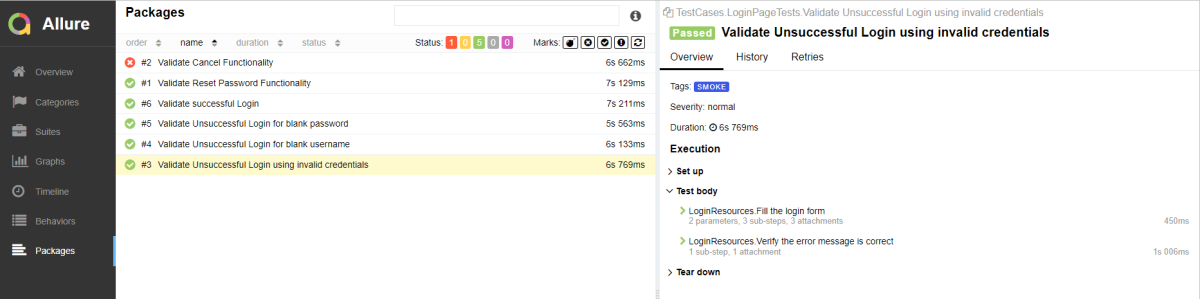
Packages in Allure Report
Packages tab represents a tree-like layout of test results, grouped by different packages.

That’s it! Congratulations on making it through this tutorial and hope you found it useful! Happy Learning!!
The complete code can be found on GitHub – vibssingh/AllureReport_Cucumber_JUnit4.