In this tutorial, we will generate PDF reports using an Extent Adapter.
Step 1: Follow this article to add POM.xml, create and configure the sample project with the extent property file, and add the plugin to the Test Runner class.
Step 2: To attach the screenshot to your extent report, refer to How to add Screenshot to Cucumber ExtentReports.
Step 3: Add additional PDF-related properties in extent.properties.
extent.reporter.spark.start=true
extent.reporter.spark.out=Reports/Spark.html
#PDF Report
extent.reporter.pdf.start=true
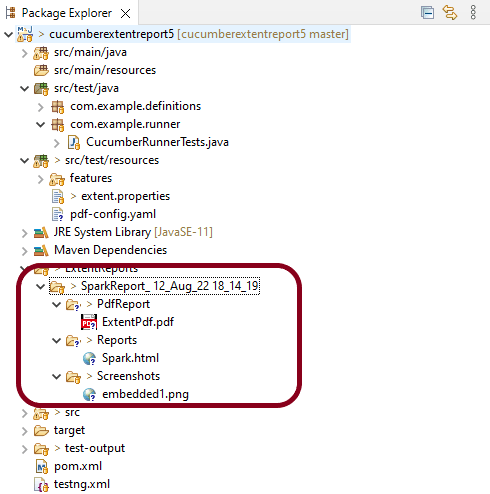
extent.reporter.pdf.out=PdfReport/ExtentPdf.pdf
#FolderName
basefolder.name=ExtentReports/SparkReport_
basefolder.datetimepattern=d_MMM_YY HH_mm_ss
#Screenshot
screenshot.dir=/Screenshots/
screenshot.rel.path=../Screenshots/
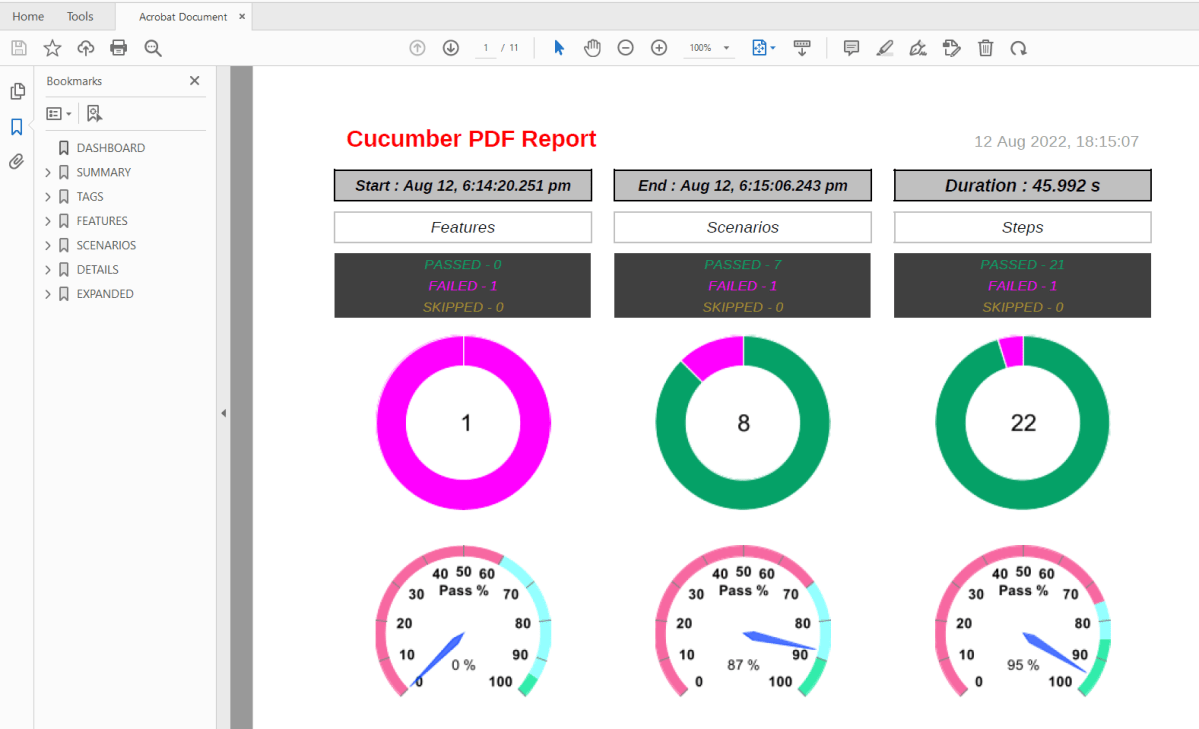
Execute the test code. The PDF report will be generated as shown below:
The report contains six sections – dashboard, summary, tags, features, scenarios, and detailed sections.
1. Dashboard
This section is a single-page dashboard that summarizes the test run. This contains the report title, duration, and status of breakups.

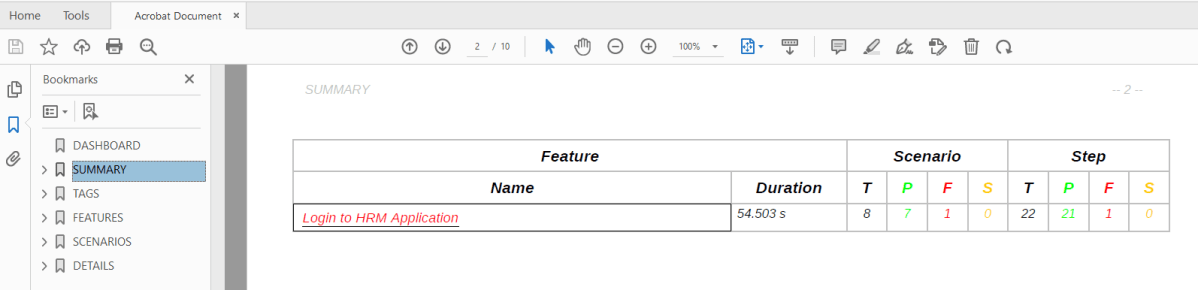
2. Summary section
This section provides an overview of the test run in terms of a feature breakdown, comprising duration, scenario count, and step count. The scenarios and steps are divided into status counts. The feature name has a link that navigates to further details in the detailed step section. This link is only present if the detailed section is enabled.
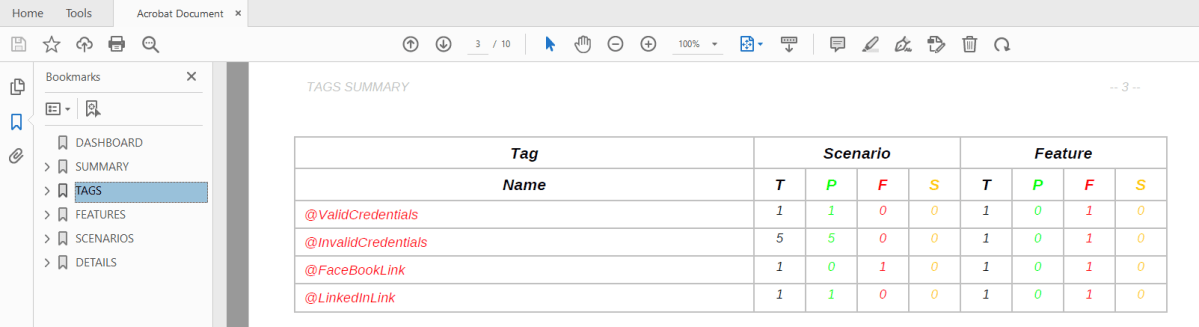
3. Tag section
This section provides an overview of the test run in terms of a tag breakdown, comprising feature count and scenario count.
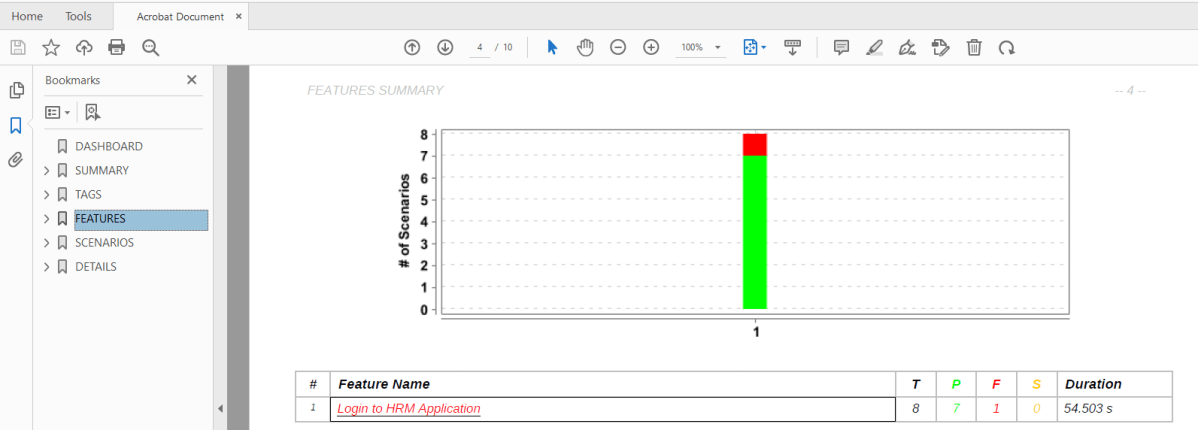
4. Feature section
This section describes the feature details with a stacked bar chart and a table of the scenario status and duration. This section display can be controlled by a configuration setting, enabled by default. The feature name has a link that navigates to further details in the detailed step section. This link is only present if the detailed section is enabled.
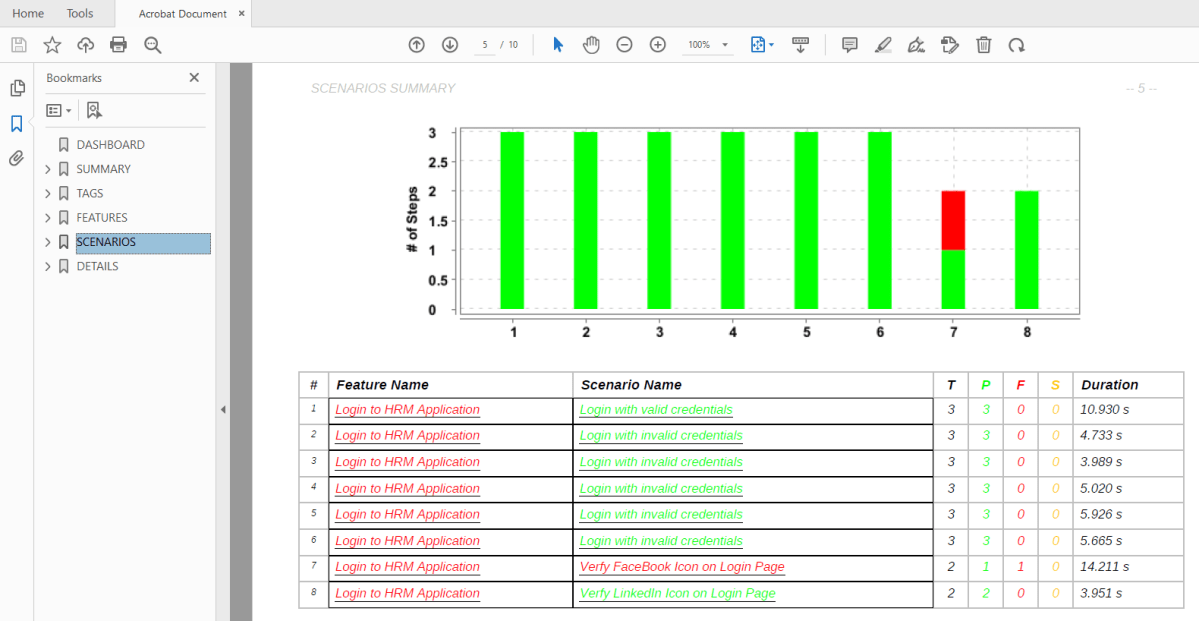
5. Scenario section
This section describes the scenario details with a stacked bar chart and a table of the step status and duration. This section display can be controlled by a configuration setting, enabled by default. The feature and scenario names have a link that navigates to further details in the detailed step section. This link is only present if the detailed section is enabled.
6. Detailed section
This section describes the details of individual steps and hooks, along with status and duration. This section display can be controlled by a configuration setting, enabled by default.
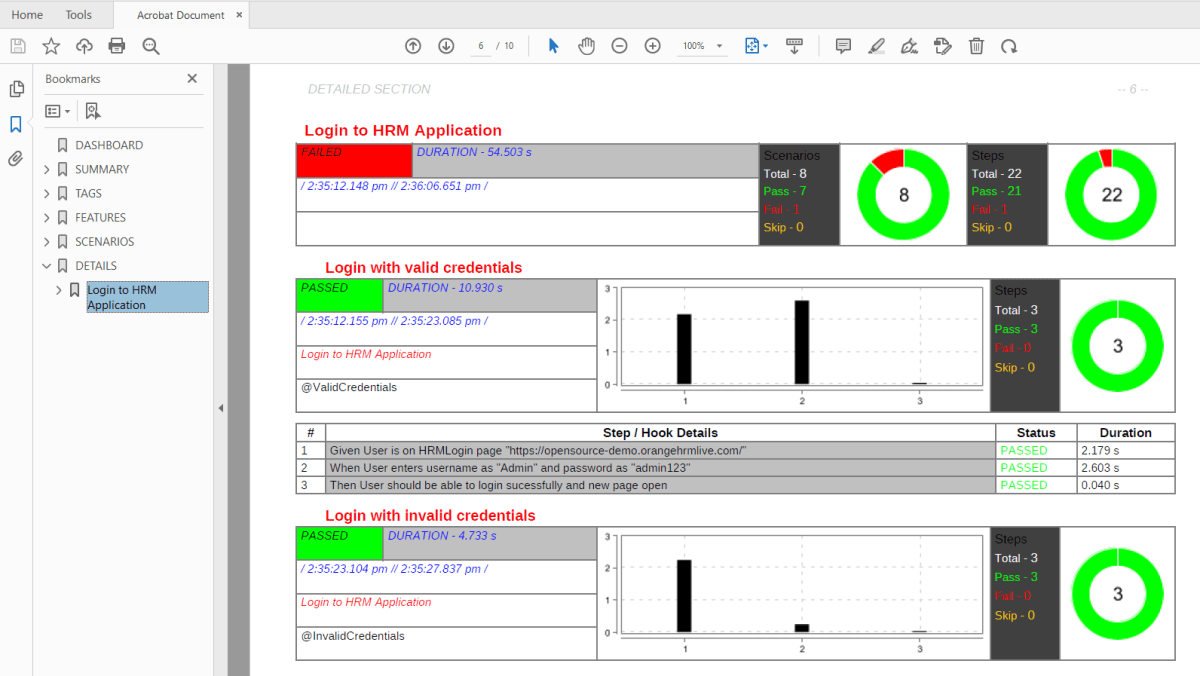

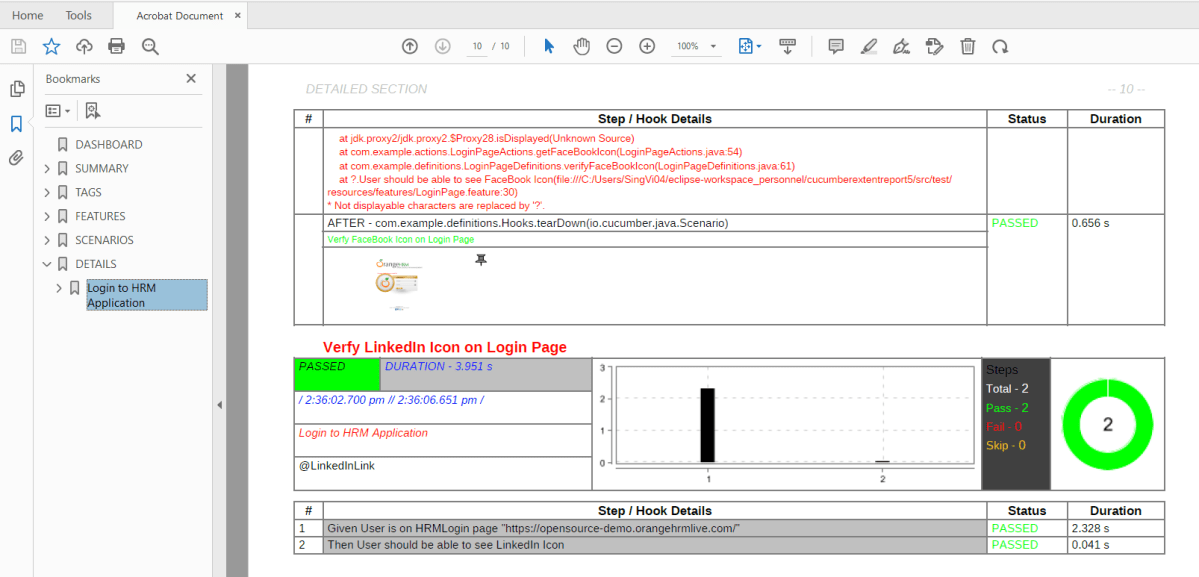
This section also contains screenshots of the failed images.
Customized PDF Report
The report settings can be used to toggle on and off optional report sections, and change the report title, text color for various data, background color, and other options.
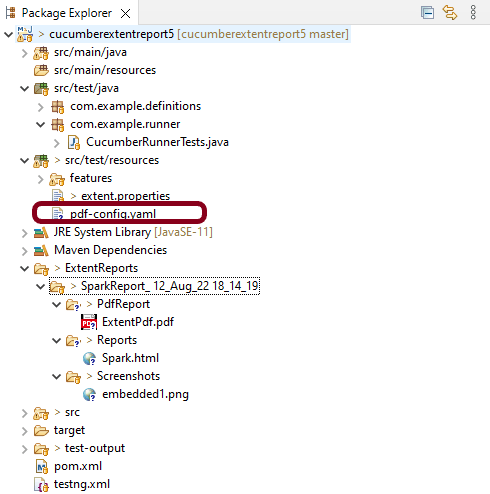
The settings are saved in a YAML file called pdf-config.yaml, which is located in the project’s src/test/resources folder. If the file is missing or no settings are specified, the default values are used. To change the default values, create a pdf-config.yaml file in the project’s src/test/resources folder that contains only the new values for the settings.
A sample YAML configuration file is shown below:
passColor: 05a167
failColor: ff00ff
skipColor: a89132
displayFeature: true
displayScenario: true
displayDetailed: true
displayAttached: false
displayExpanded: true

dashboardConfig:
   title: Cucumber PDF Report
   dataBackgroundColor: 4F0CC8
   titleColor: FF0000
   dateColor: 969696
   timeColor: 000000
   dial:
      featureRanges: 60 95
      scenarioRanges: 70 90
      stepRanges: 75 85
      badColor: f768a1
      averageColor: 93ffff
      goodColor: 32ecab

summaryConfig:
   totalColor: FF0000
   durationColor: FF0000

tagConfig:
   totalColor: FF0000

featureConfig:
   totalColor: FF0000
   durationColor: FF0000

scenarioConfig:
   totalColor: FF0000
   durationColor: FF0000

detailedFeatureConfig:
   featureNameColor: FF0000
   startEndTimeColor: 000000
   tagColor: 404040
   dataHeaderColor: FFFFFF
   dataBackgroundColor: 404040
   totalColor: 0000FF
   durationColor: FFFFFF
   durationBackgroundColor: 404040

detailedScenarioConfig:
   featureNameColor: 404040
   scenarioNameColor: FF0000
   startEndTimeColor: 000000
   tagColor: 404040
   dataHeaderColor: FFFFFF
   dataBackgroundColor: 404040
   totalColor: 0000FF
   durationColor: FFFFFF
   durationBackgroundColor: 404040
   stepChartBarColor: 7f32a8

detailedStepHookConfig:
   stepTextColor: 0000FF
   stepBackgroundColor: FFFFFF
   hookTextColor: 00FF00
   hookBackgroundColor: FFFFFF
   durationColor: FF0000
   errorMsgColor: 000000
   logMsgColor: 000000
Execute the test code. Now the PDF Report will be generated as shown below:
This method of configuring report settings using a yaml properties file can be used both for the Maven plugin report generation and the ExtentReport style.
The passed, failed, and skipped colors can be set with the passColor, failColor and skipColor properties. These take in the colors in hex values (without the leading ‘#’) and are valid throughout the report.
The features, scenarios, and detailed sections can be displayed by setting the displayFeature, displayScenario and displayDetailed properties to true. The default value for these settings is true.

Screenshots are displayed as thumbnails and can be opened in the available native application. This is the default behaviour, in which the screenshot file is embedded in the PDF file. This can be toggled by the displayAttached setting. When the setting is set to false, only the thumbnail is displayed. These can also be displayed in zoomed images in a separate section by setting the displayExpanded to true and also displayAttached to false.
To know more about various settings in PDF Report, refer to this tutorial.
