Integrating JMeter with GitHub using the JMeter Maven plugin enables you to automate performance testing within your CI/CD pipeline. Here’s how you can set up this integration effectively:
Table of Content
- Prerequisite:
- Implementation Steps
- Create a JMeter script
- Create a Maven project and place the JMeter script in it
- Add JMeter Maven Plugin to `pom.xml`
- Run the JMeter tests using the command line
- View the JMeter Test Result
- Create a new repository in GitHub
- Push the Maven JMeter project to GitHub
- Create GitHub Actions and Workflows
- Select the type of Actions
- Generation of Sample pipeline
- Commit the changes
- Verify that the workflow is running
- Verify the JMeter Report published in GitHub
Prerequisite:
- JMeter is installed
- Java is installed
- Maven is installed
- Eclipse or IntelliJ is installed
- Account in GitHub
Implementation Steps
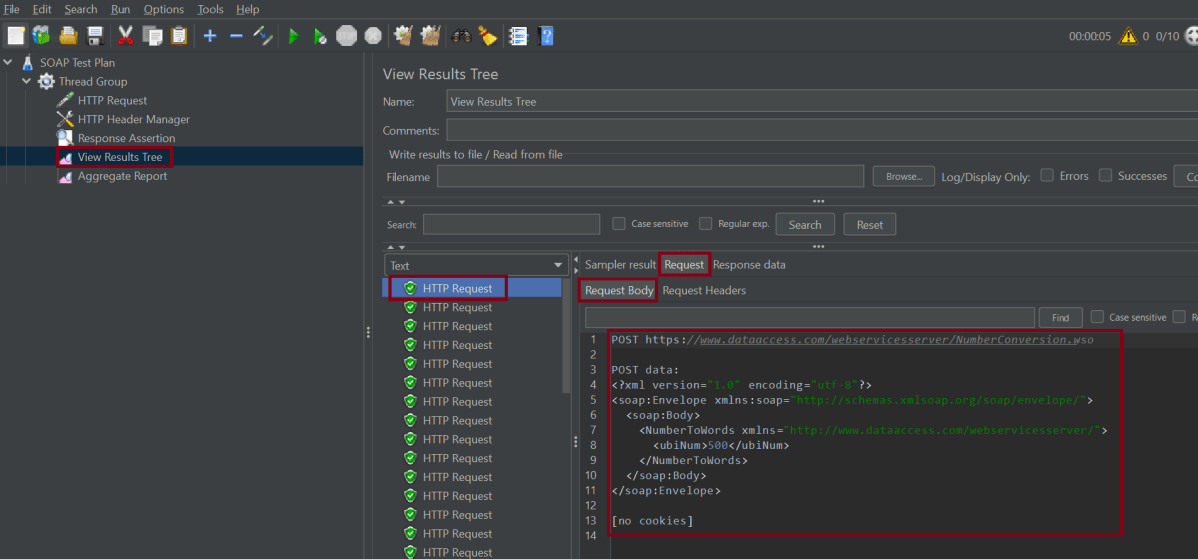
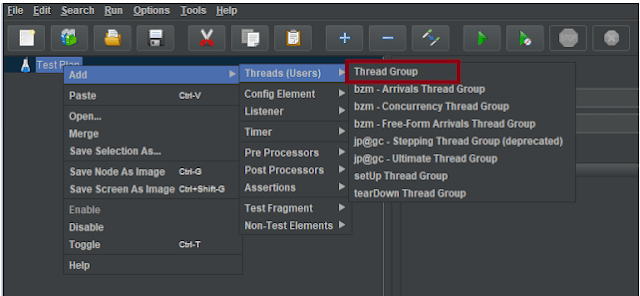
1.Create a JMeter script
Create a JMeter script (.jmx) which load test the application. Here, I have created a JMeter script (.jmx file) for load testing a SOAP web service involves setting up HTTP Request samplers to interact with the SOAP endpoints.

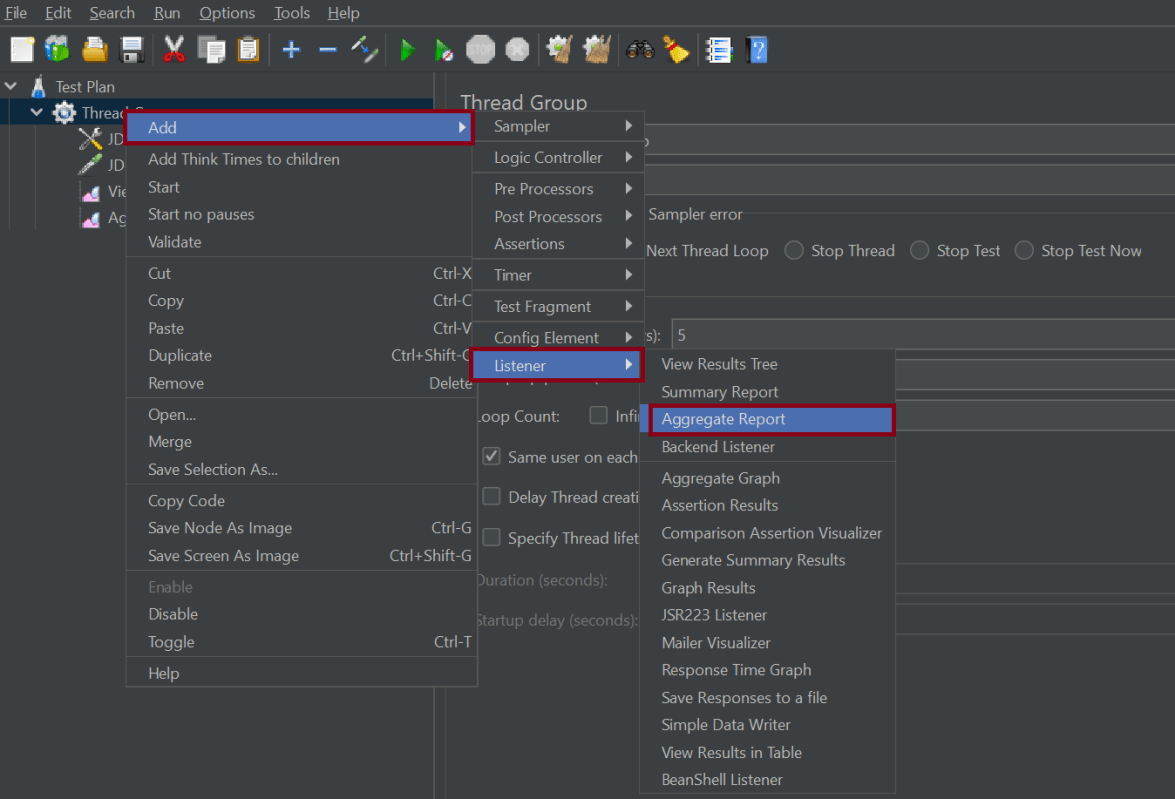
2. Create a Maven project and place the JMeter script in it
Create a Maven project and create a directory in src/test as jmeter and place the JMeter script in it.
For more details, please refer this tutorial – How to use the JMeter Maven Plugin.
3. Add JMeter Maven Plugin to `pom.xml`
Modify the pom.xml to include the JMeter Maven plugin. You can also refer this tutorial to learn to configure JMeter plugin – How to use the JMeter Maven Plugin
<project xmlns="http://maven.apache.org/POM/4.0.0" xmlns:xsi="http://www.w3.org/2001/XMLSchema-instance"
  xsi:schemaLocation="http://maven.apache.org/POM/4.0.0 http://maven.apache.org/xsd/maven-4.0.0.xsd">
  <modelVersion>4.0.0</modelVersion>

  <groupId>com.example</groupId>
  <artifactId>JMeter_GitHub_Integration</artifactId>
  <version>1.0-SNAPSHOT</version>
  <packaging>jar</packaging>

  <name>JMeter_GitHub_Integration</name>
  <url>http://maven.apache.org</url>

  <properties>
    <project.build.sourceEncoding>UTF-8</project.build.sourceEncoding>
  </properties>

  <build>
    <plugins>
      <plugin>
        <groupId>org.apache.maven.plugins</groupId>
        <artifactId>maven-compiler-plugin</artifactId>
        <version>3.14.0</version>
        <configuration>
          <source>17</source>
          <target>17</target>
        </configuration>
      </plugin>

      <plugin>
        <groupId>com.lazerycode.jmeter</groupId>
        <artifactId>jmeter-maven-plugin</artifactId>
        <version>3.8.0</version>
        <executions>
          <!-- Generate JMeter configuration -->
          <execution>
            <id>configuration</id>
            <goals>
              <goal>configure</goal>
            </goals>
          </execution>
          <!-- Run JMeter tests -->
          <execution>
            <id>jmeter-tests</id>
            <goals>
              <goal>jmeter</goal>
            </goals>
          </execution>
          <!-- Fail build on errors in test -->
          <execution>
            <id>jmeter-check-results</id>
            <goals>
              <goal>results</goal>
            </goals>
          </execution>
        </executions>
        <configuration>
          <generateReports>true</generateReports>
        </configuration>
      </plugin>
    </plugins>
  </build>
</project>
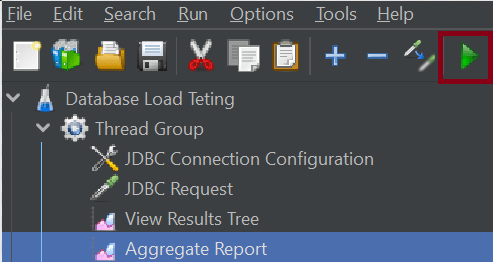
4. Run the JMeter tests using the command line
Use the below command to run the JMeter script using the command line.
mvn clean verify
The output of the above program is


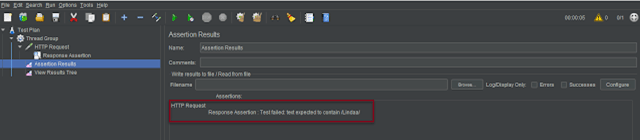
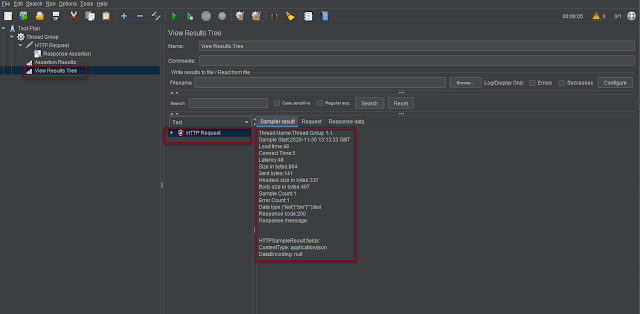
5. View the JMeter Test Result
The results are located at /target/jmeter/reports. You will find an HTML report named “Index.html”:

Right-click on the Index.html and select Open In->Browser->Chrome (any browser of your wish).

6. Create a new repository in GitHub
Please refer to this tutorial to learn to create a new repository in GitHub – How to create a new repository on GitHub

7. Push the Maven JMeter project to GitHub
Use the below commands to push the JMeter_GitHub_Integration project to GitHub.
echo "# JMeter_Github_Integration" >> README.md
git init
git add .
git commit -m "Jmeter Tests"
git branch -M main
git remote add origin https://github.com/vibssingh/JMeter_Github_Integration.git
git push -u origin main

Go to the GitHub and verify that JMeter project is pushed to GitHub.

8. Create GitHub Actions and Workflows
I have a repository available in GitHub – JMeter_GitHub_Integration as shown in the below image. Go to the “Actions” tab. Click on the “Actions” tab.

9. Select the type of Actions
You will see that GitHub recommends Actions depending on the project. In our case, it is recommending actions suitable for a Java project. I have selected the “Java with Maven” option as my project is built in Maven.

10. Generation of Sample pipeline
If you choose an existing option, it will automatically generate a .yaml for the project as shown below.

We will replace the current workflow with the following .yml file as shown below:
name: JMeter Test Run

on:
  push:
    branches: [ "main" ]
  pull_request:
    branches: [ "main" ]

jobs:
  build:

    runs-on: ubuntu-latest

    steps:
    - uses: actions/checkout@v4
    - name: Set up JDK 17
      uses: actions/setup-java@v4
      with:
        java-version: '17'
        distribution: 'temurin'

    - name: Run JMeter tests
      run: mvn clean verify

    - name: JMeter Test Report Generation
      uses: actions/upload-artifact@v4
      if: success() || failure()
      with:
          name: JMeter Report                                             # Name of the folder
          path: target/jmeter/reports/SOAP_Request           # Path to test results
11. Commit the changes
After the changes, hit the “Start Commit” button.

This will give the option to add a description for the commit. It will also enable the user to commit either to the main branch or commit to any other branch that exists in the project. Click on the “Commit new file” button to set up the workflow file.

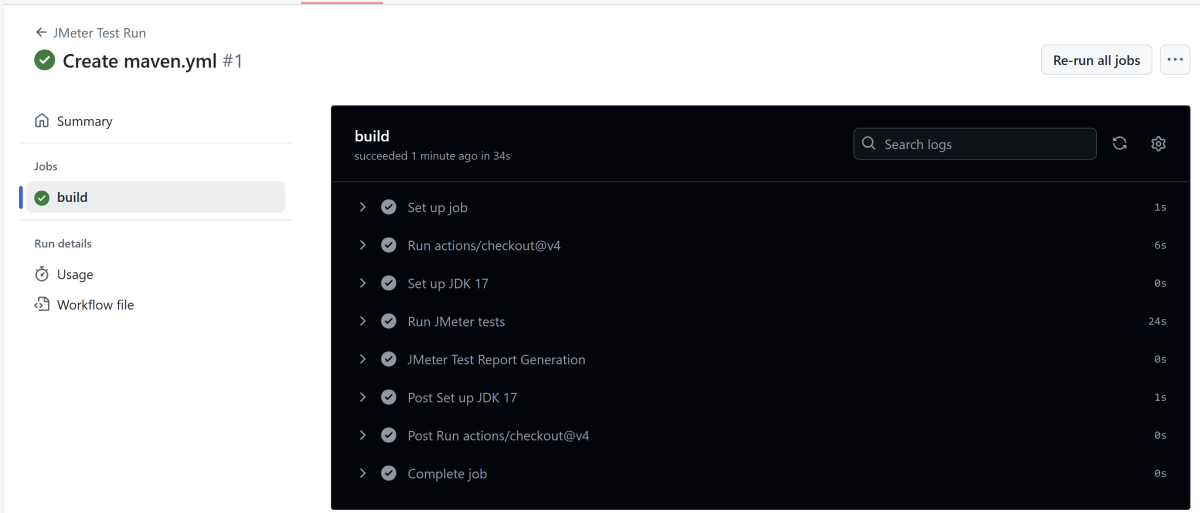
12. Verify that the workflow is running
Next, head over to the “Actions” tab, and you will see your YAML workflow file present under the tab. The yellow sign represents that the job is in the queue.
In Progress – When the job starts building and running, you will see the status change from “Queued” to “in progress”.

Passed – If the build is successful, you will see a green tick mark.

Click on the workflow and the below screen is displayed. It shows the status of the run of the workflow, the total time taken to run the workflow, and the name of the .yml file.
Below shows all the steps of the workflow.
13. Verify the JMeter Report published in GitHub
From the logs of the Workflow, you can see that the Test Report step was executed successfully.
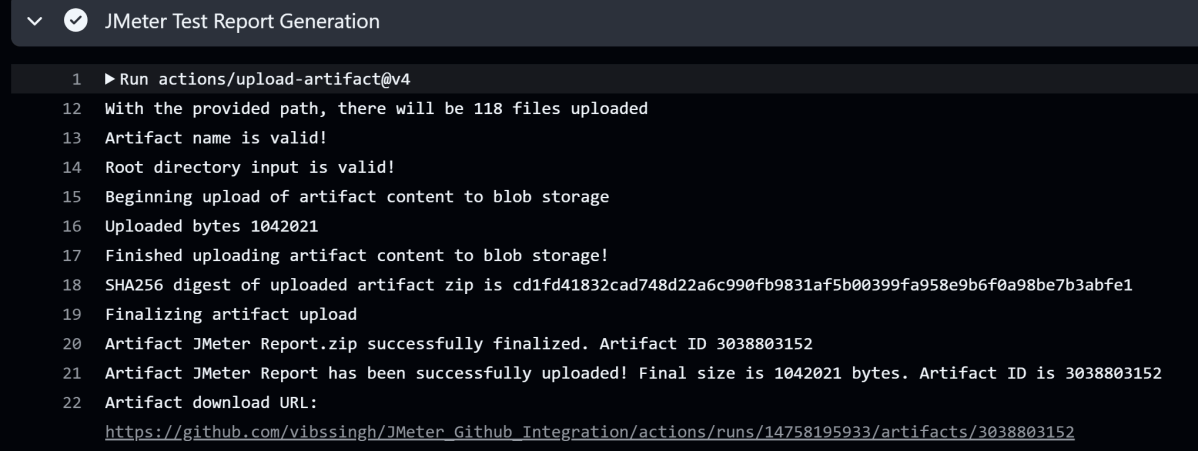
Once the pipeline run, a JMeter Report folder will be generated as shown in the below image:

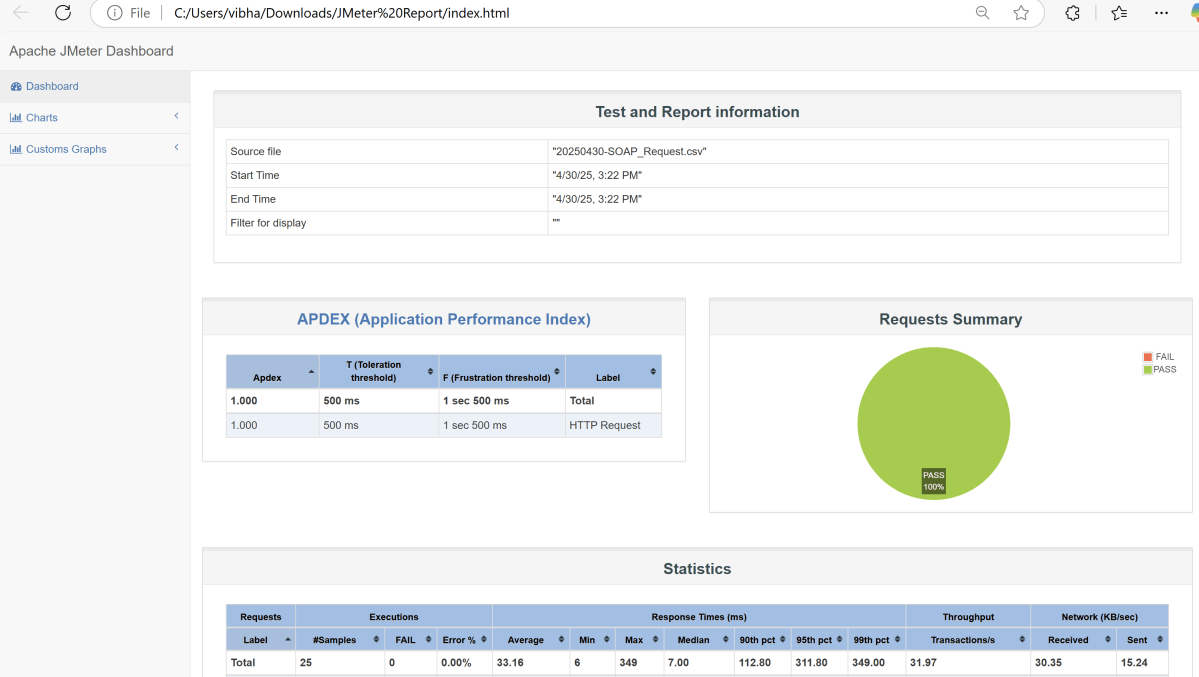
When we click on the folder JMeter Report, a zipped file will be downloaded. We can extract it to see all the files contained within it.
Open the folder and we will see all the files including index.html and others.

Open the index.html and we will see the report.
Congratulations on making it through this tutorial and hope you found it useful! Happy Learning!! Cheers!!


