Serenity BDD is an open-source library that aims to make the idea of living documentation a reality. Serenity BDD helps you write cleaner and more maintainable automated acceptance and regression tests faster. Serenity also uses the test results to produce illustrated, narrative reports that document and describe what your application does and how it works. Serenity tells you not only what tests have been executed, but more importantly, what requirements have been tested
BDD is a set of practices that helps to reduce the rework caused by misunderstanding or vague requirements, narrow the communication gaps between the development team, testing team, and customers, and promote continuous communication among them. Cucumber is one such open-source tool, which supports Behaviour Driven Development(BDD). In simple words, Cucumber can be defined as a testing framework, driven by plain English. It serves as documentation, automated tests, and a development aid – all in one.
Cucumber Introduction, Installation, and Configuration
This tutorial explains how to run the specific tests in JUnit5 using @Tag annotation. Imagine, there are 500 test cases for different functionalities. Out of 500 test cases, 350 tests are related to the Integration test and the rest 150 are for the E2E test. We want to run only Integration tests. How this can be achieved? To overcome this problem, JUnit5 provides a filtering mechanism – @Tag annotation. We can apply the @Tag annotation on a test class test method, or both.
The JUnit Platform enforces the following rules for Tag:
A tag must not be null or blank.
A trimmed tag must not contain whitespace.
A trimmed tag must not contain ISO control characters.
A trimmed tag must not contain any of the following reserved characters.
Let us say we have a number of classes, and we want to execute only this specific test class that is tagged as – @Sprint-5.
Go to the command line or in the case of IntelliJ to the terminal.
mvn clean test -Dgroups="Sprint-5"
In case of windows, use the below command.
mvn clean test -D"groups=Sprint-5"
The result of the above program is
2. Annotating JUnit Test Methods with Tag
With JUnit 5 we can filter tests by tagging a subset of them under a unique tag name.
Scenario 2 – Let’s say we have 5 tests, and we want to run 3 tests in the development environment, 1 test in both development and QA, 1 test in Production, and 1 test In-Progress. So we will tag the tests as below:
import org.junit.jupiter.api.Tag;
import org.junit.jupiter.api.Test;

class JUnit5TagsTests {

    @Test
    @Tag("Development")
    void test1() {
        System.out.println("This test is for Development");
    }

    @Test
    @Tag("Development")
    void test2() {
        System.out.println("This test is for Development");
    }

    @Test
    @Tag("Development")
    @Tag("QA")
    void test3() {
        System.out.println("This test is for Development & QA");
    }

    @Test
    @Tag("Production")
    void test4() {
        System.out.println("This test is for Production");
    }

    @Test
    @Tag("Regression")
    @Tag("QA")
    void test5() {
        System.out.println("This is Regression Test for QA");
    }
}
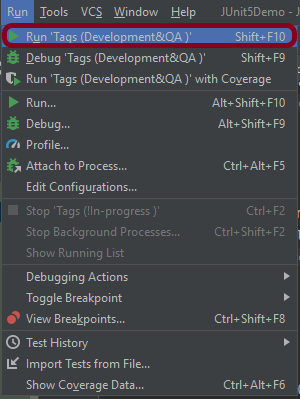
To run the tests tagged with “production” in IntelliJ. Edit the configuration. Click on the Run and select “Edit Configurations”.
Select Tags from a list of components and mention the name of the tag you want to execute. Apply the changes by clicking on the “Apply” button and then click on the “OK” button.
Now, this creates a new Configuration as shown in the below image.
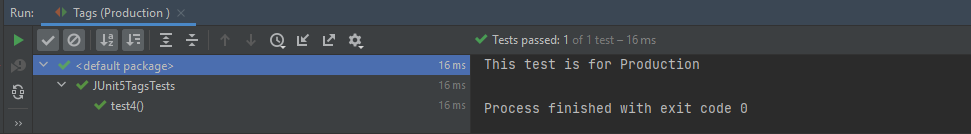
Click on this configuration. It will only run the test method tagged with @Production.
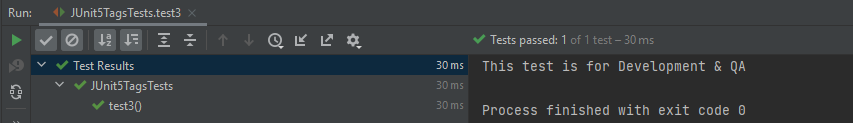
2. We can apply multiple tags on a single test case as well. Here, the test method – test_Calculator() is tagged with @Development and @QA.
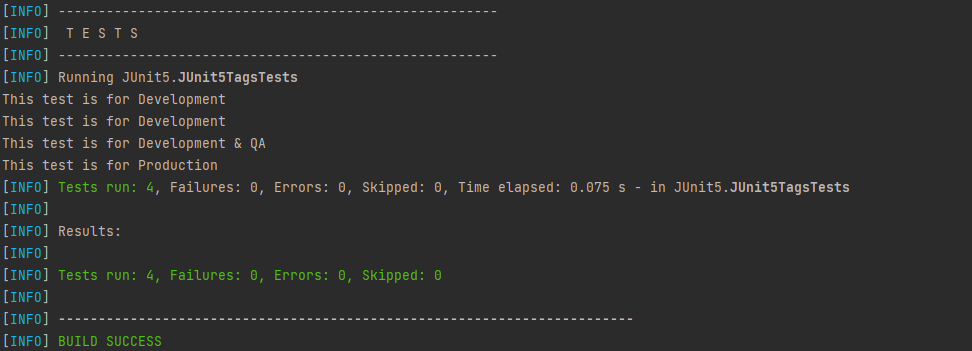
If we now execute this plugin, it will execute all tests that are tagged as Development, QA, Production.
If we want to exclude any specific test from the test execution, mention it with <excludeGroups>
The below-mentioned command will run all the tests except the test tagged with “In-Progress”.
mvn clean test -DexcludeGroups="In-Progress"
4. Creating your own custom tag annotation
If we are using the same tag @Tag(“Security”) or a combination with @Tag(“QA”) in several tests, instead of copying and pasting @Tag(“Security”), @Tag(“QA”) throughout your code base, you can create a custom composed annotation named @SecurityQATest as follows. @SecurityQATest can then be used instead, using 2 annotations every time.
The following example shows you how to create custom tag annotation for @Tag(“Security”), @Tag(“QA”).
Rest–Assuredis a Java-based library that is used to test RESTful Web Services. REST-assured was designed to simplify the testing and validation of REST APIs. It takes influence from testing techniques used in dynamic languages such as Ruby and Groovy.
Rest Assured enables you to test REST APIs using Java libraries and integrates well with Maven/Gradle. REST Assured is a Java library that provides a domain-specific language (DSL) for writing powerful, maintainable tests for RESTful APIs.
What is JUnit5?
JUnit 5 is the next generation of JUnit. JUnit 5 is composed of several different modules from three different sub-projects.
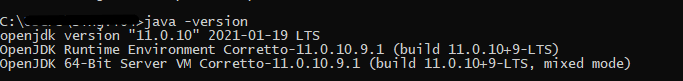
Java needs to be present on the system to run the tests. Click here to know How to install Java. To know if Java is installed or not on your machine, type this command in the command line. This command will show the version of Java installed on your machine.
java -version
Step 2 – Download and setup Eclipse IDE on the system
The Eclipse IDE (integrated development environment) provides strong support for Java developers, which is needed to write Java code. Click here to learn How to install Eclipse.
Step 3 – Setup Maven
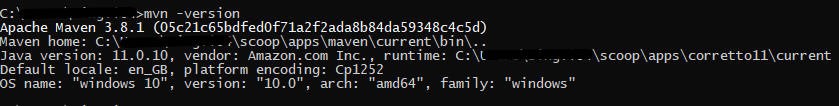
To build a test framework, we need to add a number of dependencies to the project. It is a very tedious and cumbersome process to add each dependency manually. So, to overcome this problem, we use a build management tool. Maven is a build management tool that is used to define project structure, dependencies, build, and test management. Click here to learn How to install Maven.
To know if Maven is already installed or not on your machine, type this command in the command line. This command will show the version of Maven installed on your machine.
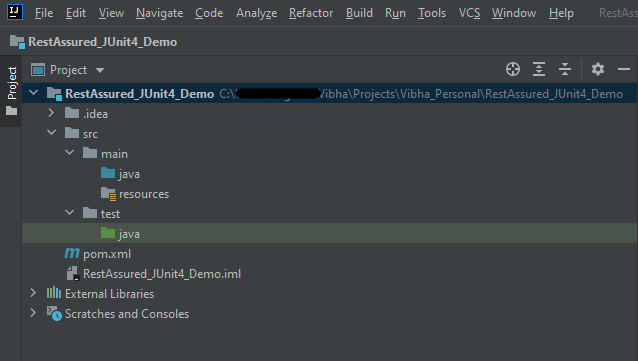
The tests should be written in src/test/java directory. To learn how to create a JSON Request body using JSONObject, please refer to this tutorial.
import io.restassured.http.ContentType;
import org.json.JSONObject;
import org.junit.jupiter.api.Test;
import static io.restassured.RestAssured.given;
import static org.hamcrest.Matchers.equalTo;
public class APITests {
String BaseURL = "https://reqres.in/api";
@Test
public void createUser() {
JSONObject data = new JSONObject();
data.put("name", "NewUser1");
data.put("job", "Testing");
// GIVEN
given()
.contentType(ContentType.JSON)
.body(data.toString())
// WHEN
.when()
.post(BaseURL + "/users")
// THEN
.then()
.statusCode(201)
.body("name", equalTo("NewUser1"))
.body("job", equalTo("Testing"))
.log().all();
}
@Test
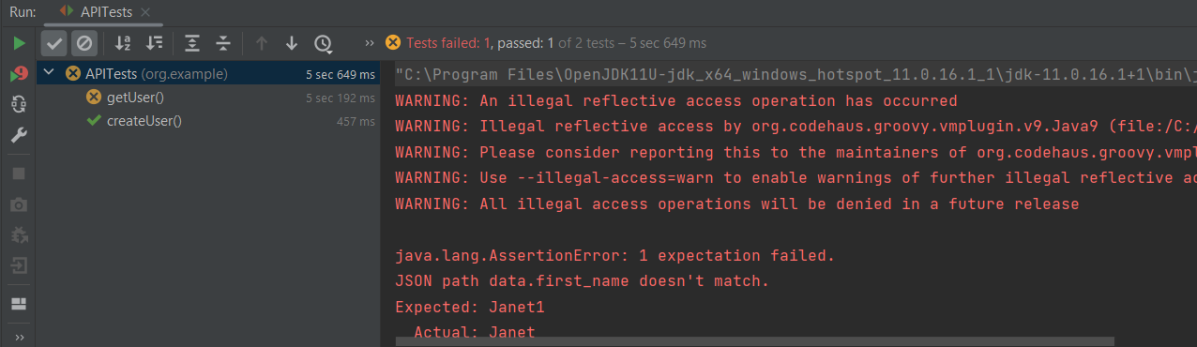
public void getUser() { //Failed Test
// GIVEN
given()
.contentType(ContentType.JSON)
// WHEN
.when()
.get(BaseURL + "/users/2")
// THEN
.then()
.statusCode(200)
.body("data.first_name", equalTo("Janet1"))
.log().all();
}
}
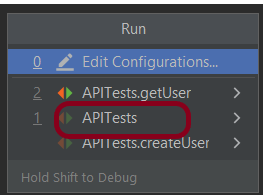
Step 7 – Test Execution through JUnit Test
Go to the Runner class and right-click Run As JUnit Test. The tests will run as JUnit tests.
Below is the image to run the tests in IntelliJ.
This is how the execution console will look like.
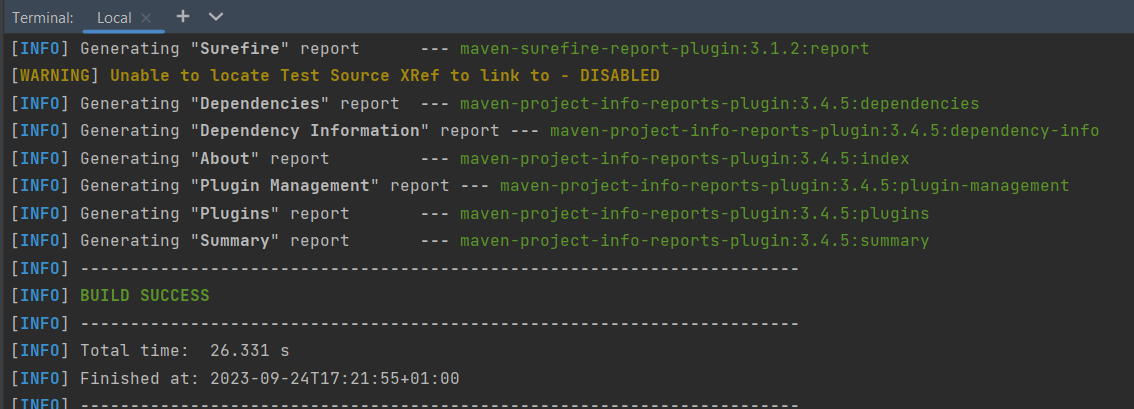
Step 8 – Run the tests from the command line
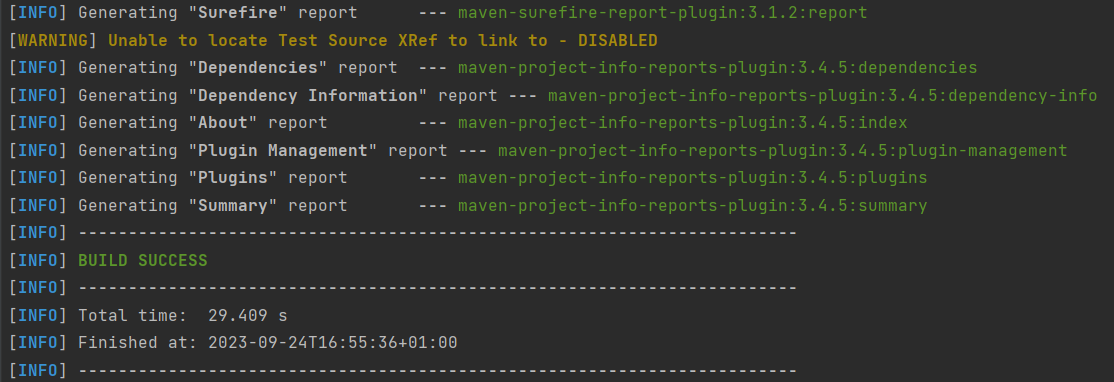
Maven Site Plugin creates a folder – site under the target directory, and the Maven Surefire Report plugin generates the JUnit Reports in the site folder. We need to run the tests through the command line to generate the JUnit Report.
mvn clean test site
The output of the above program is
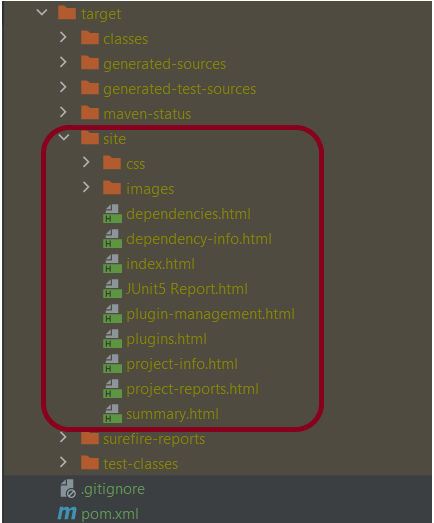
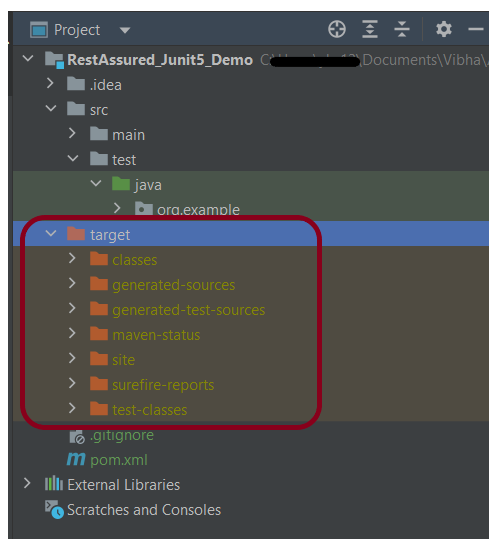
Step 9 – Report Generation
After the test execution, refresh the project, and a new folder with the name site in the target folder will be generated. This folder contains the reports generated by JUnit. The structure of the folder site looks as shown below.
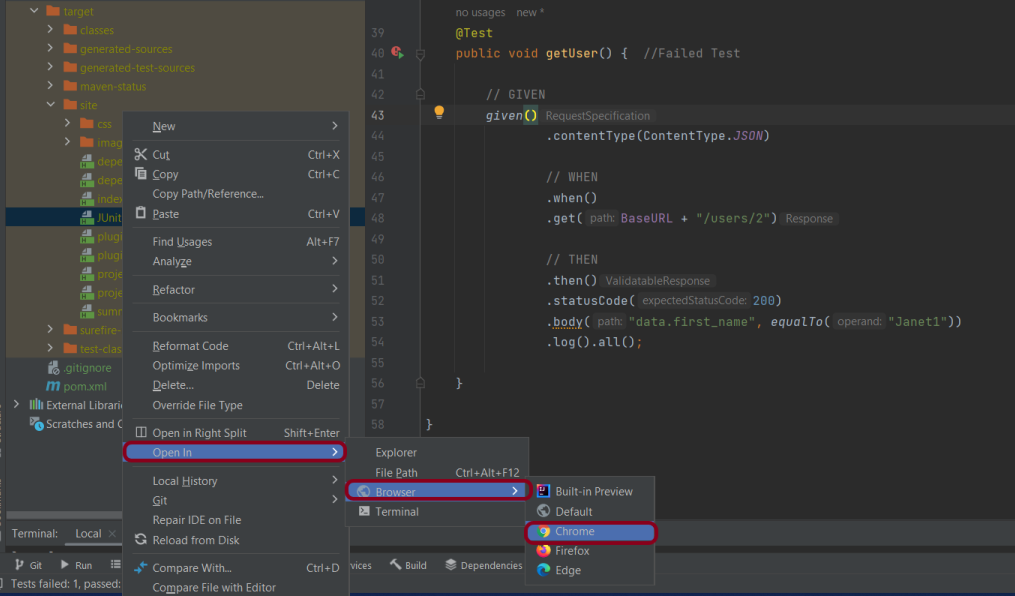
View the Report
Right-click on the Junit5 Report.html and select Open In -> Browser ->Chrome.
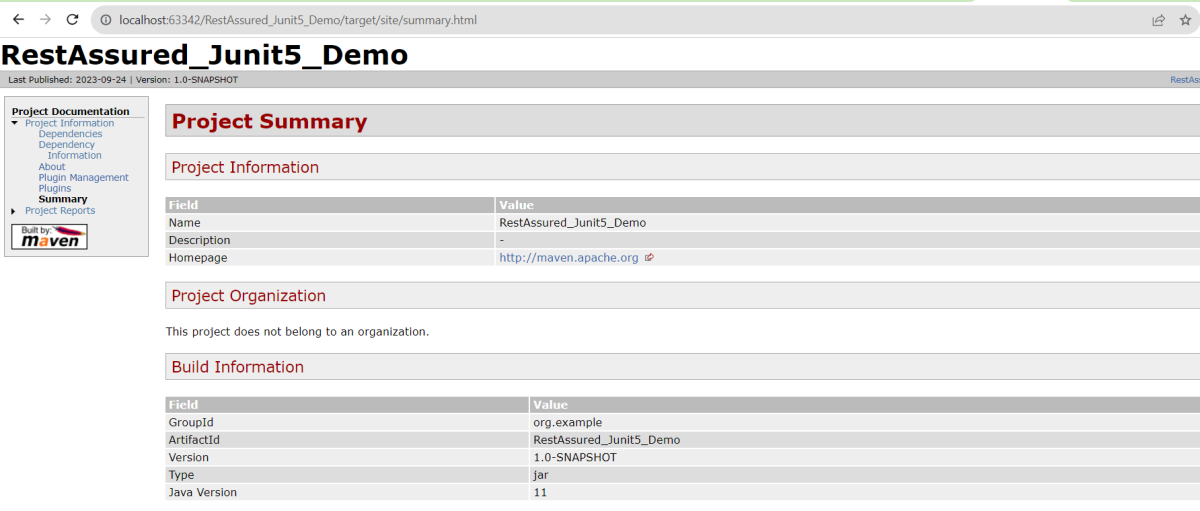
Summary Report
Below is the summary Report.
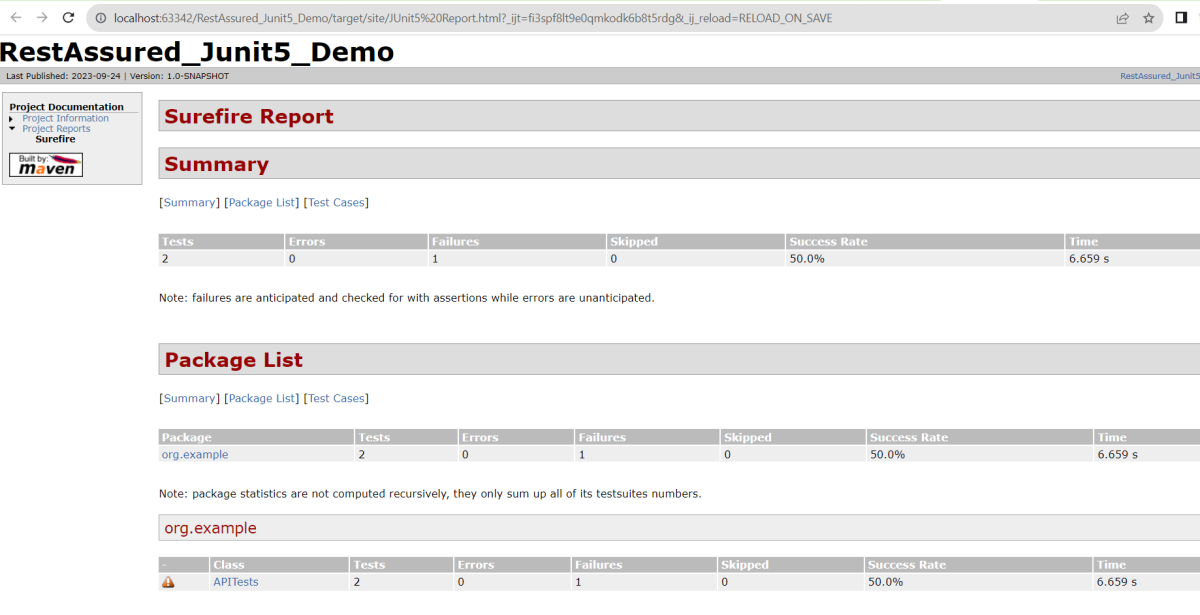
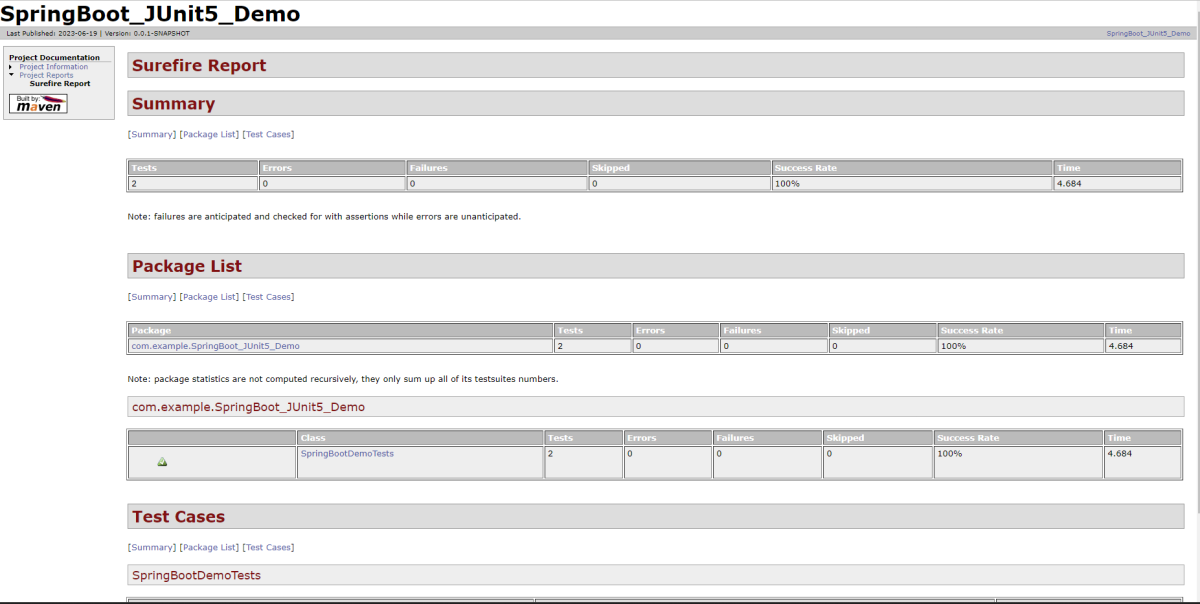
Surefire Report
Below is an example of a Surefire Report. This report contains a summary of the test execution.
We are done! Congratulations on making it through this tutorial and hope you found it useful! Happy Learning!!
In this tutorial we will discuss to create a JUnit project using IntelliJ. We will be at first creating a simple Java Project and will add JUnit5 as well as create a Maven Project, then we will add a basic Class and a JUnitTest for it.
Step 2 – Right click on the project and select Open Module Settings.
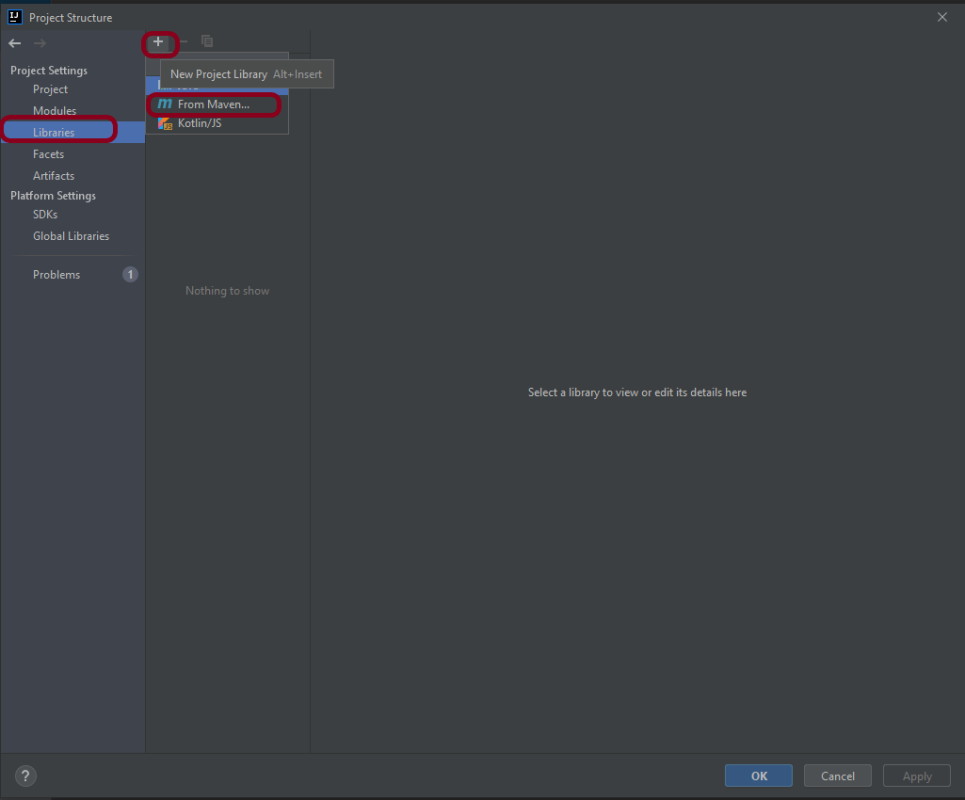
Step 3 – Go to the “Libraries” group, click the little plus (look up), and choose “From Maven…” option.
Step 4 – Search for “junit” — something like “junit:junit-4.13“. Click the “OK“ button.
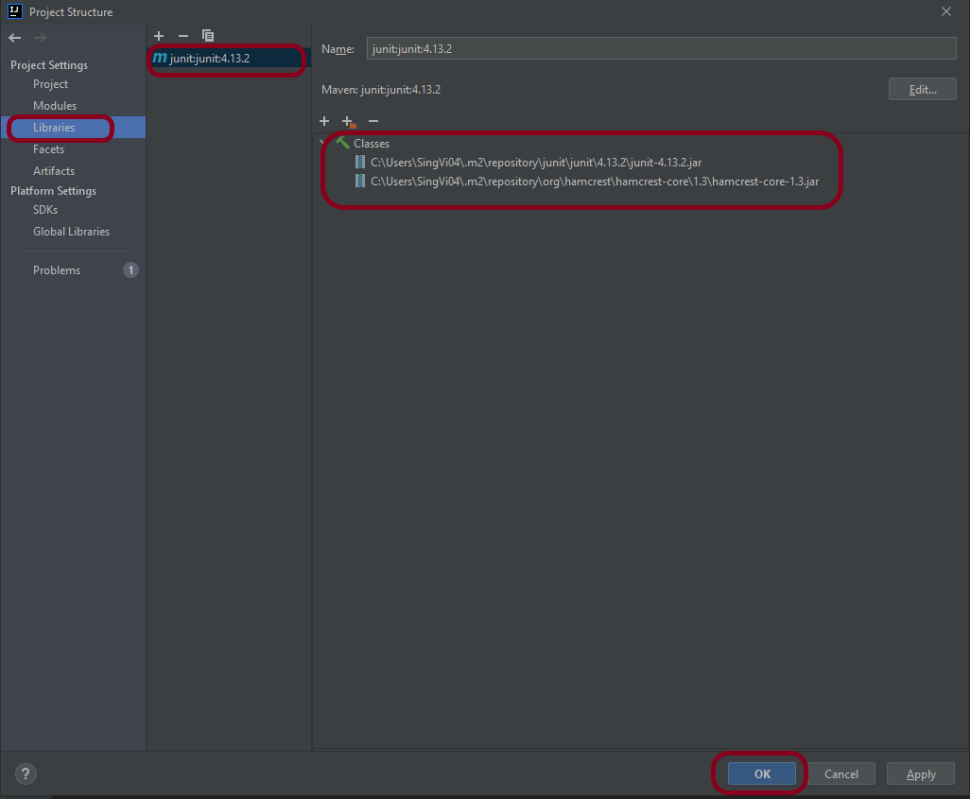
Step 5– A new dialog will appear to confirm that “junit:junit:4.13.2” will be added to the module. Click the “OK“ button.
Step 6 – This screens shows that junit:junit:4.13.2 is added to the Libraries. It contains the highlighted classes – junit-4.13.2.jar and hamcrest-core-1.3.jar. Click the “OK” button.
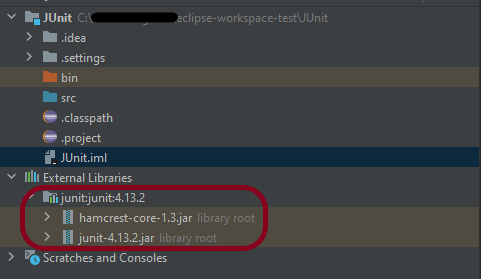
Step 7– This image shows that the Junit is added to the External Libraries.
Step 8– Create a Java Class – JUnit4Test under src and create a JUnit test to verify that it is installed properly.
import org.junit.Assert;
import org.junit.Test;

public class JUnit4Test {

    @Test
    public void Test() {

        String str1 = "Happy";
        String str2 = new String("Happy");
        Assert.assertEquals("String1 and String 2 are equal",str1, str2);

    }
}
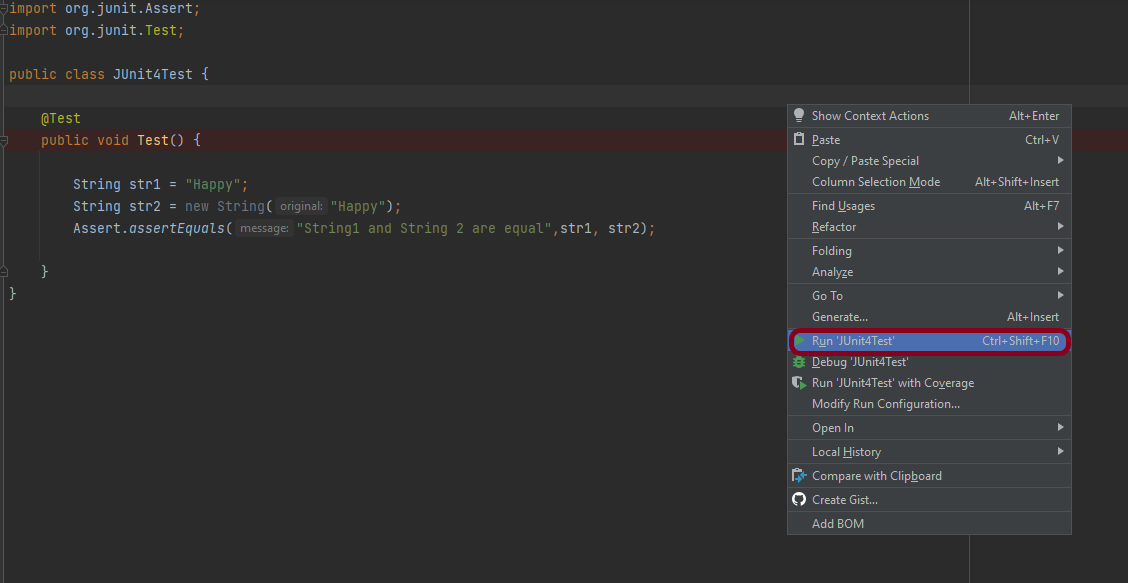
Step 9– There are many ways to run the test. One of the way is to Right-Click and select Run JUnit4Test
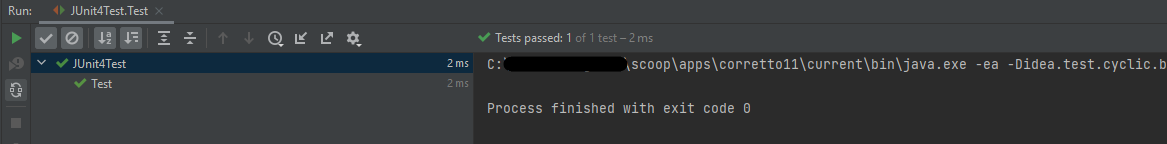
The successful execution of the test shows that the JUnit is configured properly.
Create a Maven Project
Add Junit dependency to the POM.xml and build the project.
Now we need to apply the changes in the build script. Press Ctrl+Shift+O or click Load Maven Changes in the notification that appears in the top-right corner of the editor.
Create a Java Class – JUnit4Test under src/test/javaand create a JUnit test to verify that it is installed properly.
import org.junit.Test;
import static org.junit.Assert.assertArrayEquals;

public class JUnitMavenTest {

    @Test
    public void Test() {

        String[] expected = {"happy","days","summer","spring"};
        String[] actual = {"happy","days","summer","spring"};

        assertArrayEquals("Expected and Actual Arrays are not equal",expected,actual);

    }
}
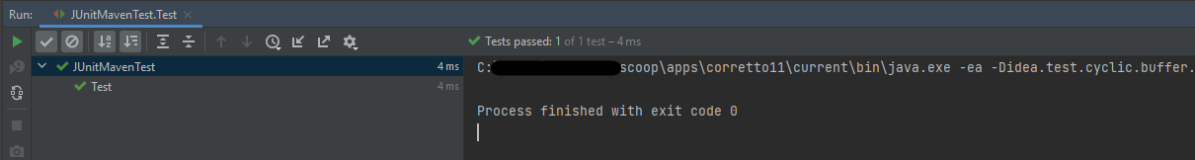
The output of the above program is
Similarly, to add JUnit5 we can add below mentioned dependencies to the POM.xml.
JUnit is an open source Unit Testing Framework for JAVA. JUnit is a simple framework to write repeatable tests. It is an instance of the xUnit architecture for unit testing frameworks.
For the successful execution of Agile testing requirements, a perfect test automation tool is required. And there are numerous factors to consider when creating a solid automation framework. One such component is reporting, which not only informs you of the success or failure of the project but also assists you in identifying potential bugs. JUnit is another useful framework that can add the ability to generate reports in Selenium. This tutorial explains the steps to generate the JUnit5 Report.
GitLab automatically enables CI/CD pipelines for new projects. It’s just a matter of adding a new configuration file called .gitlab-ci.yml to your code repository with instructions for GitLab on what to run. So simply create the following basic workflow in your main repository directory and commit it:
By default, GitLab will have CI/CD pipelines and Auto DevOps enabled for all projects. What this means is that, when you push code to the repository, GitLab will automatically trigger the pipeline.
Step 3 – Create a .gitlab-ci.yml file in the project in GitLab
There are many ways to create a new file in GitLab. One of the ways is to create a file as shown in the below image. I have already created a .gitlab-ci.yml in the project, which can be seen in the image.
It is a YAML file where you configure specific instructions for GitLab CI/CD. In the.gitlab-ci.yml, we can define:
The scripts you want to run.
Other configuration files and templates you want to include.
Dependencies and caches.
The commands you want to run in sequence and those you want to run in parallel.
The location to deploy your application to.
Whether you want to run the scripts automatically or trigger any of them manually.
Below is a sample example to run the SpringBoot project (Maven) in the GitLab pipeline.
image: maven:3.8.5-openjdk-17

stages:
  - test

variables:
  MAVEN_OPTS: "-Dmaven.repo.local=.m2/repository"

test:
  stage: test
  allow_failure: true

# Run the tests
  script:
    - echo "Executing SpringBoot scenarios with maven"
    - mvn clean test site

# Store artifacts
  artifacts:
    when: always
    name: "SpringBoot Report"
    paths:
    - target/site/*
    expire_in: 24 h
Image – maven:3.8.5-openjdk-17 is used in this test. It is a docker image for Maven and has Java 17 installed in it.
Pipeline configuration begins with jobs. Jobs are the most fundamental element of a .gitlab-ci.yml file.
Jobs can output an archive of files and directories. This output is known as a job artifact. The expire_in keyword determines how long GitLab keeps the job artifacts. Here, it shows 24 hrs to retain the artifacts.
Step 4 – Schedule the pipeline
To schedule the pipeline, go to the left panel and click on the Build option. There are several sub-options in the Build option, click on the Pipeline Schedules.
Click on the button “New Schedule” to create a schedule for the pipeline.
To add a pipeline schedule, we need to fill in the details displayed on this page.
Description – Provide the description of the project
Interval Pattern – Select one of the preconfigured intervals, or enter a custom interval in cron notation. Here, I have used 30 16 * * *, which means the job is scheduled to run every day at 4:30 PM.
Cron TimeZone – Mention the timezone in which the job should run. Here, I have used [UTC+1]Dublin timezone.
Target branch or tag – Select the branch or tag for the pipeline. Here, I have selected the “main” branch.
Click on the “Save pipeline schedule”.
Step 5 – Verify that the job is scheduled
Below is the image of the newly created pipeline. This shows all the necessary details like description, target, last pipeline, next run, and owner.
The “Next Run” shows the expected time to run the pipeline. Here, it shows that the run is going to start.
This image shows that the run has started, and it is in a pending state right now.
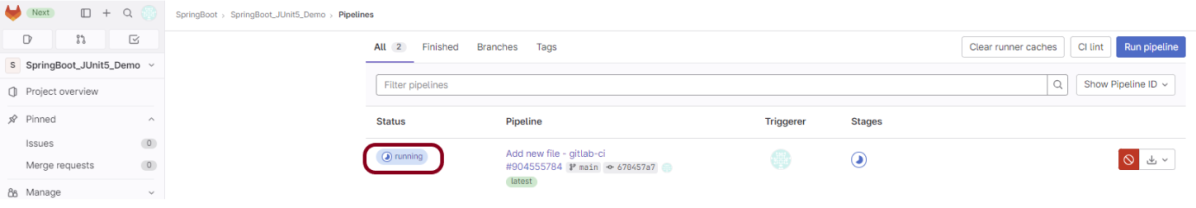
Step 6 – Run the tests in the GitLab pipeline
The pipeline runs automatically as per the time specified in the “Interval Pattern”. The below image shows that the tests are running in the GitLab pipeline.
Step 7 – Check the status of the pipeline
Once the Status of the pipeline changes to either failed or passed, that means the tests are already executed.
As you can see, the Status is passed, its green colour. This means all the tests present in the test suite are executed and passed. If any test fails in the test suite, the final execution status will be brown. The reason for the brown colour is we have mentioned allow_failure: true.
Below is the execution status report in the GitLab pipeline.
I have added an artifact also in the .gitalb-ci.yml, which is highlighted in the image. This artifact creates a folder with the name “SpringBoot_Report”and the reports in this folder come from the path /target/site. This artifact gives us the option to download the reports or browse the report. This report will be available for 24 hours only as mentioned in the gitlab-ci.yml.
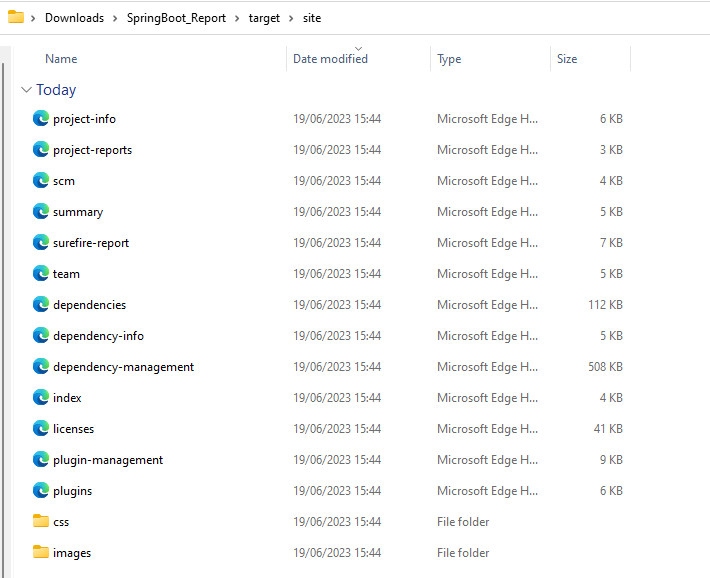
Step 8 – Download the report
Once, will click on the download button, it will download “SpringBoot_Report.zip”. Unzip the folder and it looks like something as shown below:
Example of SureFire-Report.html
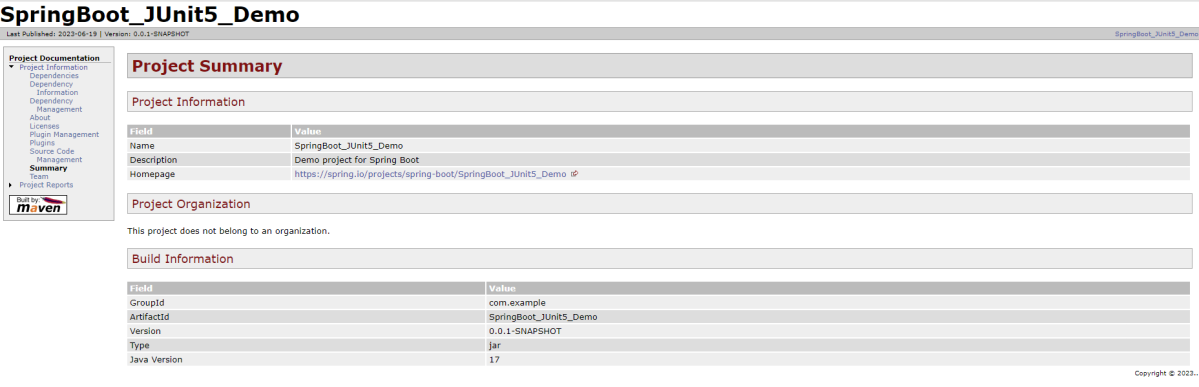
Example of Project Summary Report
How to schedule a cron job?
Five fields that are separated by whitespace make up a scheduling item. By adding more than one entry, you can schedule a job for more than one time.
Minute
Hour
Day of Month
Month
Day of week
MINUTE (0-59), HOUR (0-23), DAY (1-31), MONTH (1-12), DAY OF THE WEEK (0-6)
Each field can contain an exact value or use a set of special expressions:
The asterisk * indicates all valid values. So, a job that runs every day has a * in the third field.
A dash separates ranges of values. For example, a job that runs every hour from 9:00 a.m. to 5:00 p.m. would have 9-17 in the second field.
Intervals are specified with a slash /. A job that runs every 15 minutes has H/15 in the first field. Note that the H in the first field has a special meaning. If you wanted a job to run every 15 minutes, you could configure it as 0/15, which would make it run at the start of every hour.
Finally, you can specify multiple values with a comma. So, a job that runs Monday, Wednesday, and Friday would have 1,3,5 in the fifth field.
Here are several special predefined values that can be used to substitute the expressions in the cron.
Entry
Description
Description
@yearly
Run at any time during the year
H H H H *
@annually
Run at any time during the year
H H H H *
@monthly
Run at any time during the month
H H H * *
@weekly
Run at any time during the week
H H * * H
@daily
Run at any time during the day
H H * * *
@hourly
Run at any time during the hour
H * * * *
Here are the most common examples of cron job schedules that can be found in almost any crontab on Linux :
Schedule
Job
* * * * *
Run cron job every minute
H/5 * * * *
Run cron job every 5 minutes
H/30 * * * *
Run cron job every 30 minutes
0 * * * *
Run cron job every hour
0 H/3 * * *
Run cron job every 3 hours
0 13 * * *
Run cron job every day at 1pm
30 2 * * *
Run cron job every day at 2:30 am
0 0 * * *
Run cron job every day at midnight
0 0 * * 0
Run cron job every Sunday
0 0 * * 1
Run cron job every Monday
0 0 1 * *
Run cron job every first day of every month
0 0 1 1 *
Run cron job every first of January every year
Congratulations. This tutorial has explained the steps to schedule the pipeline in GitLab CI/CD. Happy Learning!!
The previous tutorial explained the generation of Allure Report with Cucumber5, Selenium and JUnit4 in a Maven project. In this tutorial, I will explain the steps to create an Allure Report with Cucumber7, Selenium, and JUnit5 in a Maven project.
Step 2 – Create Step Definition, feature file, and Test Runner Classes
Create Locator and Action classes and Step Definition corresponding to the feature file and Test Runner Class
There is another tutorial that explains the project structure as well as the feature file and corresponding Step Definitions, please refer to this tutorial – Integration of Cucumber7 with Selenium and JUnit5.
Step 3 – Execute the Tests
Use the below command to run the tests
mvn clean test
The output of the above program is
Step 4 – Generate the Allure Report
Once the test execution is finished, a folder named allure-results will be generated in thetarget folder.
To generate the Allure Report, first, go to the target folder.
cd target
Now, use the below command to generate the Allure Report
allure serve
This will generate the beautiful Allure Test Report as shown below.
Allure Report Dashboard
The overview page hosts several default widgets representing the basic characteristics of your project and test environment.
Statistics – overall report statistics.
Launches – if this report represents several test launches, statistics per launch will be shown here.
Behaviours – information on results aggregated according to stories and features.
Executors – information on test executors that were used to run the tests.
History Trend – if tests accumulate some historical data, its trend will be calculated and shown on the graph.
Environment – information on the test environment.
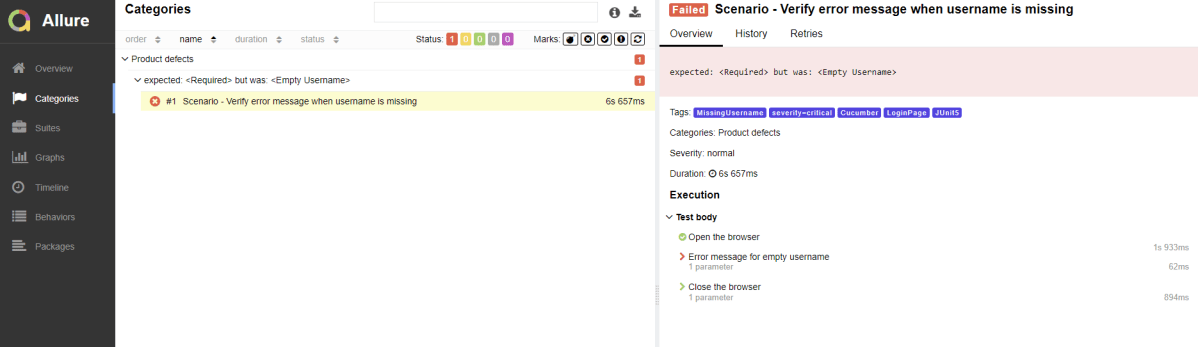
Categories in Allure Report
The categories tab gives you a way to create custom defect classifications to apply for test results. There are two categories of defects – Product Defects (failed tests) and Test Defects (broken tests).
Suites in Allure Report
On the Suites tab a standard structural representation of executed tests, grouped by suites and classes can be found.
Graphs in Allure Report
Graphs allow you to see different statistics collected from the test data: status breakdown or severity and duration diagrams.
Timeline in Allure Report
The timeline tab visualizes retrospective test execution, allure adaptors collect precise timings of tests, and here on this tab, they are arranged accordingly to their sequential or parallel timing structure.
Behaviors of Allure Report
This tab groups test results according to Epic, Feature, Story, Test Severity, Test Description, Test Steps, and so on.
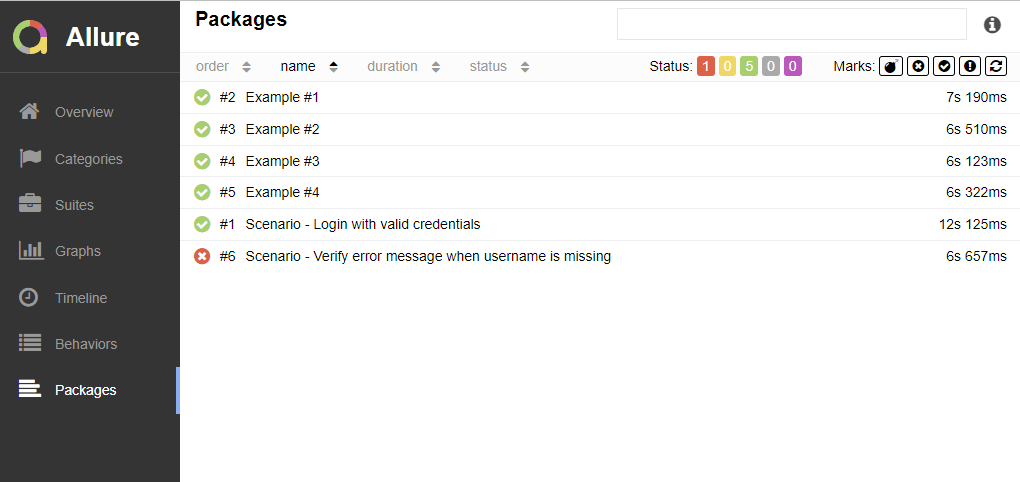
Packages in Allure Report
The packages tab represents a tree-like layout of test results, grouped by different packages.
Congratulations on making it through this tutorial and hope you found it useful! Happy Learning!! Cheers!!