This tutorial explains the process to schedule the run of the GitLab pipeline. This is a very important step towards achieving CI/CD.
Table of Contents
Prerequisite:
- GitLab Account
Please refer to this tutorial to get the structure and code of the SpringBoot project – Testing of SpringBoot Application with JUnit5
What is GitLab CI/CD Workflow?
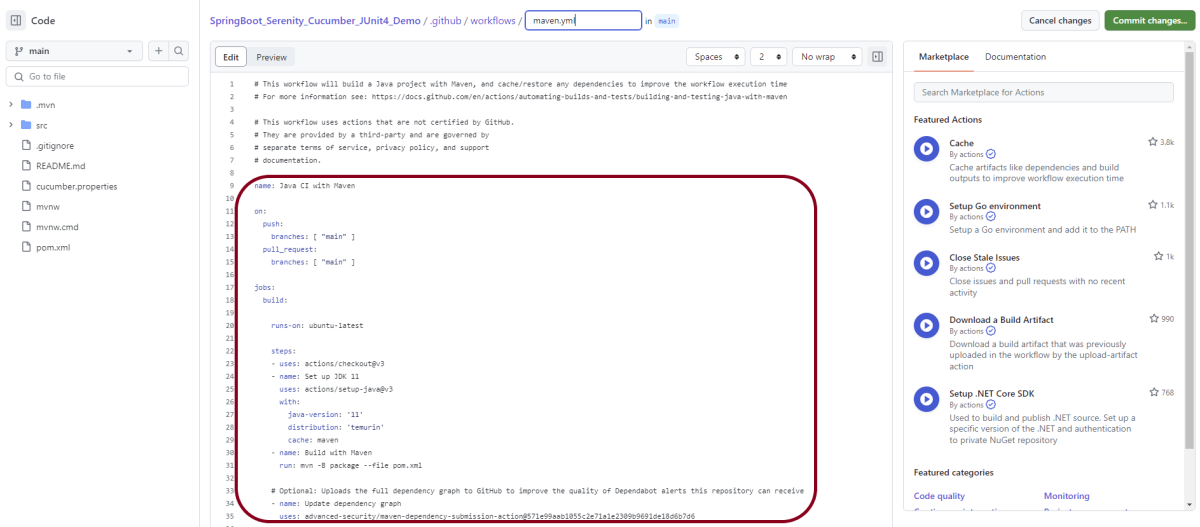
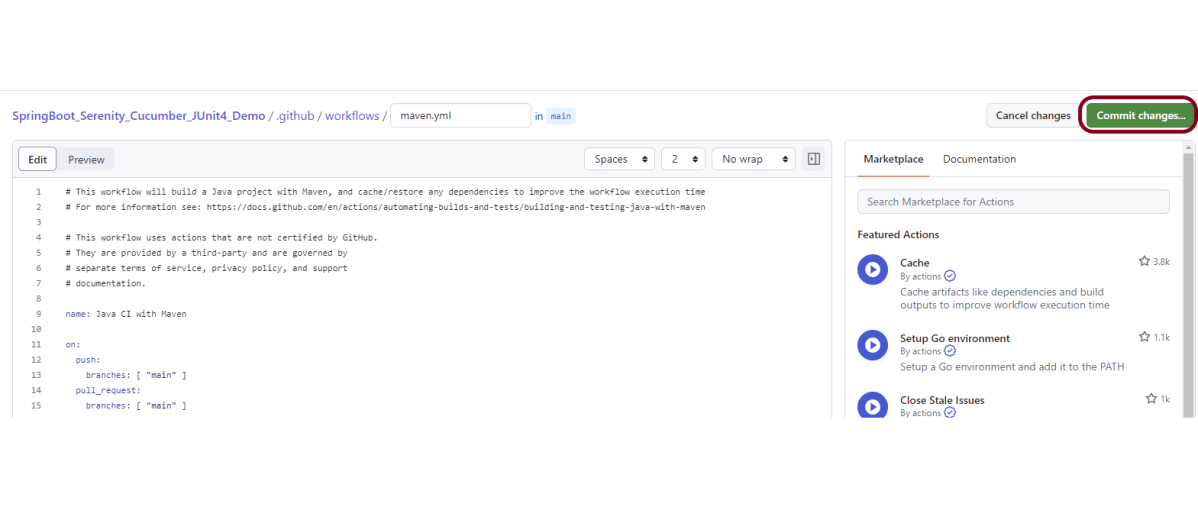
GitLab automatically enables CI/CD pipelines for new projects. It’s just a matter of adding a new configuration file called .gitlab-ci.yml to your code repository with instructions for GitLab on what to run. So simply create the following basic workflow in your main repository directory and commit it:
By default, GitLab will have CI/CD pipelines and Auto DevOps enabled for all projects. What this means is that, when you push code to the repository, GitLab will automatically trigger the pipeline.
GitLab Section
Step 1 – Create a blank project in GitLab
To know, how to create a blank new project in GitLab, please refer to How to create a new project in GitLab.
Step 2 – Push the project from the local repository to GitLab Repository
To know, how to push the changes to GitLab, please refer to How to push new local GIT Repository to GitLab.
Step 3 – Create a .gitlab-ci.yml file in the project in GitLab
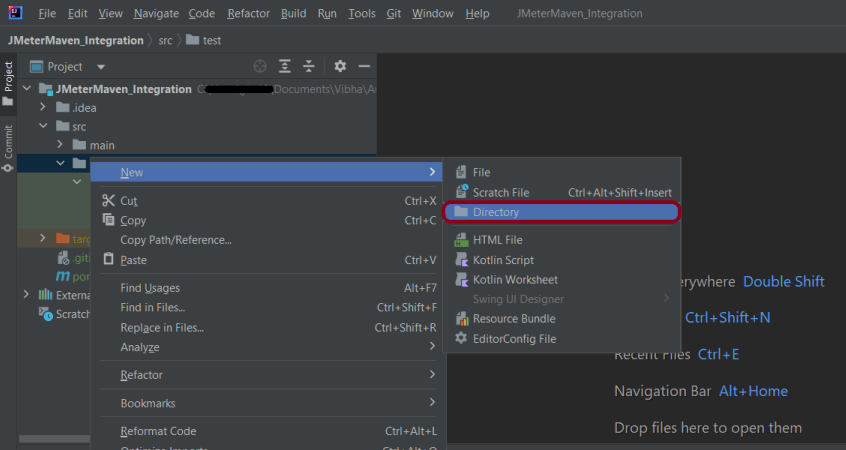
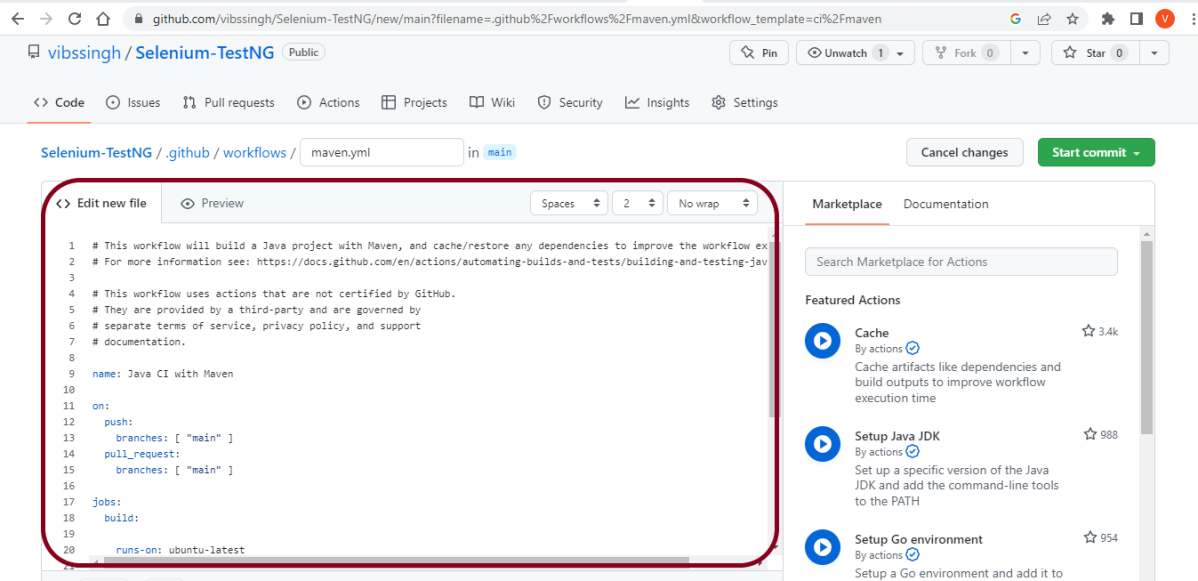
There are many ways to create a new file in GitLab. One of the ways is to create a file as shown in the below image. I have already created a .gitlab-ci.yml in the project, which can be seen in the image.

It is a YAML file where you configure specific instructions for GitLab CI/CD. In the .gitlab-ci.yml, we can define:
- The scripts you want to run.
- Other configuration files and templates you want to include.
- Dependencies and caches.
- The commands you want to run in sequence and those you want to run in parallel.
- The location to deploy your application to.
- Whether you want to run the scripts automatically or trigger any of them manually.
Below is a sample example to run the SpringBoot project (Maven) in the GitLab pipeline.
image: maven:3.8.5-openjdk-17

stages:
  - test

variables:
  MAVEN_OPTS: "-Dmaven.repo.local=.m2/repository"

test:
  stage: test
  allow_failure: true

# Run the tests
  script:
    - echo "Executing SpringBoot scenarios with maven"
    - mvn clean test site

# Store artifacts
  artifacts:
    when: always
    name: "SpringBoot Report"
    paths:
    - target/site/*
    expire_in: 24 h
Image – maven:3.8.5-openjdk-17 is used in this test. It is a docker image for Maven and has Java 17 installed in it.
Pipeline configuration begins with jobs. Jobs are the most fundamental element of a .gitlab-ci.yml file.
Jobs can output an archive of files and directories. This output is known as a job artifact. The expire_in keyword determines how long GitLab keeps the job artifacts. Here, it shows 24 hrs to retain the artifacts.
Step 4 – Schedule the pipeline
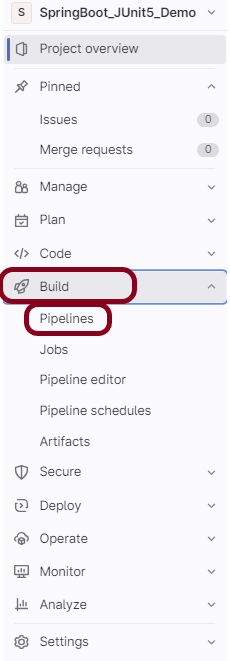
To schedule the pipeline, go to the left panel and click on the Build option. There are several sub-options in the Build option, click on the Pipeline Schedules.

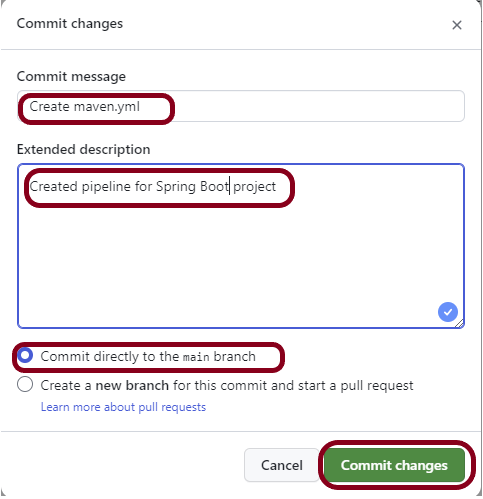
Click on the button “New Schedule” to create a schedule for the pipeline.

To add a pipeline schedule, we need to fill in the details displayed on this page.

- Description – Provide the description of the project
- Interval Pattern – Select one of the preconfigured intervals, or enter a custom interval in cron notation. Here, I have used 30 16 * * *, which means the job is scheduled to run every day at 4:30 PM.
- Cron TimeZone – Mention the timezone in which the job should run. Here, I have used [UTC+1]Dublin timezone.
- Target branch or tag – Select the branch or tag for the pipeline. Here, I have selected the “main” branch.

Click on the “Save pipeline schedule”.
Step 5 – Verify that the job is scheduled
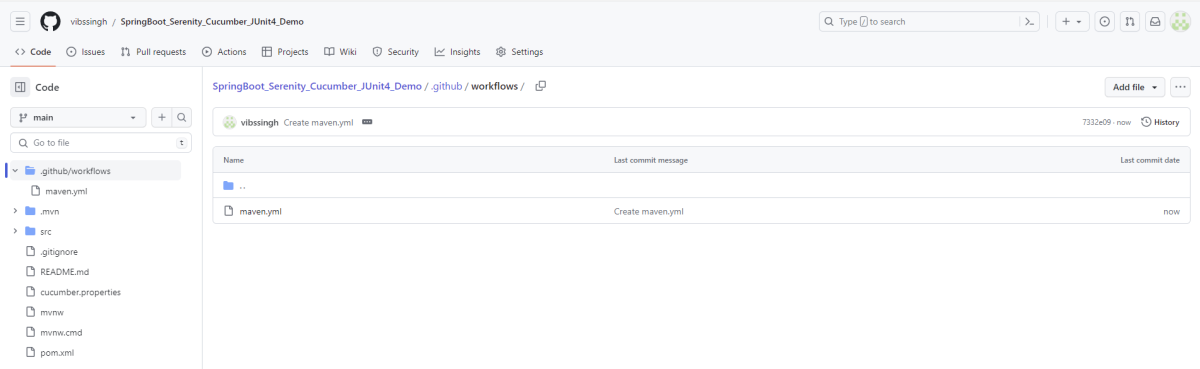
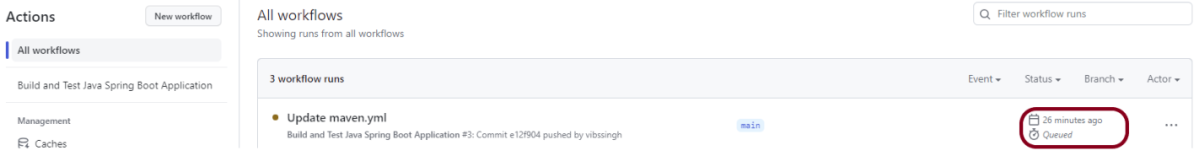
Below is the image of the newly created pipeline. This shows all the necessary details like description, target, last pipeline, next run, and owner.

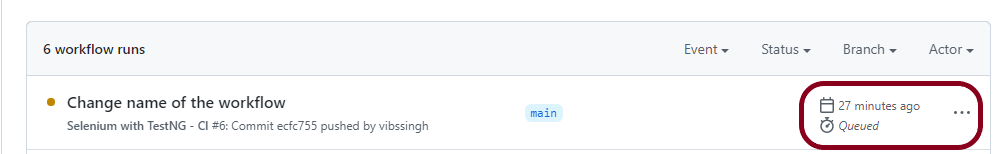
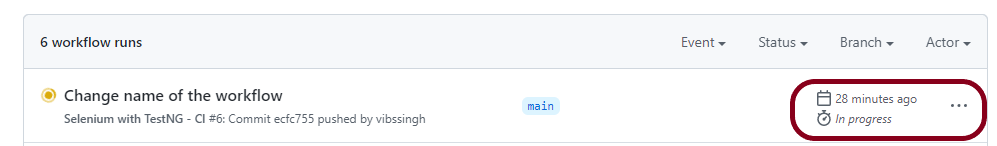
The “Next Run” shows the expected time to run the pipeline. Here, it shows that the run is going to start.

This image shows that the run has started, and it is in a pending state right now.

Step 6 – Run the tests in the GitLab pipeline
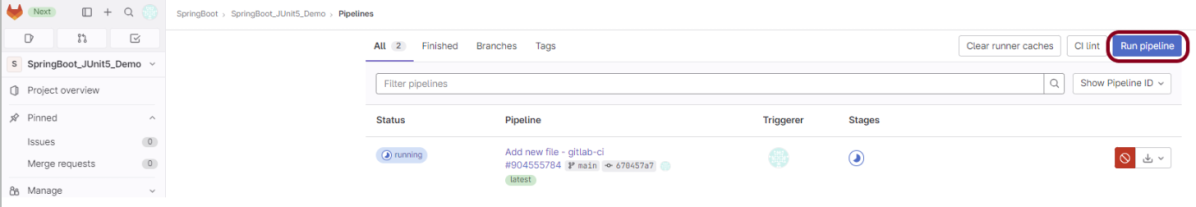
The pipeline runs automatically as per the time specified in the “Interval Pattern”. The below image shows that the tests are running in the GitLab pipeline.
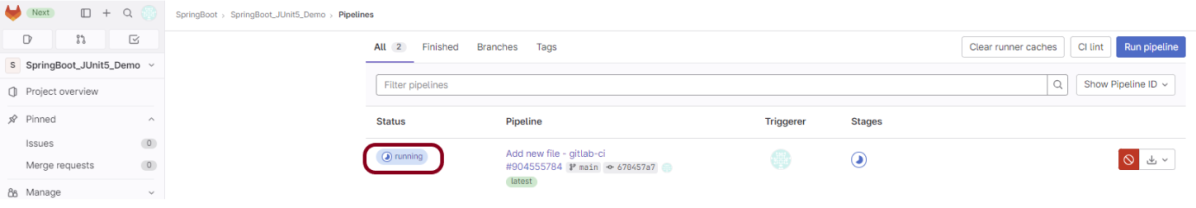
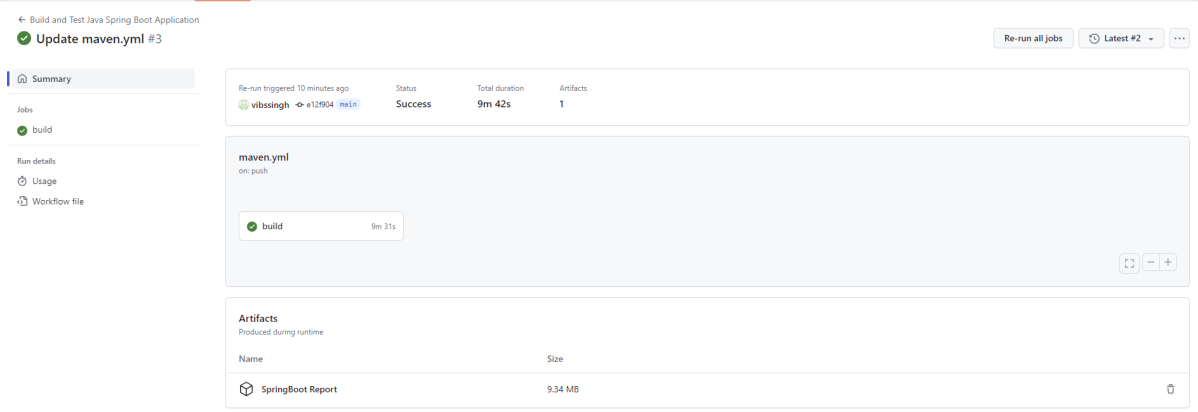
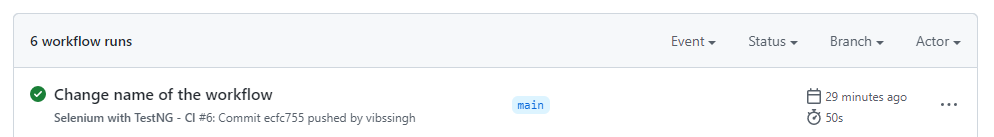
Step 7 – Check the status of the pipeline
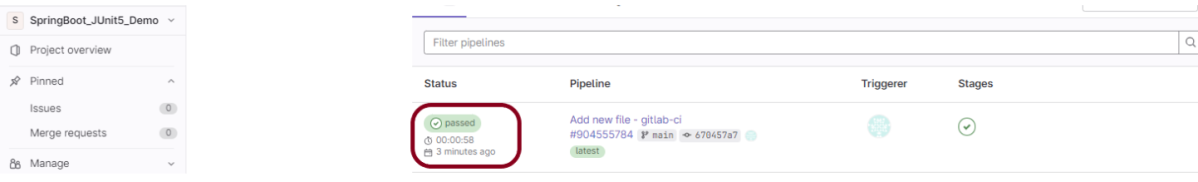
Once the Status of the pipeline changes to either failed or passed, that means the tests are already executed.

As you can see, the Status is passed, its green colour. This means all the tests present in the test suite are executed and passed. If any test fails in the test suite, the final execution status will be brown. The reason for the brown colour is we have mentioned allow_failure: true.
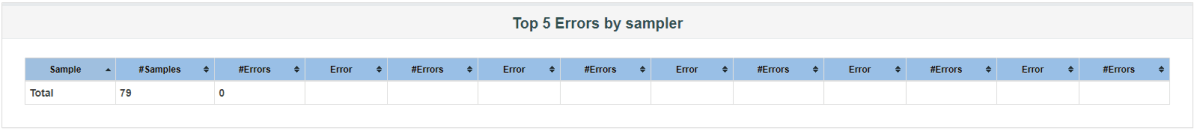
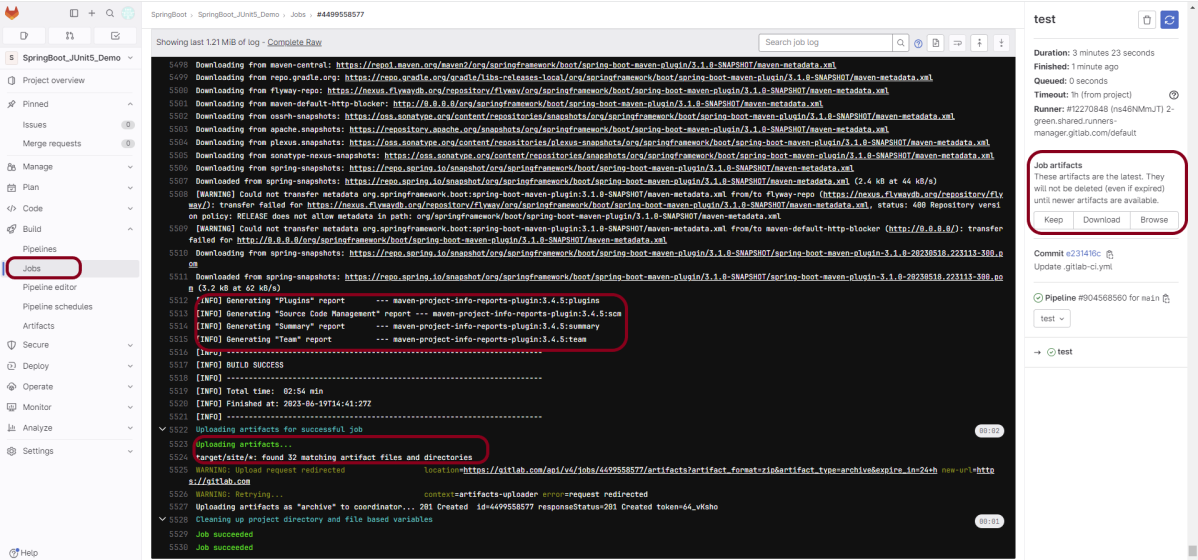
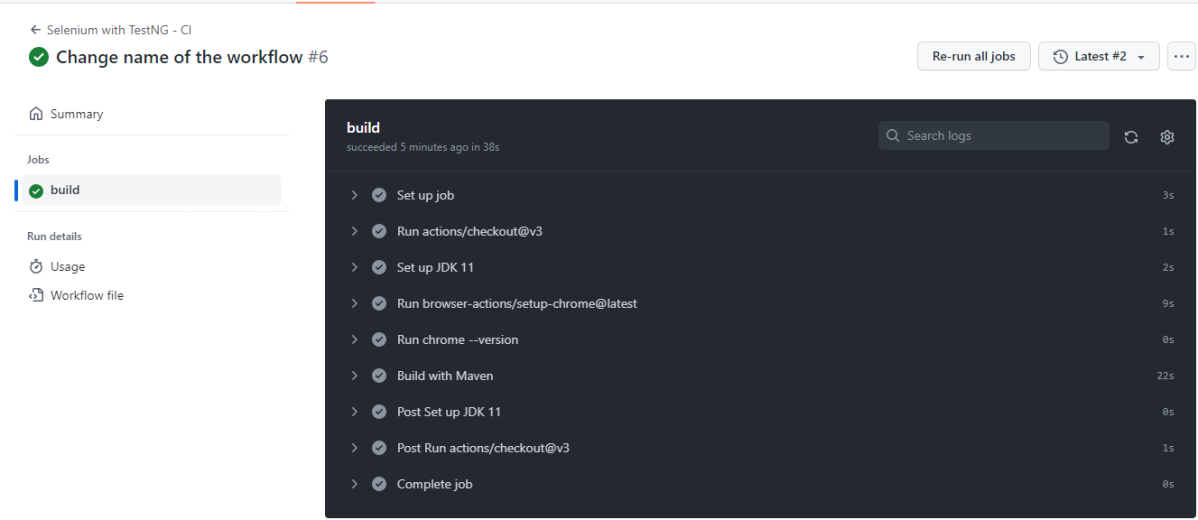
Below is the execution status report in the GitLab pipeline.

I have added an artifact also in the .gitalb-ci.yml, which is highlighted in the image. This artifact creates a folder with the name “SpringBoot_Report” and the reports in this folder come from the path /target/site. This artifact gives us the option to download the reports or browse the report. This report will be available for 24 hours only as mentioned in the gitlab-ci.yml.
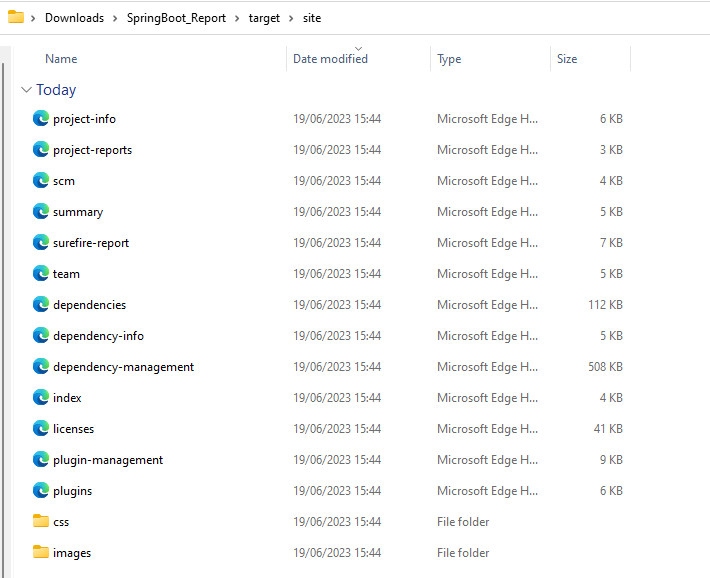
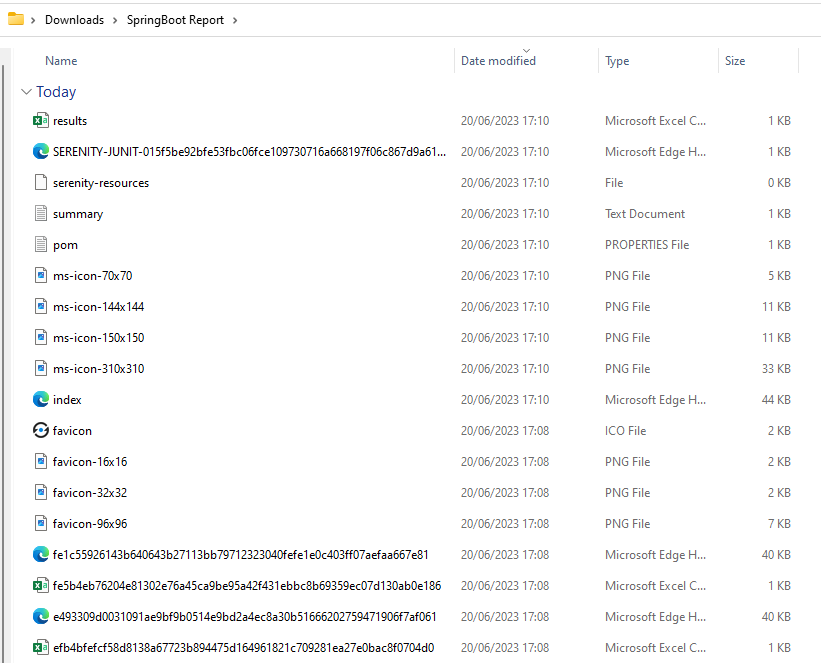
Step 8 – Download the report
Once, will click on the download button, it will download “SpringBoot_Report.zip”. Unzip the folder and it looks like something as shown below:
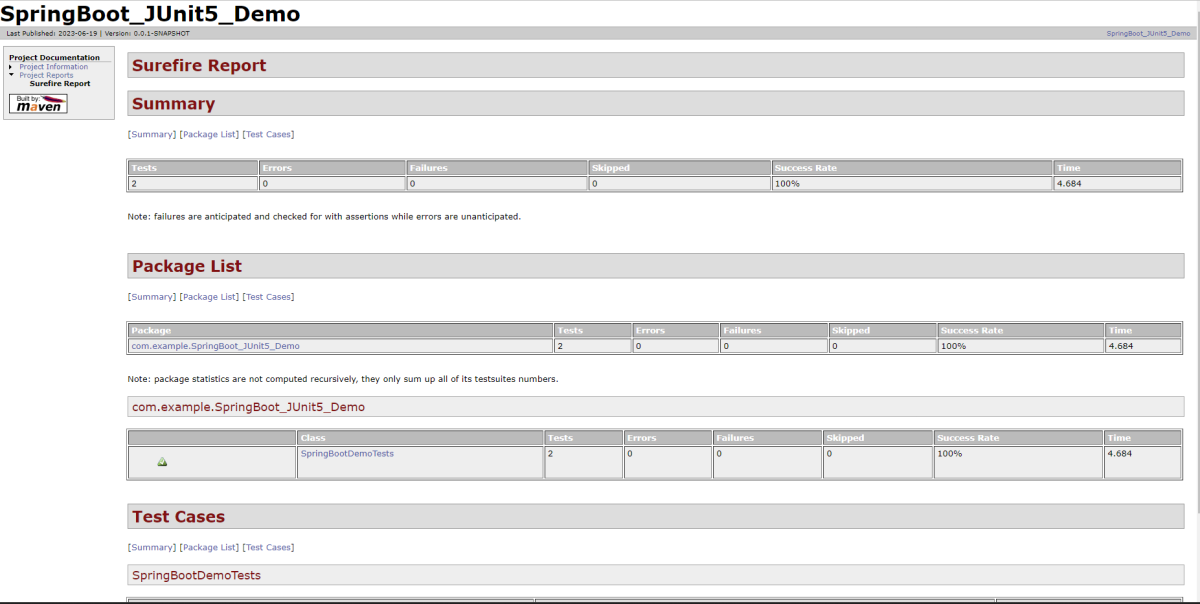
Example of SureFire-Report.html
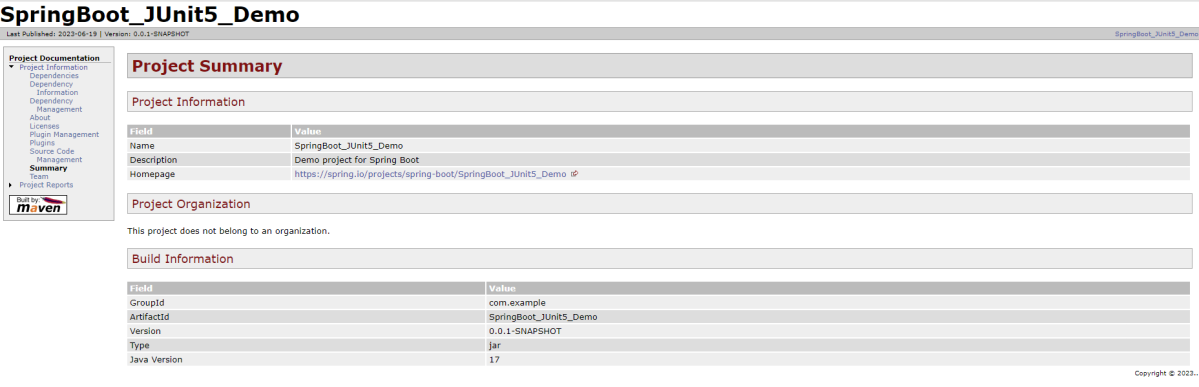
Example of Project Summary Report
How to schedule a cron job?
Five fields that are separated by whitespace make up a scheduling item. By adding more than one entry, you can schedule a job for more than one time.
| Minute | Hour | Day of Month | Month | Day of week |
MINUTE (0-59), HOUR (0-23), DAY (1-31), MONTH (1-12), DAY OF THE WEEK (0-6)
Each field can contain an exact value or use a set of special expressions:
- The asterisk * indicates all valid values. So, a job that runs every day has a * in the third field.
- A dash separates ranges of values. For example, a job that runs every hour from 9:00 a.m. to 5:00 p.m. would have 9-17 in the second field.
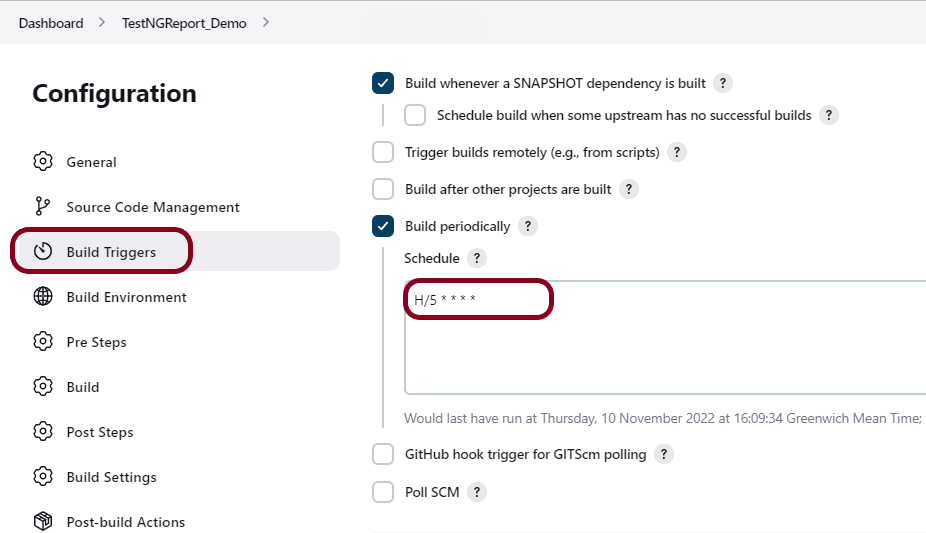
- Intervals are specified with a slash /. A job that runs every 15 minutes has H/15 in the first field. Note that the H in the first field has a special meaning. If you wanted a job to run every 15 minutes, you could configure it as 0/15, which would make it run at the start of every hour.
- Finally, you can specify multiple values with a comma. So, a job that runs Monday, Wednesday, and Friday would have 1,3,5 in the fifth field.
Here are several special predefined values that can be used to substitute the expressions in the cron.
| Entry | Description | Description |
| @yearly | Run at any time during the year | H H H H * |
| @annually | Run at any time during the year | H H H H * |
| @monthly | Run at any time during the month | H H H * * |
| @weekly | Run at any time during the week | H H * * H |
| @daily | Run at any time during the day | H H * * * |
| @hourly | Run at any time during the hour | H * * * * |
Here are the most common examples of cron job schedules that can be found in almost any crontab on Linux :
| Schedule | Job |
| * * * * * | Run cron job every minute |
| H/5 * * * * | Run cron job every 5 minutes |
| H/30 * * * * | Run cron job every 30 minutes |
| 0 * * * * | Run cron job every hour |
| 0 H/3 * * * | Run cron job every 3 hours |
| 0 13 * * * | Run cron job every day at 1pm |
| 30 2 * * * | Run cron job every day at 2:30 am |
| 0 0 * * * | Run cron job every day at midnight |
| 0 0 * * 0 | Run cron job every Sunday |
| 0 0 * * 1 | Run cron job every Monday |
| 0 0 1 * * | Run cron job every first day of every month |
| 0 0 1 1 * | Run cron job every first of January every year |
Congratulations. This tutorial has explained the steps to schedule the pipeline in GitLab CI/CD. Happy Learning!!


