The previous tutorial explained the steps to run the Selenium tests in the GitHub pipeline (Maven project). This tutorial explains the steps to run the Gradle project in the GitHub pipeline.
Important points to keep in mind:
1. We don’t need to think about the Chromedriver.exe we are using WebDriver Manager to handle that instead of adding it to our project like the following:
WebDriverManager.chromedriver().setup();
2. The Selenium tests need to run in the headless mode. As we are using Chrome browser, use the below code:
ChromeOptions options = new ChromeOptions();
options.addArguments("--no-sandbox");
options.addArguments("--disable-dev-shm-usage");
options.addArguments("--headless");
driver = new ChromeDriver(options);
3. Install Chrome browser in ubuntu. Use the below code:
- uses: browser-actions/setup-chrome@latest
- run: chrome --version
To know more about Chrome installation, please refer to this tutorial – browser-actions/setup-chrome.
Implementation Steps
Step 1 – Create GitHub Actions and Workflows
I have a repository available on GitHub – Gradle_Selenium_TestNG_Demo as shown in the below image. Go to the Actions tab. Click on the “Actions” tab.

Step 2 – Select the type of Actions
You will see that GitHub recommends Actions depending on the project. In our case, it is recommending actions suitable for a Java project. I have selected the “Publish Java Package with Gradle” option.

Step 3 – Generation of Sample pipeline
If you choose an existing option, it will automatically generate a .yaml for the project as shown below.

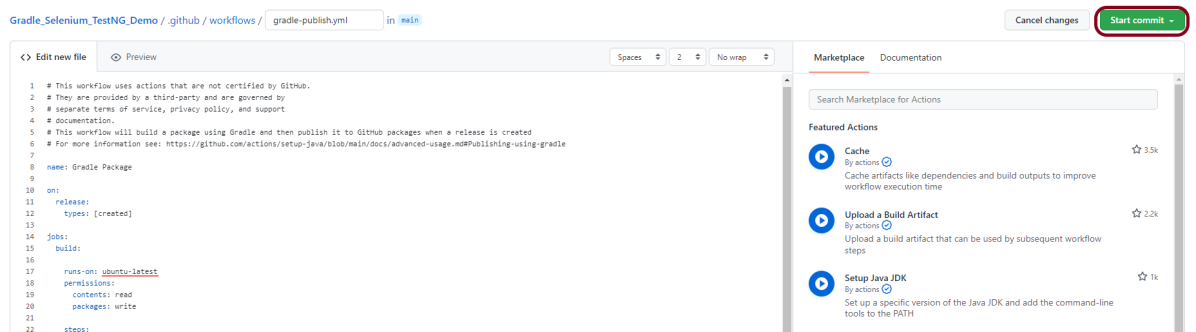
We will replace the current workflow with the following yml file as shown below:
name: Gradle Project - Selenium with TestNG

on:
  push:
    branches: [ "main" ]
  pull_request:
    branches: [ "main" ]

jobs:
  build:

    runs-on: ubuntu-latest
    permissions:
      contents: read
      packages: write

    steps:
    - uses: actions/checkout@v3
    - name: Set up JDK 11
      uses: actions/setup-java@v3
      with:
        java-version: '11'
        distribution: 'temurin'

    - uses: browser-actions/setup-chrome@latest
    - run: chrome --version

    - name: Build with Gradle
      run: gradle clean test

    - name: Archive Rest Results
      uses: actions/upload-artifact@v3
      if: success() || failure()
      with:
        name: test-results
        path: GradleReports/emailable-report.html
Step 4 – Commit the changes
After the changes, hit the “Start Commit” button.
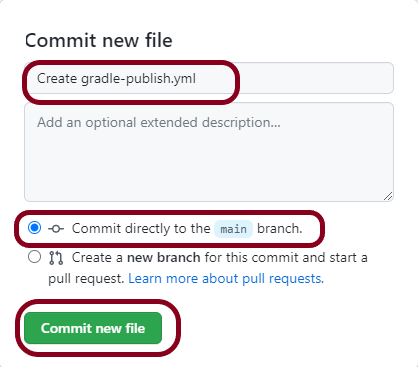
This will give the option to add a description for the commit. It will also enable the user to commit either to the main branch or commit to any other branch that exists in the project. Click on the “Commit new file” button to set up the workflow file.
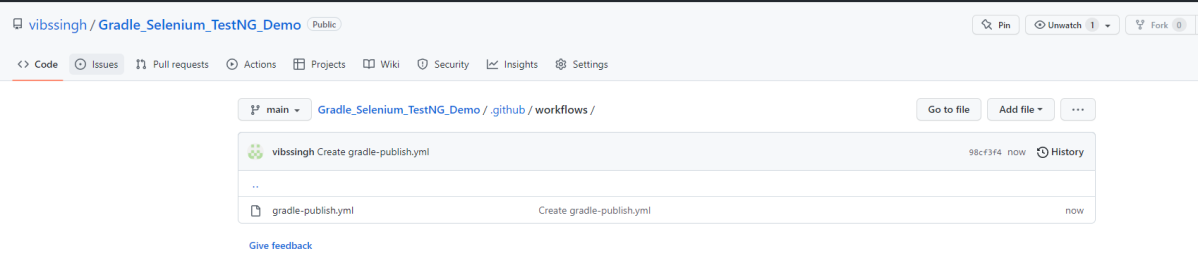
A folder with the name .github/workflows will be created that will contain a gradle-publish.yml file as shown below:
Step 5 – Verify that the workflow is running
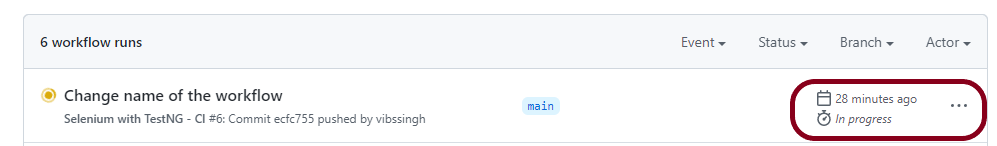
Next, head over to the “Actions” tab, and you will see your YAML workflow file present under the tab. The yellow sign represents that the job is in the queue.

In Progress – When the job starts building and running, you will see the status change from “Queued” to “in progress”.
Passed –If the build is successful, you will see a green tick mark.
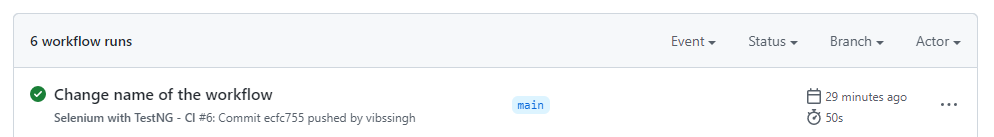
Click on the workflow and the below screen is displayed. It shows the status of the run of the workflow, the total time taken to run the workflow, and the name of the .yml file.

Failed – In case the build has failed which in this case any of the tests is failed, then there will be a red cross mark.

Below shows all the steps of the workflow.
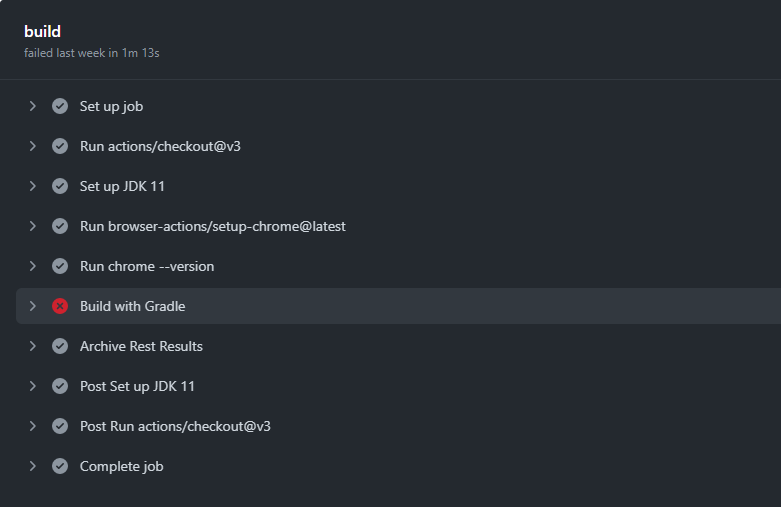
Build with Gradle steps failed because out of 2 tests, one of the tests failed. So, it appears in red colour. I personally love this feature because it gives an idea about the test execution status immediately if all the tests are passed or anything is failed.
Published artifacts on GitHub
Once the pipeline run, a test-results folder will be generated as shown in the below image:
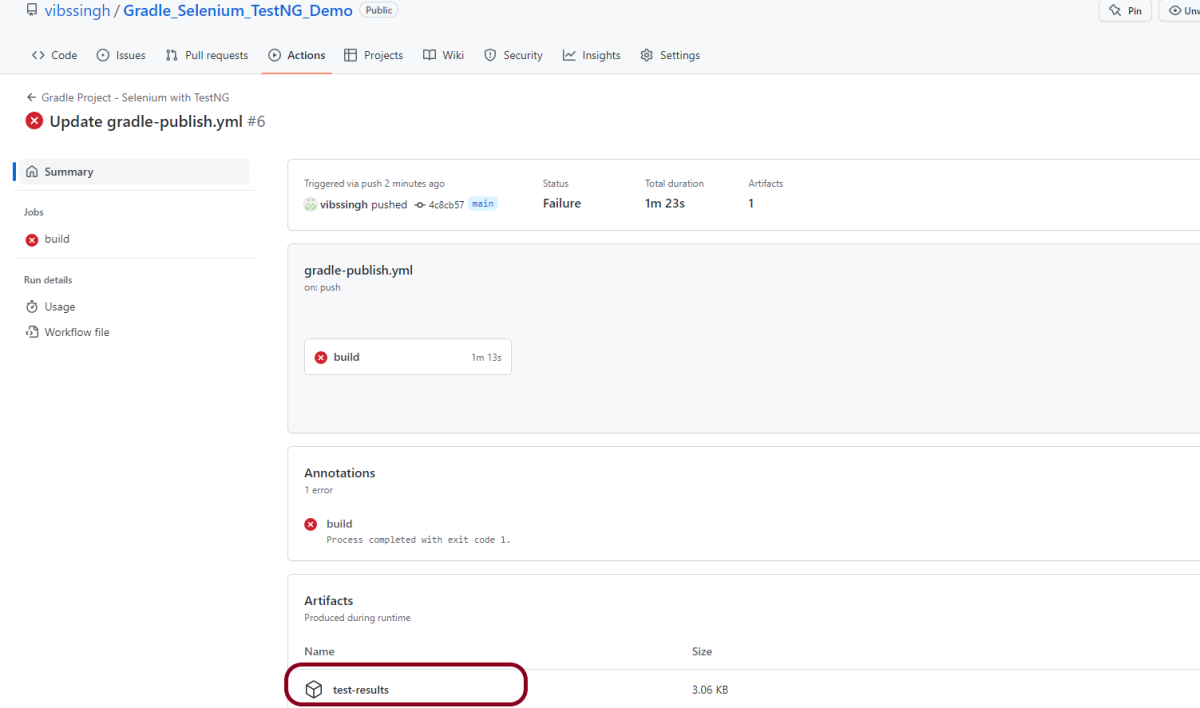
When we click on the folder test-results, a zipped file will be downloaded, and we can extract it to see all the files contained within it.

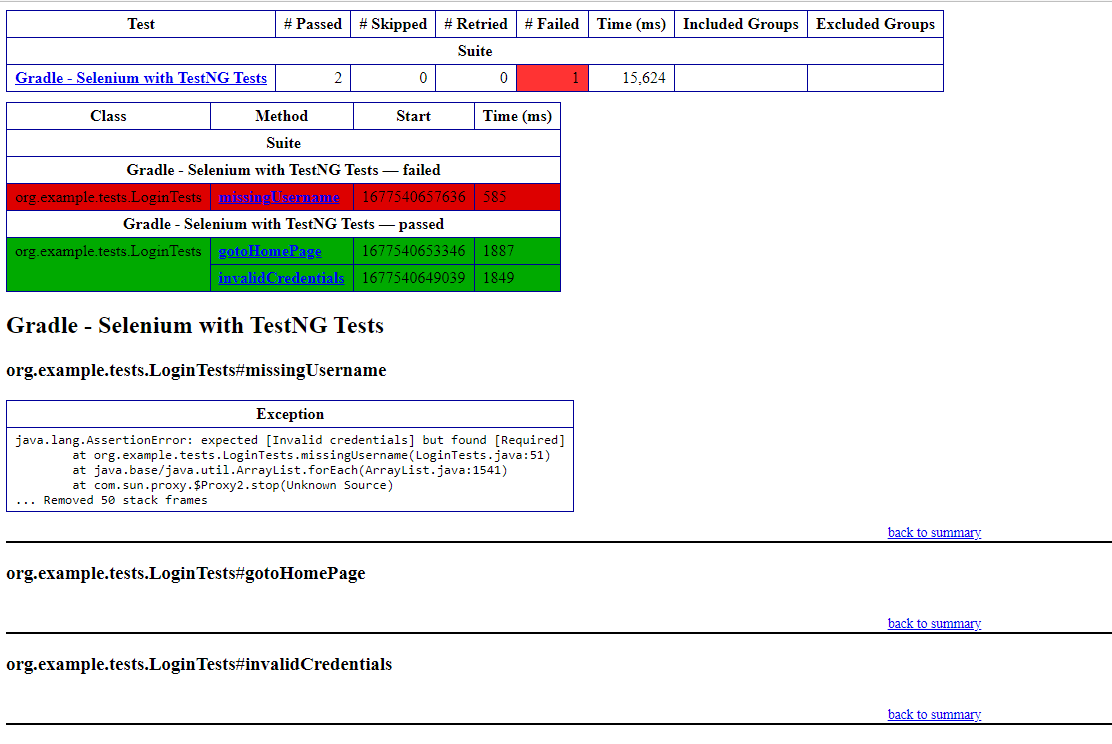
The image of the report is shown below:
The complete code can be found here in GitHub.
