Last Updated On
In this tutorial, we are going to learn how we can install the Maven plugin and create a Maven project in Jenkins.
Table of Contents
- Prerequisite
- Implementation Steps
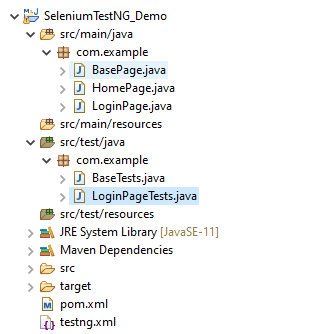
- Create a project for running the tests using Selenium WebDriver and TestNG
- Create the Test Code
- Start the Jenkins server
- Log in to Jenkins UI
- Download and Install Maven Plugin
- Add the Maven Integration plugin
- Restart Jenkins
- Create a new project using the Maven project plugin
- Build Management
- Execute the tests
Prerequisite
- Jenkins was installed and started on the computer.
- Java is installed
- Maven is installed
- Java and Maven are configured in Jenkins
To learn How to configure Java and Maven in Jenkins, please refer to this tutorial.
Implementation Steps
Step 1: Create a project for running the tests using Selenium WebDriver and TestNG
Step 2: Create the Test Code
You can refer to this tutorial to get the test code – Integration Of Jenkins With Selenium WebDriver.
Step 3: Start the Jenkins server
Open the browser and navigate to the localhost and the port in which Jenkins is running.
Step 4: Log in to Jenkins UI
Provide username and password and click on Sign in.

Step 5: Download and Install Maven Plugin
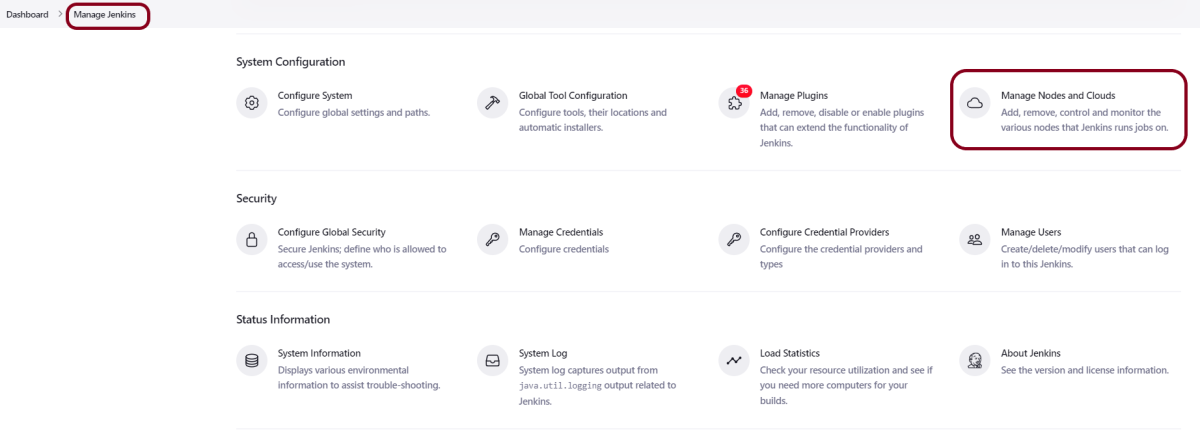
Click on the Manage Jenkins.

Choose Manage Plugins.

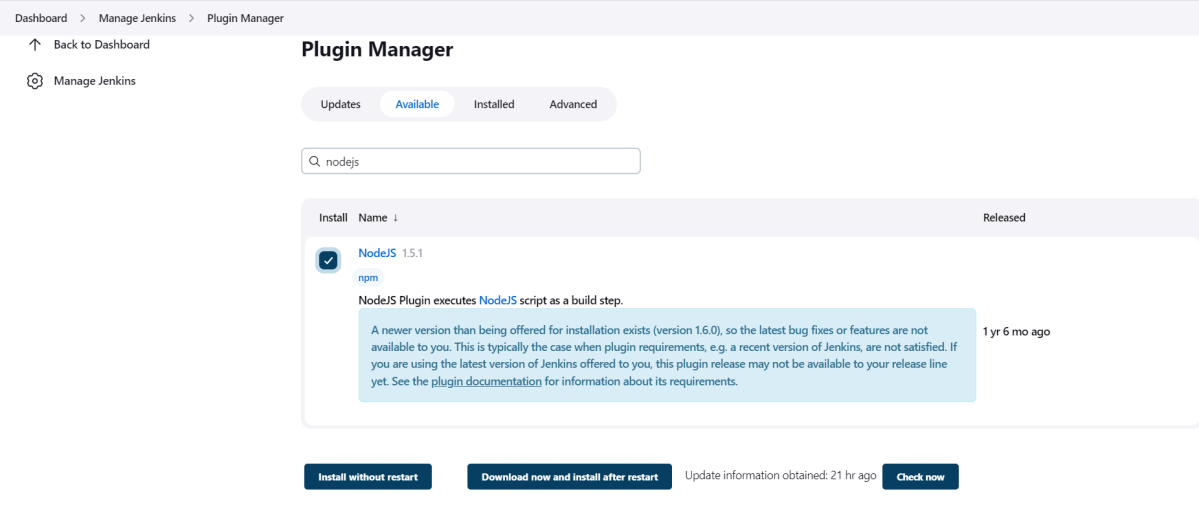
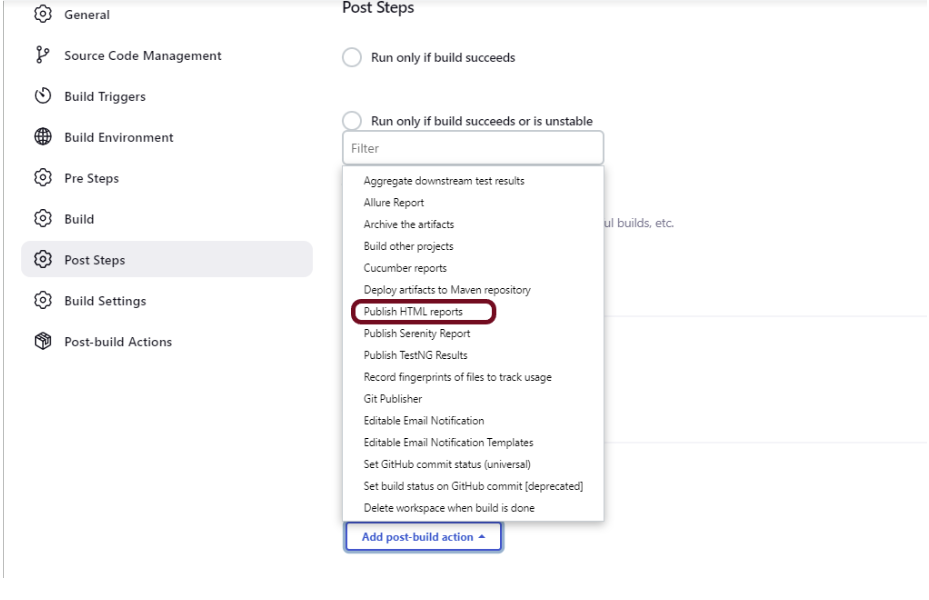
Step 6: Add the Maven Integration plugin
On the Plugins Page, go to the Available option
- Select the Maven Integration Plugin
- Click on Install without restart. The plugin will take a few moments to finish downloading depending on your internet connection, and will be installed automatically.
- You can also select the option Download now and Install after the restart button. In which plugin is installed after the restart
- You will be shown a “No updates available” message if you already have the Maven plugin installed.

The plugin “Maven Integration” has been installed successfully.
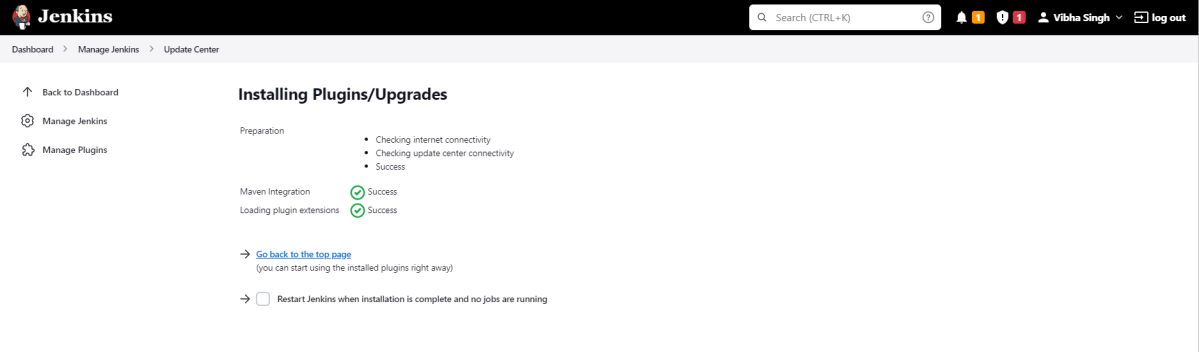
Step 7: Restart Jenkins
Click on the checkbox “Restart Jenkins when installation is complete when no jobs are running“.

The Jenkins is being restarted, It is about to restart.
Again, log in to Jenkins UI.
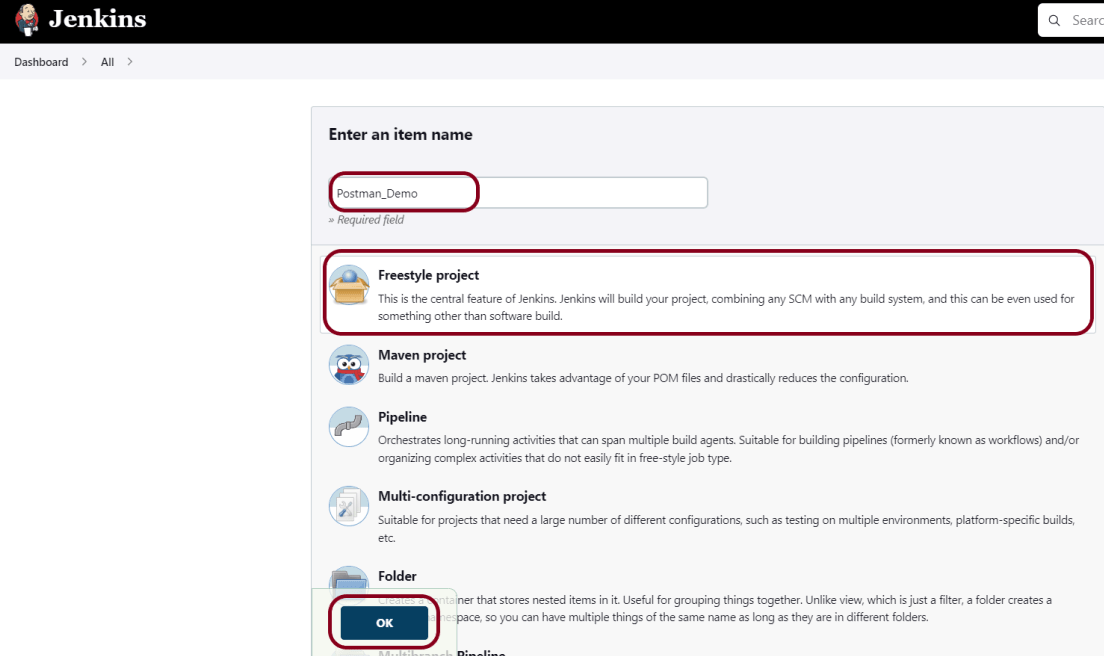
Step 8: Create a new project using the Maven project plugin
- Give the Name of the project – SeleniumTestNG_MavenDemo.
- Click on the Maven project.
- Click on the OK button.

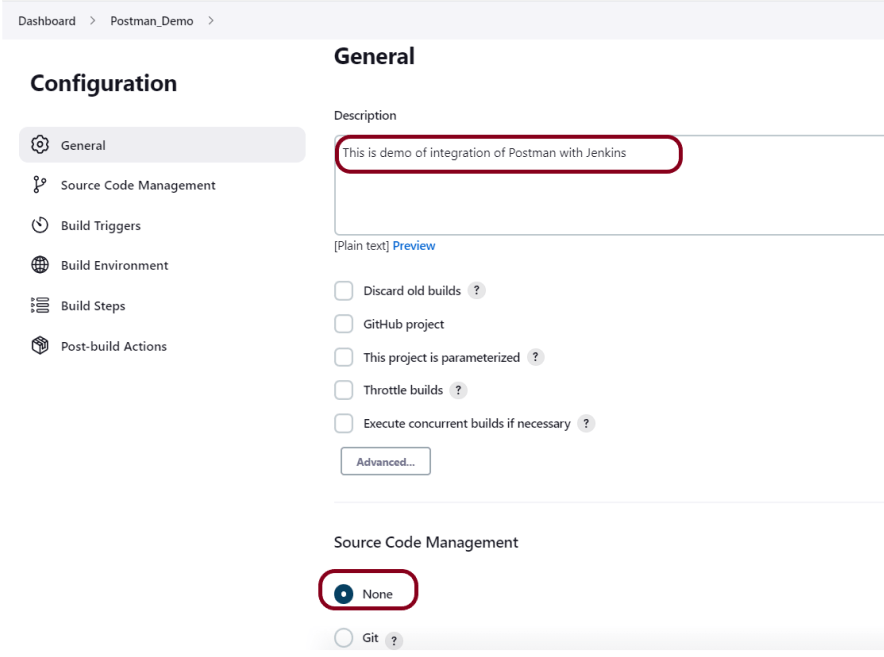
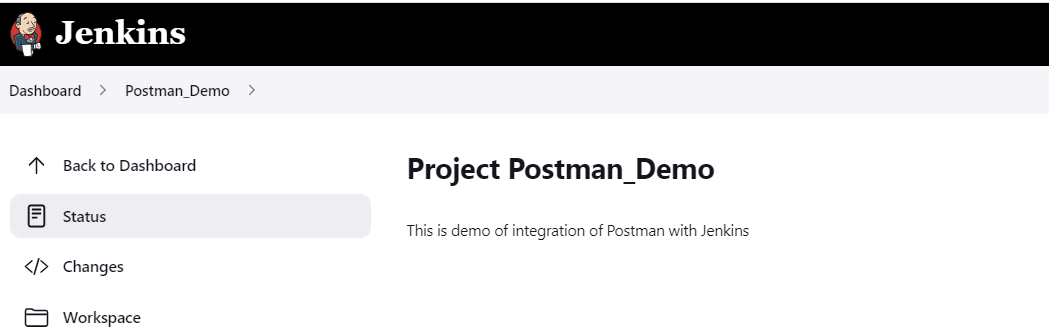
In the General section, enter the project description in the Description box.

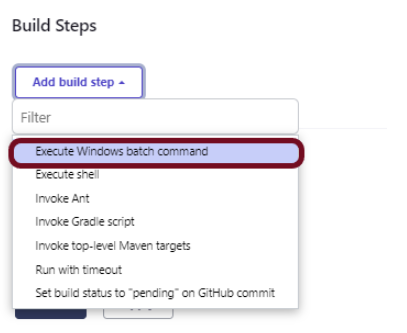
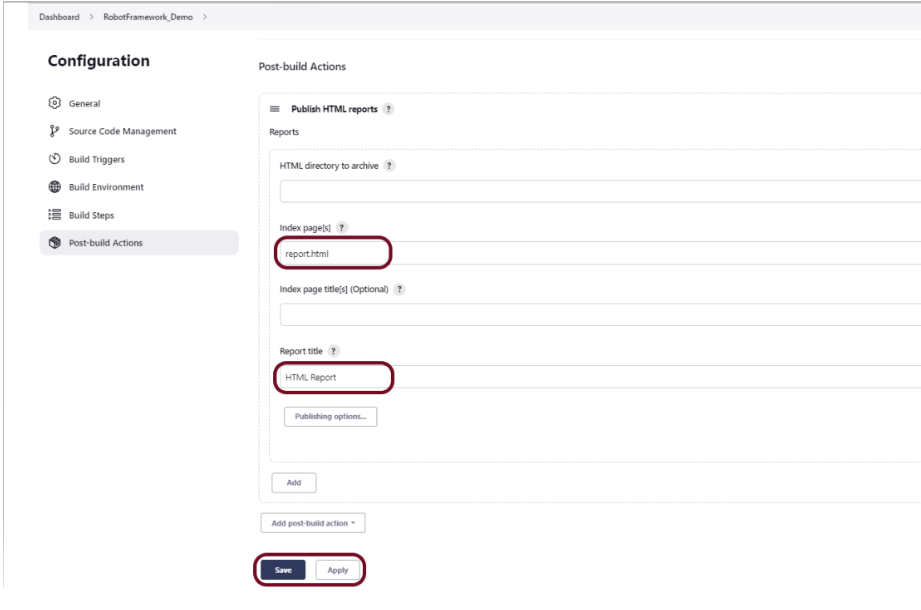
Step 9: Build Management
Go to the Build section of the new job.
- In the Root POM textbox, enter the full path to pom.xml
- In the Goals and options section, enter “clean test”
Click on the Apply and Save buttons.

We have created a new Maven project “SeleniumTestNG_MavenDemo” with the configuration to run the Selenium with TestNG Tests

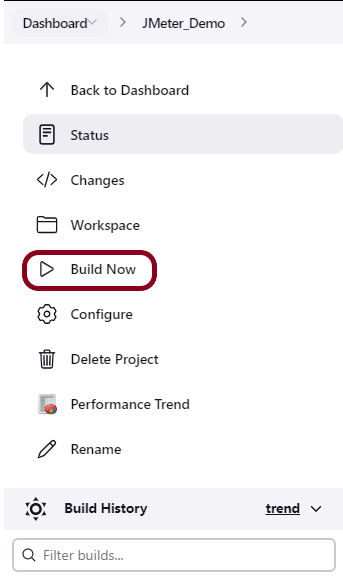
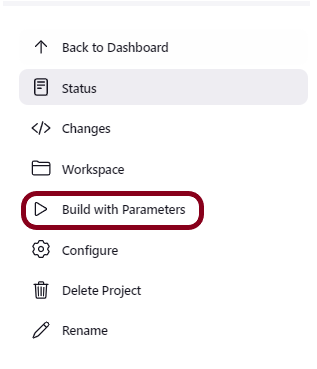
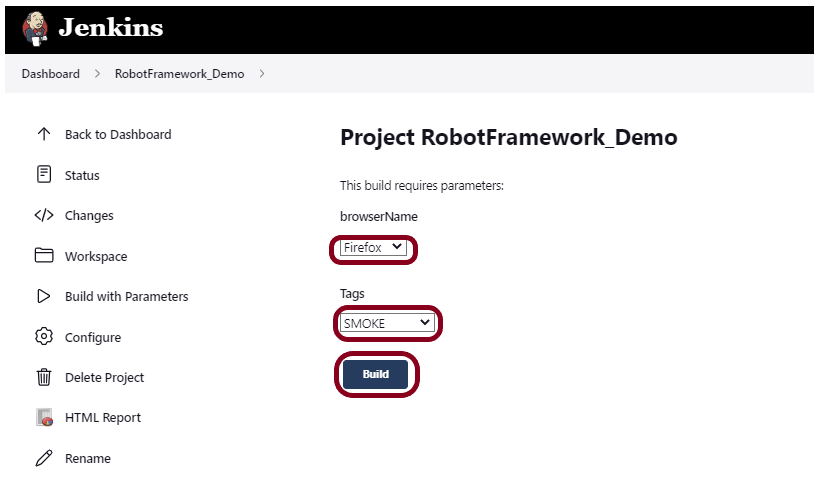
Step 10: Execute the tests
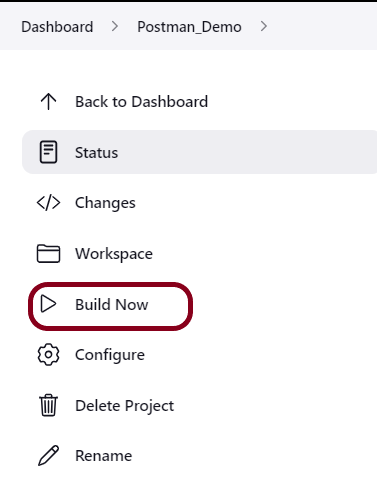
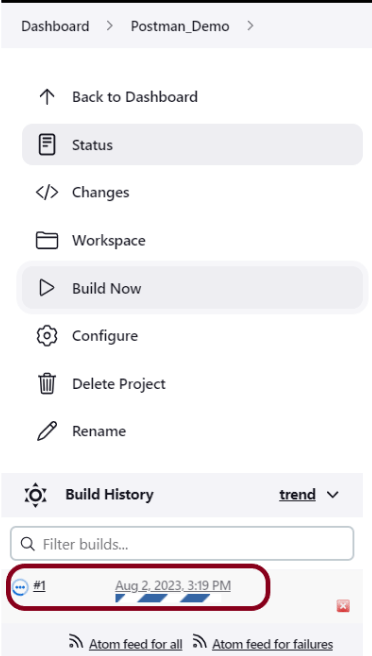
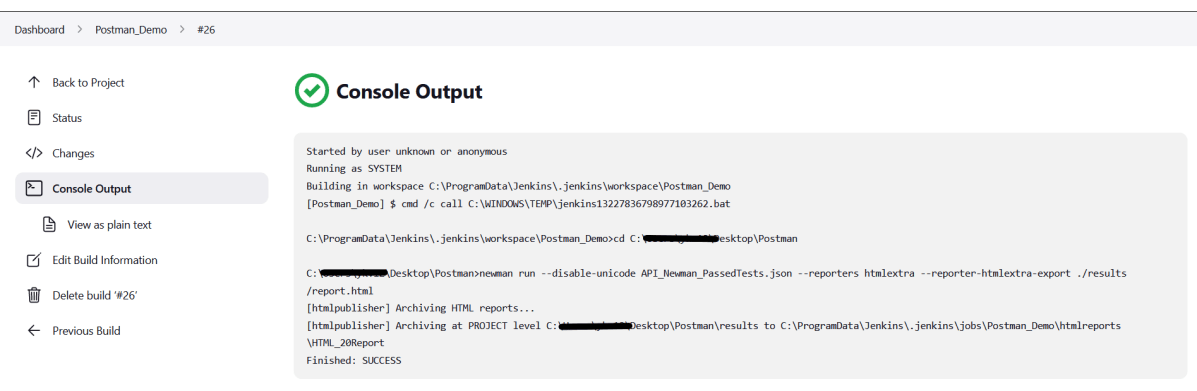
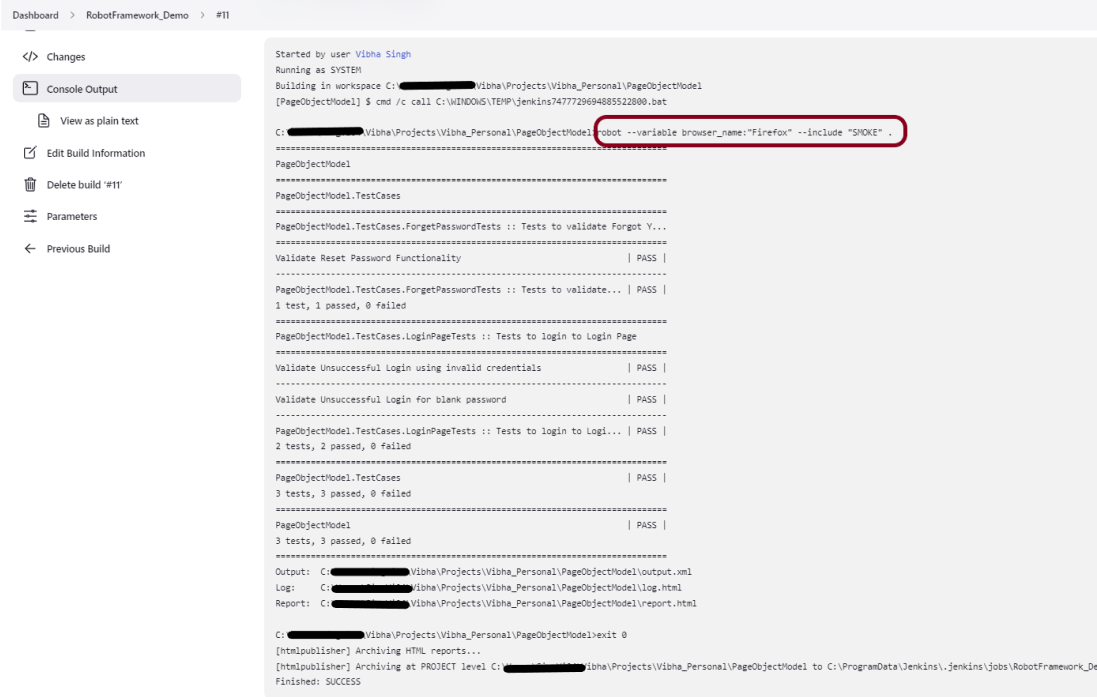
Click on the Build Now link. Maven will build the project. It will then have TestNG execute the test cases.

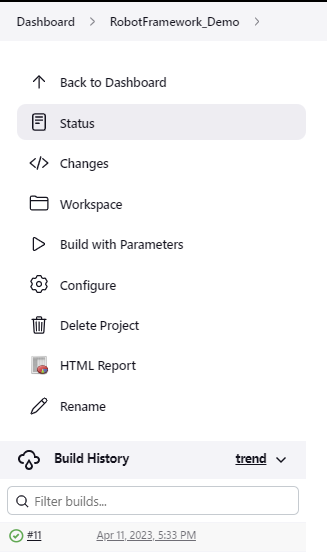
To see the current status of the execution, click on the “console output“.

Congratulations on making it through this tutorial and hope you found it useful! Happy Learning!! Cheers!!
Additional Tutorials