The previous tutorial explained the steps to generate ExtentReports Version for Cucumber6 with TestNG. This tutorial explains the steps needed to be followed to generate an ExtentReports Version5 for Cucumber 7.
Table of Contents
- New Features in ExtentReports Version 5
- Prerequisite
- Project Structure
- Implementation Steps
- Add Maven dependencies to the POM
- Create a feature file in src/test/resources
- Create extent.properties file in src/test/resources
- Create a Helper class in src/main/java
- Create Locator classes in src/main/java
- Create Action classes in src/main/java
- Create a Step Definition file in src/test/java
- Create Hook class in src/test/java
- Create a Cucumber Test Runner class in src/test/java
- Create the testng.xml for the project
- Execute the code
- View ExtentReport
- PDF Report
- Spark Report
New Features in ExtentReports Version 5
Report Attachments
To add attachments, like screen images, two settings need to be added to the extent.properties. Firstly property, named screenshot.dir, is the directory where the attachments are stored. Secondly is screenshot.rel.path, which is the relative path from the report file to the screenshot directory.
extent.reporter.spark.out=Reports/Spark.html

screenshot.dir=/Screenshots/
screenshot.rel.path=../Screenshots/
Extent PDF Reporter
The PDF reporter summarizes the test run results in a dashboard and other sections with feature, scenario, and, step details. The PDF report needs to be enabled in the extent.properties file.
#PDF Report
extent.reporter.pdf.start=true
extent.reporter.pdf.out=PdfReport/ExtentPdf.pdf
Ported HTML Reporter
The original HTML Extent Reporter was deprecated in 4.1.3 and removed in 5.0.0. The HTML report available in the adapter is based on the same code base and is similar in appearance. The major changes are in the Freemarker template code which has been modified to work with the Extent Reports version 5. The HTML report needs to be enabled in the extent.properties file.
#HTML Report
extent.reporter.html.start=true
extent.reporter.html.out=HtmlReport/ExtentHtml.html
Customized Report Folder Name
To enable the report folder name with date and\or time details, two settings need to be added to the extent.properties. These are basefolder.name and basefolder.datetimepattern. These will be merged to create the base folder name, inside which the reports will be generated.
#FolderName
basefolder.name=ExtentReports/SparkReport_
basefolder.datetimepattern=d_MMM_YY HH_mm_ss
Attach Image as Base64 String
This feature can be used to attach images to the Spark report by setting the src attribute of the img tag to a Base64 encoded string of the image. When this feature is used, no physical file is created. There is no need to modify any step definition code to use this. To enable this, use the below settings in extent.properties, which is false by default.
extent.reporter.spark.base64imagesrc=true
Environment or System Info Properties
It is now possible to add environment or system info properties in the extent.properties or pass them in the maven command line.
#System Info
systeminfo.os=windows
systeminfo.version=10
Prerequisite:
- Java 8 or higher is needed for ExtentReport5
- Maven or Gradle
- JAVA IDE (like Eclipse, IntelliJ, or soon)
- TestNG installed
- Cucumber Eclipse plugin (in case using Eclipse)
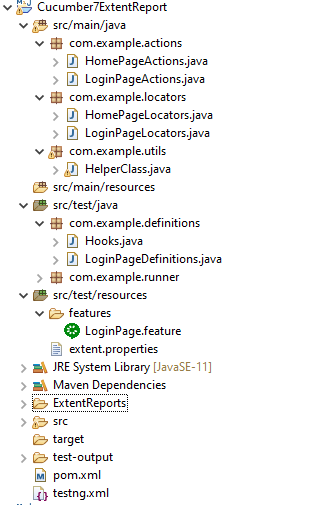
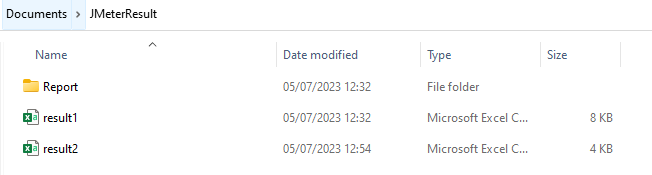
Project Structure
Implementation Steps
Step 1: Add Maven dependencies to the POM
Add ExtentReport dependency
<dependency>
    <groupId>com.aventstack</groupId>
    <artifactId>extentreports</artifactId>
    <version>5.1.1</version>
</dependency>
Add tech grasshopper maven dependency for Cucumber
<dependency>
    <groupId>tech.grasshopper</groupId>
    <artifactId>extentreports-cucumber7-adapter</artifactId>
    <version>1.14.0</version>
</dependency>
The complete POM.xml will look like as shown below with other Selenium and TestNG dependencies.
<project xmlns="http://maven.apache.org/POM/4.0.0" xmlns:xsi="http://www.w3.org/2001/XMLSchema-instance" xsi:schemaLocation="http://maven.apache.org/POM/4.0.0 https://maven.apache.org/xsd/maven-4.0.0.xsd">
  <modelVersion>4.0.0</modelVersion>
  <groupId>com.example</groupId>
  <artifactId>ExtentReports5Cucumber7TestNG</artifactId>
  <version>0.0.1-SNAPSHOT</version>


<properties>
        <project.build.sourceEncoding>UTF-8</project.build.sourceEncoding>
        <cucumber.version>7.14.0</cucumber.version>
        <extentreports.cucumber7.adapter.version>1.14.0</extentreports.cucumber7.adapter.version>
        <extentreports.version>5.1.1</extentreports.version>
        <selenium.version>4.15.0</selenium.version>
        <testng.version>7.8.0</testng.version>
        <maven.compiler.plugin.version>3.11.0</maven.compiler.plugin.version>
        <maven.surefire.plugin.version>3.2.1</maven.surefire.plugin.version>
        <maven.compiler.source.version>17</maven.compiler.source.version>
        <maven.compiler.target.version>17</maven.compiler.target.version>
    </properties>

    <dependencies>

        <dependency>
            <groupId>io.cucumber</groupId>
            <artifactId>cucumber-java</artifactId>
            <version>${cucumber.version}</version>
        </dependency>

        <dependency>
           <groupId>io.cucumber</groupId>
           <artifactId>cucumber-testng</artifactId>
           <version>${cucumber.version}</version>
           <scope>test</scope>
       </dependency>

        <!-- Cucumber ExtentReport Adapter -->
        <dependency>
            <groupId>tech.grasshopper</groupId>
            <artifactId>extentreports-cucumber7-adapter</artifactId>
            <version>${extentreports.cucumber7.adapter.version}</version>
        </dependency>

        <!-- Extent Report -->
        <dependency>
            <groupId>com.aventstack</groupId>
            <artifactId>extentreports</artifactId>
            <version>${extentreports.version}</version>
        </dependency>

        <!-- Selenium -->
        <dependency>
            <groupId>org.seleniumhq.selenium</groupId>
            <artifactId>selenium-java</artifactId>
            <version>${selenium.version}</version>
        </dependency>


        <!-- TestNG -->
        <dependency>
            <groupId>org.testng</groupId>
            <artifactId>testng</artifactId>
            <version>${testng.version}</version>
            <scope>test</scope>
        </dependency>

    </dependencies>

    <build>
        <plugins>
            <plugin>
                <groupId>org.apache.maven.plugins</groupId>
                <artifactId>maven-compiler-plugin</artifactId>
                <version>${maven.compiler.plugin.version}</version>
                <configuration>
                    <source>${maven.compiler.source.version}</source>
                    <target>${maven.compiler.target.version}</target>
                </configuration>
            </plugin>
            <plugin>
                <groupId>org.apache.maven.plugins</groupId>
                <artifactId>maven-surefire-plugin</artifactId>
                <version>${maven.surefire.plugin.version}</version>
                <configuration>
                    <suiteXmlFiles>
                        <suiteXmlFile>testng.xml</suiteXmlFile>
                    </suiteXmlFiles>
                </configuration>
            </plugin>
        </plugins>
    </build>
    </project>
Step 2: Create a feature file in src/test/resources
Below is a sample feature file. I have also added a failed scenario in @FaceBookLink.
Background:
    Given User is on HRMLogin page "https://opensource-demo.orangehrmlive.com/"

   @ValidCredentials
   Scenario: Login with valid credentials

    When User enters username as "Admin" and password as "admin123"
    Then User should be able to login successfully and new page open

   @InvalidCredentials
   Scenario Outline: Login with invalid credentials

    When User enters username as "<username>" and password as "<password>"
    Then User should be able to see error message "<errorMessage>"

 Examples:
   | username   | password  | errorMessage                      |
   | Admin      | admin12$$ | Invalid credentials               |
   | admin$$    | admin123  | Invalid credentials               |
   | abc123     | xyz$$     | Invalid credentials               |


   @MissingUsername
   Scenario Outline: Login with blank username

    When User enters username as " " and password as "admin123"
    Then User should be able to see a message "Required" below Username

   @FaceBookLink @FailedTest
   Scenario: Verify FaceBook Icon on Login Page

    Then User should be able to see FaceBook Icon

   @LinkedInLink
   Scenario: Verify LinkedIn Icon on Login Page

    Then User should be able to see LinkedIn Icon

   @ForgetPasswordLink
   Scenario: Verify ForgetPassword link on Login Page

    When User clicks on Forgot your Password Link
    Then User should navigate to a new page
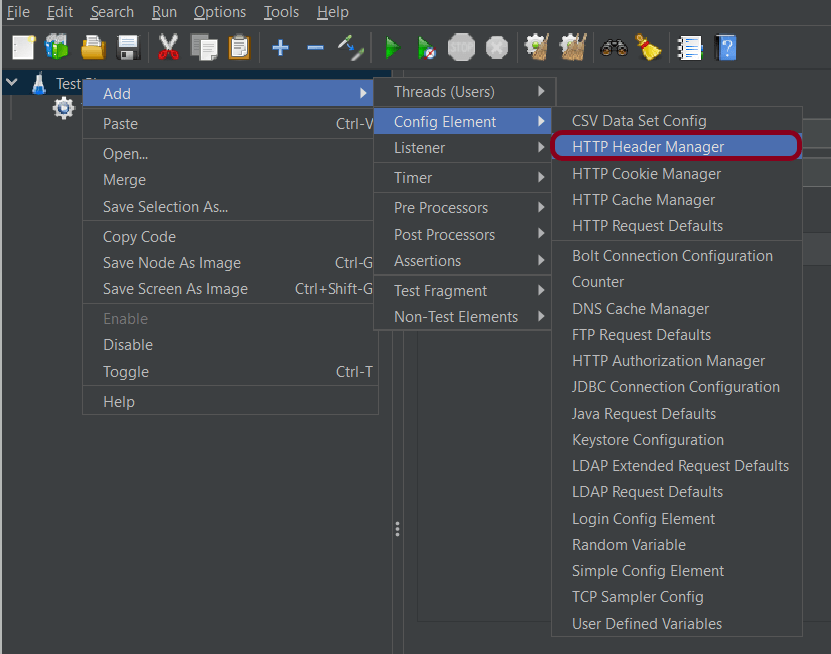
Step 3: Create extent.properties file in src/test/resources
We need to create the extent.properties file in the src/test/resources folder for the grasshopper extent report adapter to recognize it. Using a property file for reporting is quite helpful if you want to define several different properties.
extent.reporter.spark.start=true
extent.reporter.spark.out=Reports/Spark.html

#PDF Report
extent.reporter.pdf.start=true
extent.reporter.pdf.out=PdfReport/ExtentPdf.pdf

#HTML Report
extent.reporter.html.start=true
extent.reporter.html.out=HtmlReport/ExtentHtml.html

#FolderName
basefolder.name=ExtentReports/SparkReport_
basefolder.datetimepattern=d_MMM_YY HH_mm_ss

#Screenshot
screenshot.dir=/Screenshots/
screenshot.rel.path=../Screenshots/

#Base64
extent.reporter.spark.base64imagesrc=true

#System Info
systeminfo.os=windows
systeminfo.version=10
Step 4: Create a Helper class in src/main/java
We have used the Page Object Model with Cucumber and TestNG. Create a Helper class where we are initializing the web driver, initializing the web driver wait, defining the timeouts, and creating a private constructor of the class, it will declare the web driver, so whenever we create an object of this class, a new web browser is invoked.
import java.time.Duration;
import org.openqa.selenium.WebDriver;
import org.openqa.selenium.chrome.ChromeDriver;
import org.openqa.selenium.support.ui.WebDriverWait;
import io.github.bonigarcia.wdm.WebDriverManager;

public class HelperClass {

    private static HelperClass helperClass;

    private static WebDriver driver;
    private static WebDriverWait wait;
    public final static int TIMEOUT = 10;

     private HelperClass() {

	    	 ChromeOptions options = new ChromeOptions();
	         options.addArguments("--start-maximized");
	         driver = new ChromeDriver(options);
	         driver.manage().timeouts().implicitlyWait(Duration.ofSeconds(TIMEOUT));
	     }

    public static void openPage(String url) {
        driver.get(url);
    }


    public static WebDriver getDriver() {
        return driver;
    }

    public static void setUpDriver() {

        if (helperClass==null) {

            helperClass = new HelperClass();
        }
    }

     public static void tearDown() {

         if(driver!=null) {
             driver.close();
             driver.quit();
         }

         helperClass = null;
     }

}
Step 5: Create Locator classes in src/main/java
Create a locator class for each page that contains the details of the locators of all the web elements. Here, I’m creating 2 locator classes – LoginPageLocators and HomePageLocators.
LoginPageLocators
package com.example.locators;

import org.openqa.selenium.WebElement;
import org.openqa.selenium.support.FindBy;

public class LoginPageLocators {

	@FindBy(name = "username")
    public WebElement userName;

    @FindBy(name = "password")
    public WebElement password;

    @FindBy(id = "logInPanelHeading")
    public WebElement titleText;

    @FindBy(xpath = "//*[@id='app']/div[1]/div/div[1]/div/div[2]/div[2]/form/div[1]/div/span")
    public WebElement missingUsernameErrorMessage;

    @FindBy(xpath = "//*[@id='app']/div[1]/div/div[1]/div/div[2]/div[2]/form/div[1]/div/span")
    public WebElement missingPasswordErrorMessage;

    @FindBy(xpath = "//*[@id='app']/div[1]/div/div[1]/div/div[2]/div[2]/form/div[3]/button")
    public WebElement login;

    @FindBy(xpath = "//*[@id='app']/div[1]/div/div[1]/div/div[2]/div[2]/div/div[1]/div[1]/p")
    public  WebElement errorMessage;

    @FindBy(xpath = "//*[@href='https://www.linkedin.com/company/orangehrm/mycompany/']")
    public  WebElement linkedInIcon;

    @FindBy(xpath = "//*[@href='https://www.facebook.com/OrangeHRM/mycompany']") //Invalid Xpath
    public  WebElement faceBookIcon;

    @FindBy(xpath = "//*[@id='app']/div[1]/div/div[1]/div/div[2]/div[2]/form/div[4]/p")
    public  WebElement ForgotYourPasswordLink;

}
HomePageLocators
import org.openqa.selenium.WebElement;
import org.openqa.selenium.support.FindBy;

public class HomePageLocators {

	 @FindBy(xpath = "//*[@class='oxd-topbar-header-breadcrumb']/h6")
	public  WebElement homePageUserName;

}
ForgotPasswordLocators
package com.example.locators;

import org.openqa.selenium.WebElement;
import org.openqa.selenium.support.FindBy;

public class ForgotPasswordLocators {

	@FindBy(xpath = "//*[@id='app']/div[1]/div[1]/div/form/h6")
    public WebElement ForgotPasswordHeading;

}
Step 6: Create Action classes in src/main/java
Create the action classes for each web page. These action classes contain all the methods needed by the step definitions. In this case, I have created 2 action classes – LoginPageActions and HomePageActions.
LoginPageActions
In this class, the very first thing will do is to create the object of LoginPageLocators class so that we should be able to access all the PageFactory elements. Secondly, create a public constructor of LoginPageActions class
package com.example.actions;

import org.openqa.selenium.support.PageFactory;
import com.example.locators.LoginPageLocators;
import com.example.utils.HelperClass;

public class LoginPageActions {

LoginPageLocators loginPageLocators = null;

    public LoginPageActions() {

    	this.loginPageLocators = new LoginPageLocators();

		PageFactory.initElements(HelperClass.getDriver(),loginPageLocators);
	}

	// Set user name in textbox
    public void setUserName(String strUserName) {
    	loginPageLocators.userName.sendKeys(strUserName);
    }

    // Set password in password textbox
    public void setPassword(String strPassword) {
    	loginPageLocators.password.sendKeys(strPassword);
    }

    // Click on login button
    public void clickLogin() {
    	loginPageLocators.login.click();
    }

    // Get the title of Login Page
    public String getLoginTitle() {
        return loginPageLocators.titleText.getText();
    }

   // Get the error message when username is blank
    public String getMissingUsernameText() {
        return loginPageLocators.missingUsernameErrorMessage.getText();
    }

   // Get the error message when password is blank
    public String getMissingPasswordText() {
        return loginPageLocators.missingPasswordErrorMessage.getText();
    }


    // Get the Error Message
    public String getErrorMessage() {
        return loginPageLocators.errorMessage.getText();
    }

    // LinkedIn Icon is displayed
    public Boolean getLinkedInIcon() {

        return loginPageLocators.linkedInIcon.isDisplayed();
    }

    // FaceBook Icon is displayed
    public Boolean getFaceBookIcon() {

        return loginPageLocators.faceBookIcon.isDisplayed();
    }

    // Click on Forget Your Password link
    public void clickOnForgetYourPasswordLink() {

    	loginPageLocators.ForgotYourPasswordLink.click();
    }

    public void login(String strUserName, String strPassword) {

        // Fill user name
        this.setUserName(strUserName);

        // Fill password
        this.setPassword(strPassword);

        // Click Login button
        this.clickLogin();

    }
}
HomePageActions
package com.example.actions;

import org.openqa.selenium.support.PageFactory;
import com.example.locators.HomePageLocators;
import com.example.utils.HelperClass;

public class HomePageActions {

	HomePageLocators homePageLocators = null;

    public HomePageActions() {

        this.homePageLocators = new HomePageLocators();

        PageFactory.initElements(HelperClass.getDriver(),homePageLocators);
    }


    // Get the User name from Home Page
    public String getHomePageText() {
        return homePageLocators.homePageUserName.getText();
    }

}
ForgotPasswordActions
package com.example.actions;

import org.openqa.selenium.support.PageFactory;

import com.example.locators.ForgotPasswordLocators;
import com.example.utils.HelperClass;

public class ForgotPasswordActions {

	ForgotPasswordLocators forgotPasswordLocators = null;

	public ForgotPasswordActions() {

		this.forgotPasswordLocators = new ForgotPasswordLocators();

		PageFactory.initElements(HelperClass.getDriver(),forgotPasswordLocators);
    }

    // Get the Heading of Forgot Password page
    public String getForgotPasswordPageText() {
        return forgotPasswordLocators.ForgotPasswordHeading.getText();
    }
}
Step 7: Create a Step Definition file in src/test/java
Create the corresponding Step Definition file of the feature file.
LoginPageDefinitions
package com.example.definitions;


import org.testng.Assert;
import com.example.actions.ForgotPasswordActions;
import com.example.actions.HomePageActions;
import com.example.actions.LoginPageActions;
import com.example.utils.HelperClass;

import io.cucumber.java.en.Given;
import io.cucumber.java.en.Then;
import io.cucumber.java.en.When;

public class LoginPageDefinitions {

	LoginPageActions objLogin = new LoginPageActions();
    HomePageActions objHomePage = new HomePageActions();
    ForgotPasswordActions objForgotPasswordPage = new ForgotPasswordActions();

    @Given("User is on HRMLogin page {string}")
    public void loginTest(String url) {

    	HelperClass.openPage(url);

    }

    @When("User enters username as {string} and password as {string}")
    public void goToHomePage(String userName, String passWord) {

        // login to application
        objLogin.login(userName, passWord);

        // go the next page

    }

    @When("User clicks on Forgot your Password Link")
    public void goToForgotYourPasswordPage() {

    	objLogin.clickOnForgetYourPasswordLink();

    }

    @Then("User should be able to login successfully and new page open")
    public void verifyLogin() {

        // Verify home page
        Assert.assertTrue(objHomePage.getHomePageText().contains("Dashboard"));

    }

    @Then("User should be able to see error message {string}")
    public void verifyErrorMessage(String expectedErrorMessage) {

        // Verify home page
    	Assert.assertEquals(objLogin.getErrorMessage(),expectedErrorMessage);

    }

    @Then("User should be able to see a message {string} below Username")
    public void verifyMissingUsernameMessage(String message) {

    	Assert.assertEquals(objLogin.getMissingUsernameText(),message);
    }

    @Then("User should be able to see LinkedIn Icon")
    public void verifyLinkedInIcon( ) {

    	Assert.assertTrue(objLogin.getLinkedInIcon());
    }

    @Then("User should be able to see FaceBook Icon")
    public void verifyFaceBookIcon( ) {

    	Assert.assertTrue(objLogin.getFaceBookIcon());
    }

    @Then("User should navigate to a new page")
    public void verfiyForgetYourPasswordPage() {

    	Assert.assertEquals(objForgotPasswordPage.getForgotPasswordPageText(), "Reset Password");
    }

}
Step 8: Create Hook class in src/test/java
Create the hook class that contains the Before and After hook. @Before hook contains the method to call the setup driver which will initialize the chrome driver. This will be run before any test.
import org.openqa.selenium.OutputType;
import org.openqa.selenium.TakesScreenshot;
import com.example.utils.HelperClass;
import io.cucumber.java.After;
import io.cucumber.java.Before;
import io.cucumber.java.Scenario;

public class Hooks {

	@Before
    public static void setUp() {
       HelperClass.setUpDriver();
    }

	@After
	public static void tearDown(Scenario scenario) {

		//validate if scenario has failed
		if(scenario.isFailed()) {
			final byte[] screenshot = ((TakesScreenshot) HelperClass.getDriver()).getScreenshotAs(OutputType.BYTES);
			scenario.attach(screenshot, "image/png", scenario.getName());
		}

		HelperClass.tearDown();
	}
}
Step 9: Create a Cucumber Test Runner class in src/test/java
Add the extent report cucumber adapter to the runner class’s CucumberOption annotation.
plugin = {"com.aventstack.extentreports.cucumber.adapter.ExtentCucumberAdapter:"})
The updated Cucumber Runner class looks like as shown below:
import io.cucumber.testng.AbstractTestNGCucumberTests;
import io.cucumber.testng.CucumberOptions;

@CucumberOptions(tags = "", features = "src/test/resources/features/LoginPage.feature", glue = "com.example.definitions",
                 plugin = {"com.aventstack.extentreports.cucumber.adapter.ExtentCucumberAdapter:"})

public class CucumberRunnerTests extends AbstractTestNGCucumberTests {

}
Step 10: Create the testng.xml for the project
Right-click on the project and select TestNG -> convert to TestNG.
<?xml version="1.0" encoding="UTF-8"?>
<!DOCTYPE suite SYSTEM "https://testng.org/testng-1.0.dtd">
<suite name="Suite">
  <test name="ExtentReport5 for Cucumber7">

  <classes>
  <class name = "com.example.runner.CucumberRunnerTests"/>
  </classes>
  </test> <!-- Test -->
</suite> <!-- Suite -->
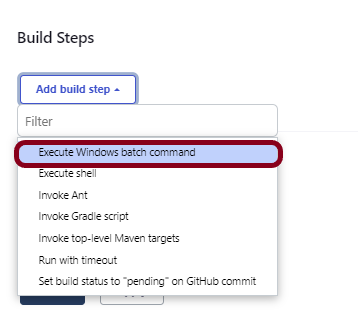
Step 11: Execute the code
Right-click on the Runner class and select Run As -> TestNG Test.
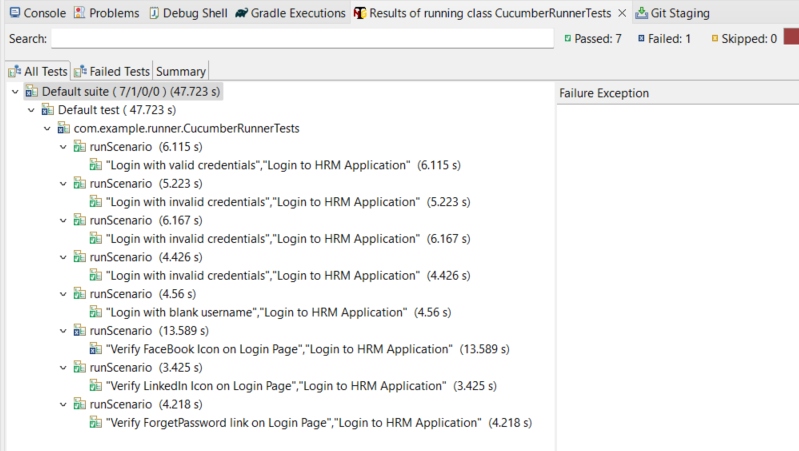
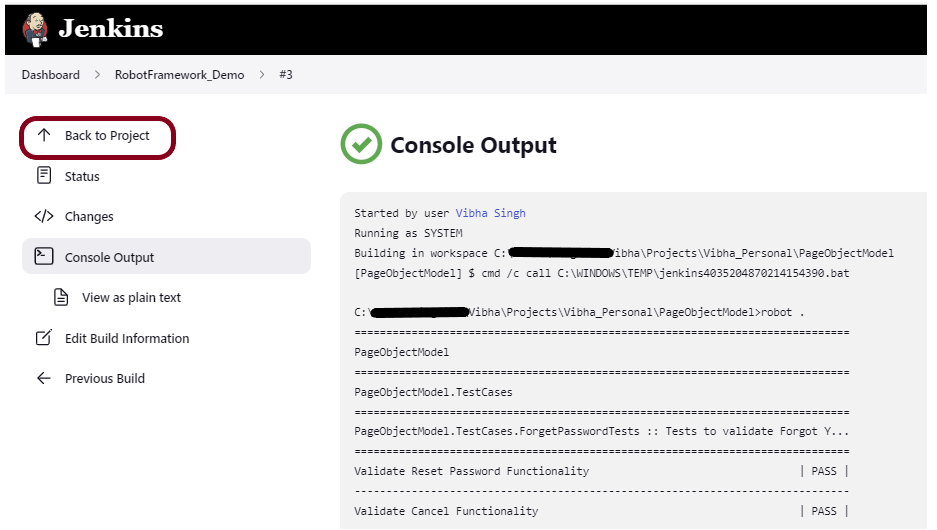
Below is the screenshot of the Console. As expected, 4 tests, out of 5 are passed and 1 failed.
Step 12: View ExtentReport
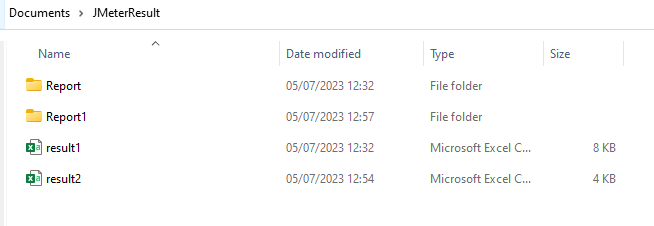
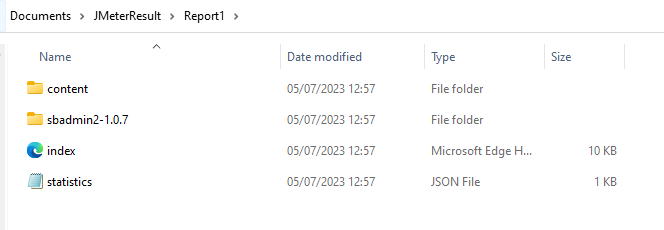
Refresh the project and will see a new folder – SparkReport_ which further contains 4 folders – HtmlReport, PdfReport, Reports, and Screenshots.
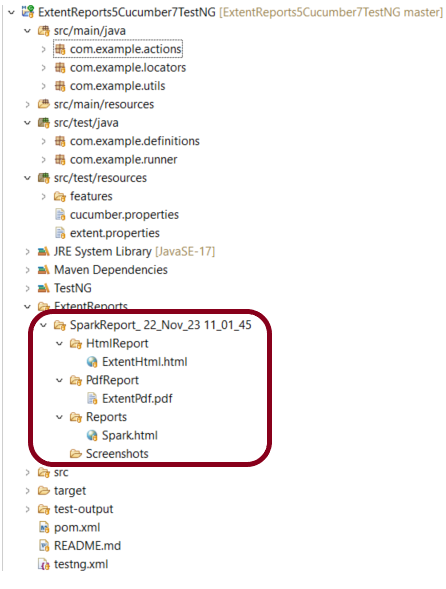
The ExtentReport will be present in the Reports folder with the name Spark.html. PDF Report is present in PdfReport folder and the HTML Report is present in HtmlReport folder. We can see that the Screenshots folder is empty because we have used the base64imagesrc feature which results in no physical screenshots. The screenshots are embedded in the reports.
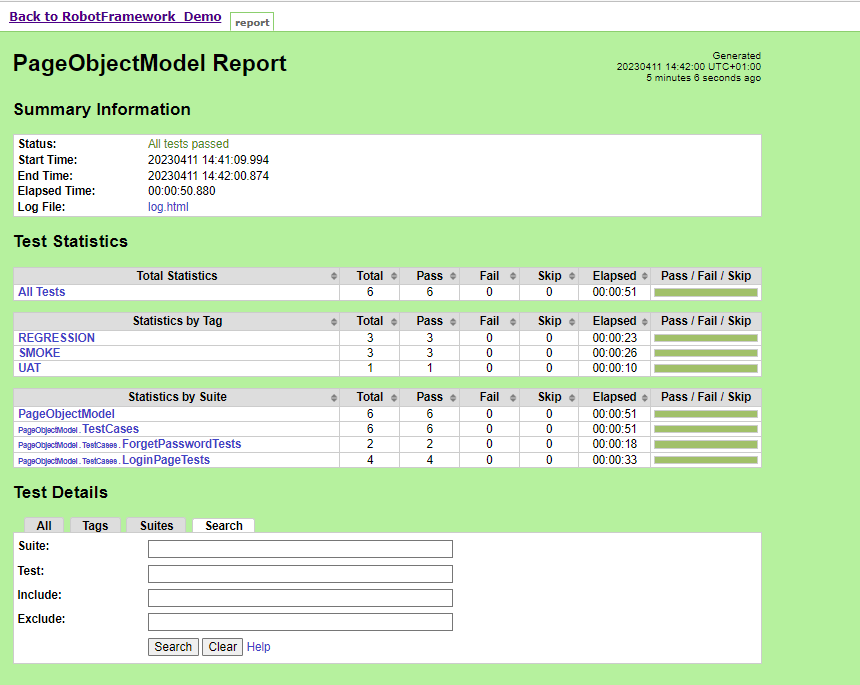
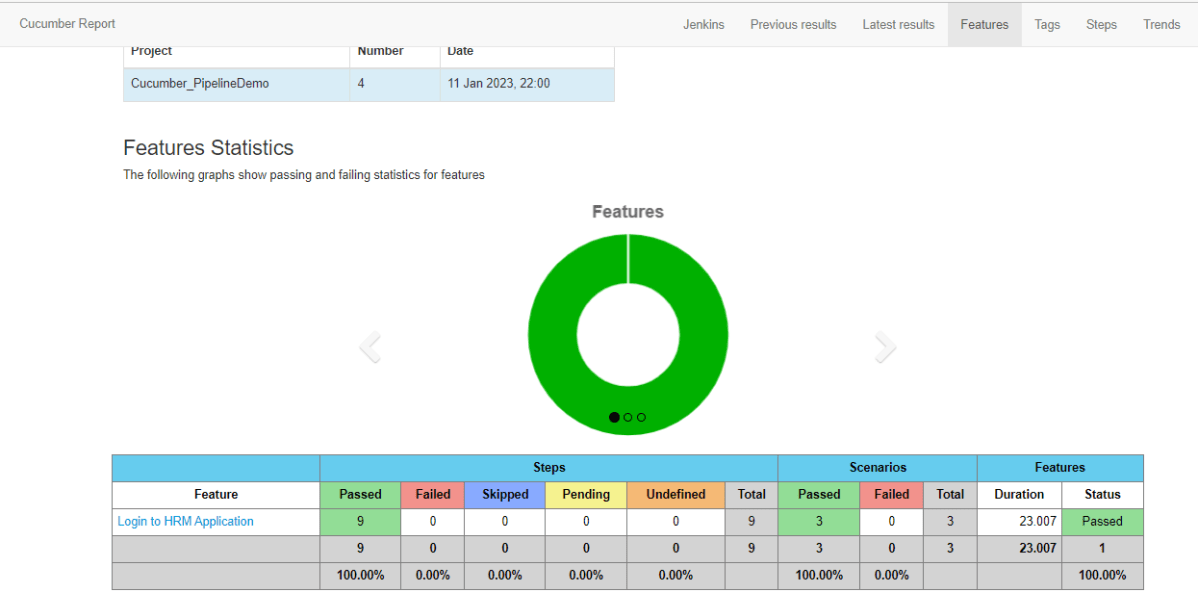
Right-click and open the ExtentHtml.html report with Web Browser. The report also has a summary section that displays the summary of the execution. The summary includes the overview of the pass/fail using a pictogram, start time, end time, and pass/fail details of features as shown in the image below.
ExtentHtml.html
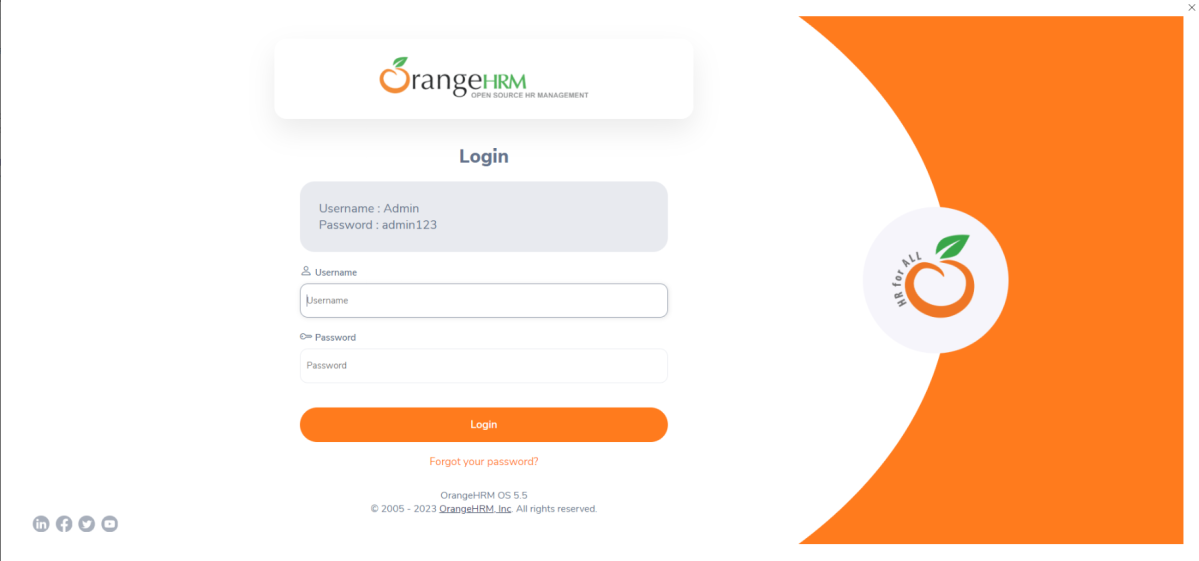
The failed test has a screenshot embedded in it. Double-click on mase64image and it will open the screenshot in full screen.
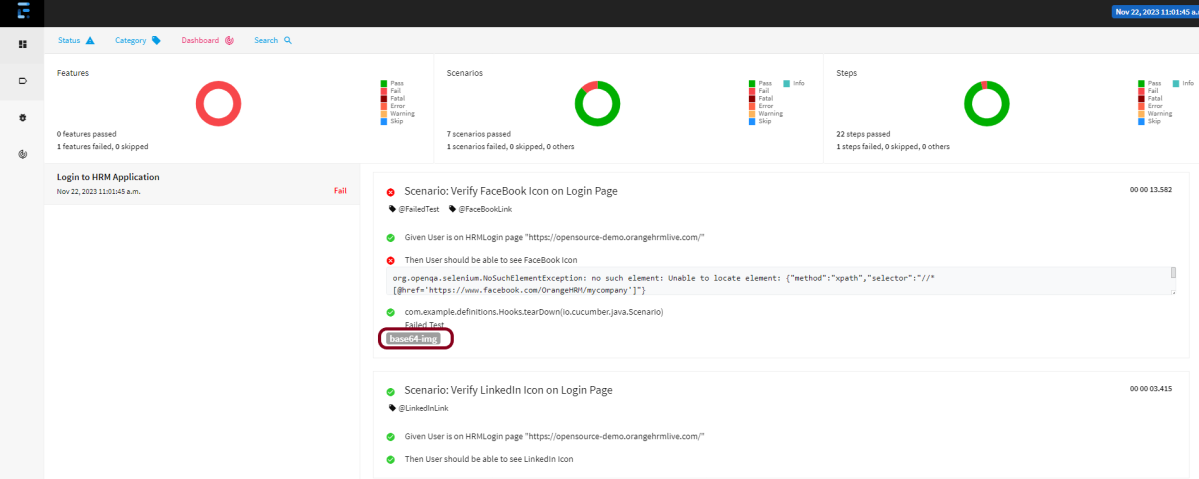
Screenshot of failed Test Case
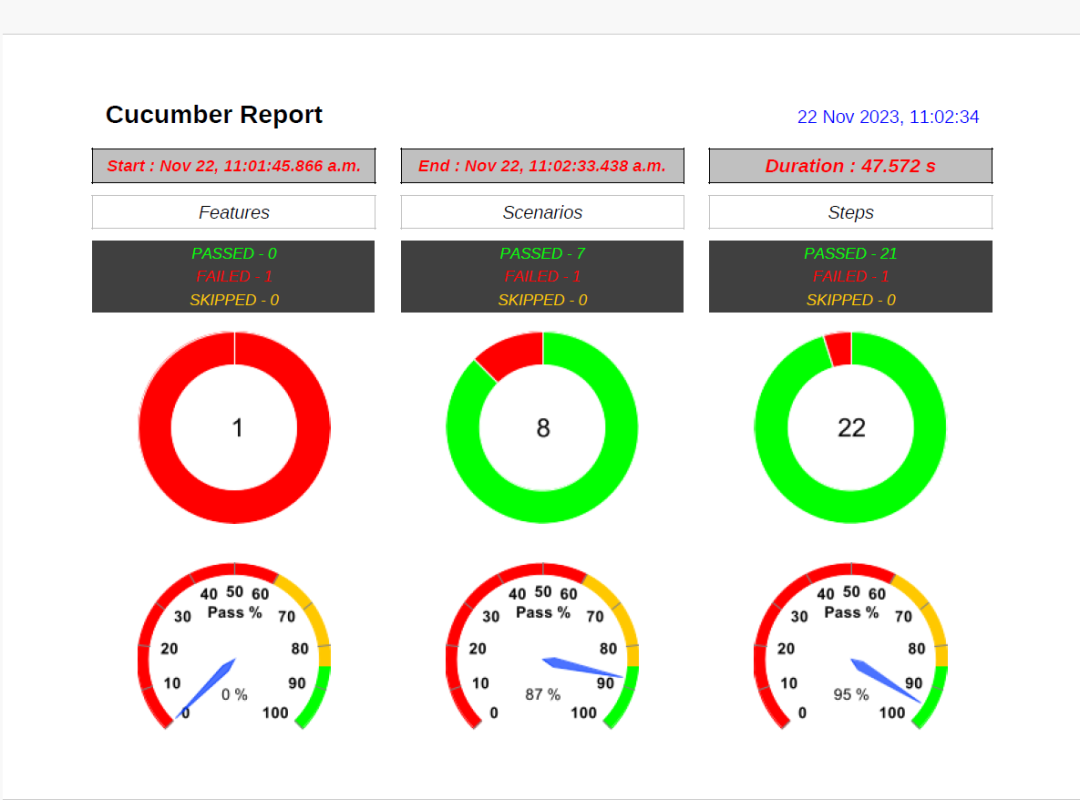
PDF Report
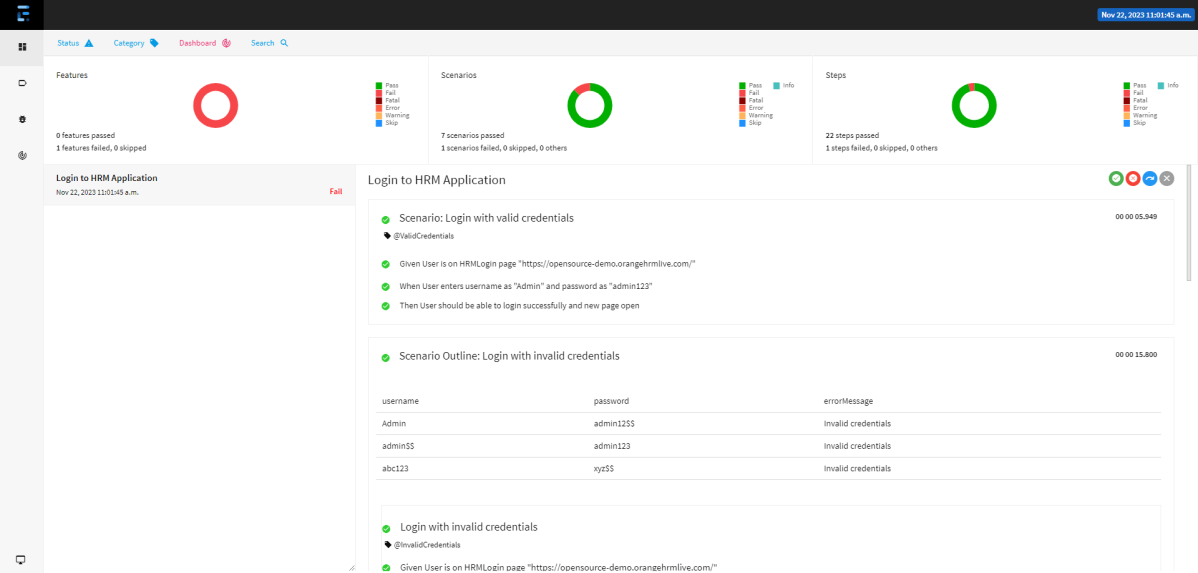
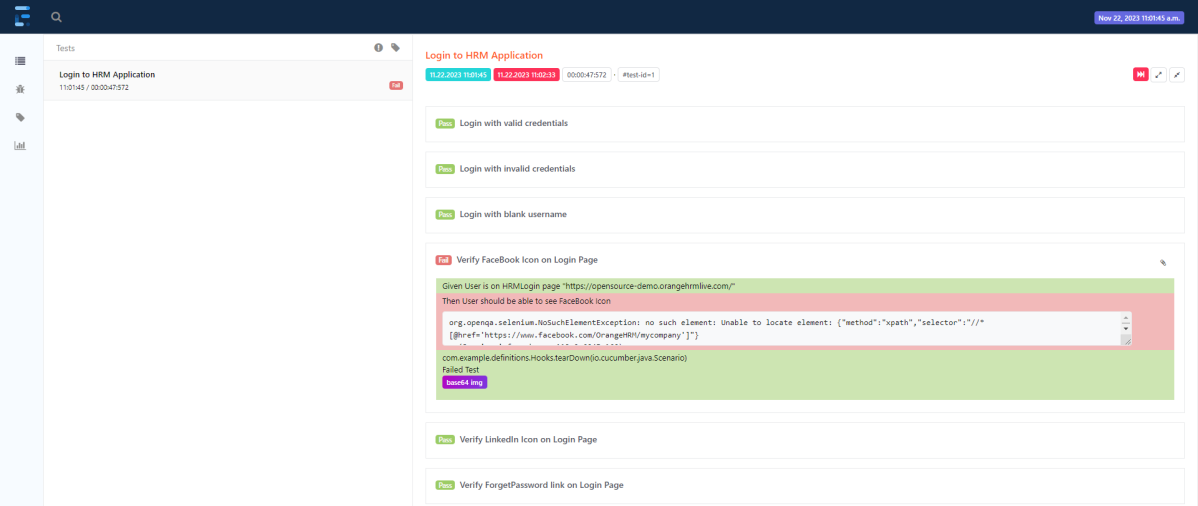
Spark Report
Right-click and open the Spark.html report with Web Browser.
Congratulations on making it through this tutorial and hope you found it useful! Happy Learning!! Cheers!!
The complete code can be found on GitHub.
Additional Tutorials


