Integration of JMeter with Jenkins

Last Updated On

HOME

Integrating JMeter with Jenkins is a powerful way to enhance CI/CD pipelines by automating performance testing. In this tutorial, we are going to learn how we can integrate JMeter with Jenkins.

Table of Contents

Why do we need to integrate JMeter with Jenkins?

A few of the main benefits of using JMeter with Jenkins are:

  • Unattended test execution for each system.
  • Build failure logs and recovery steps.
  • Secure and easy access to test reports of each build.
  • Automation of routine work.

Prerequisite

Implementation Steps

Step 1: Download the Performance Plugin

To generate a Performance Report in Jenkins, we need to download Performance Plugin. Please refer to this tutorial to install the plugin – How to install Plugins in Jenkins.

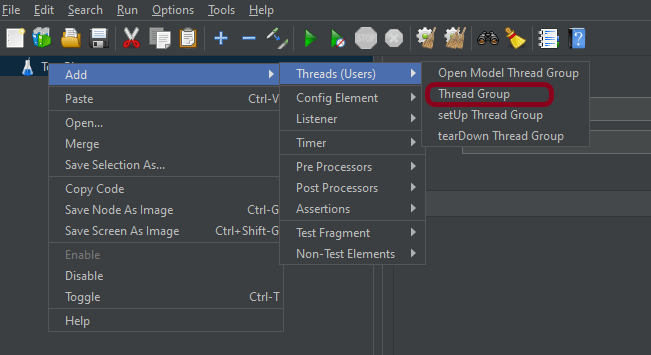
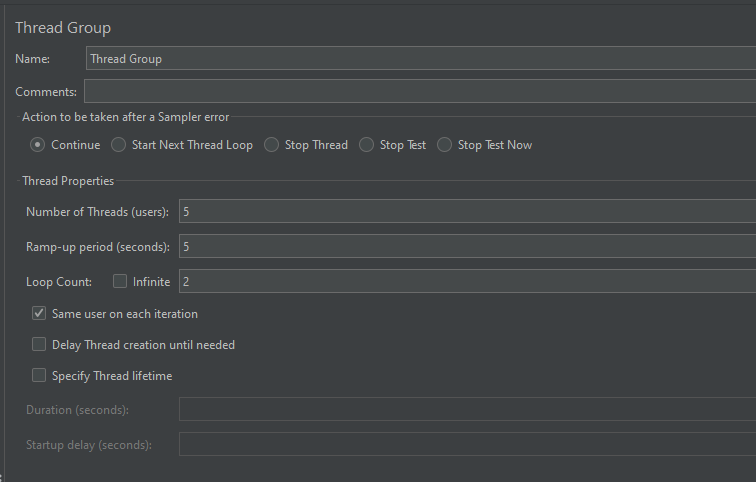
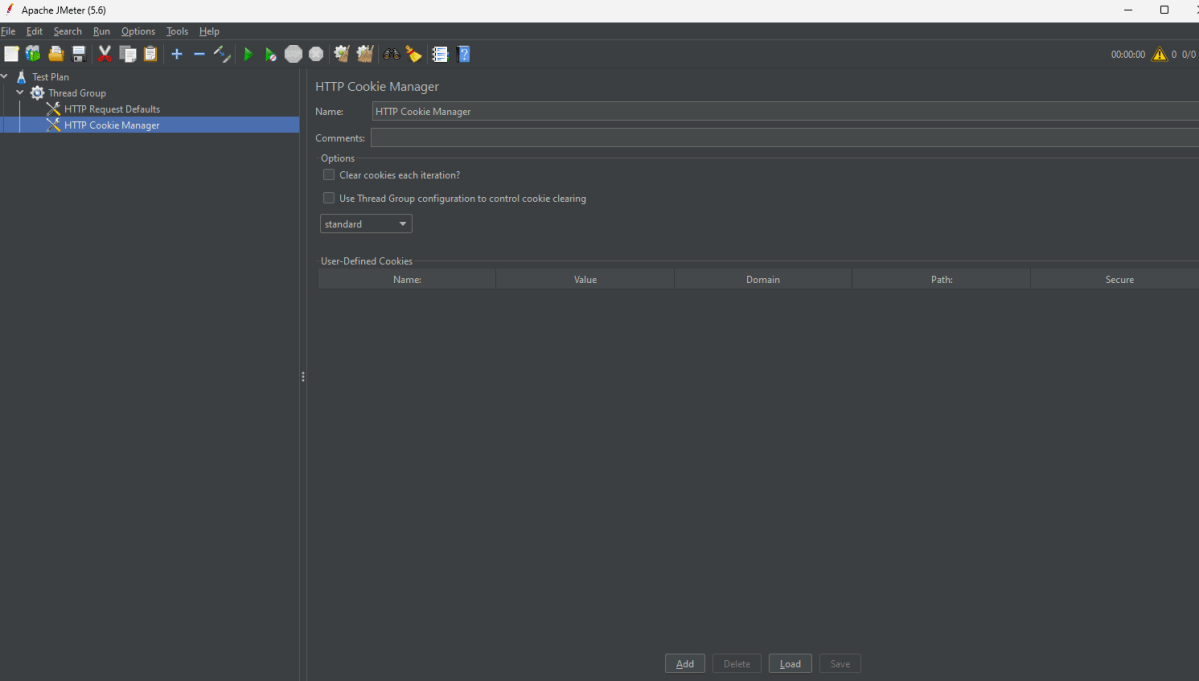
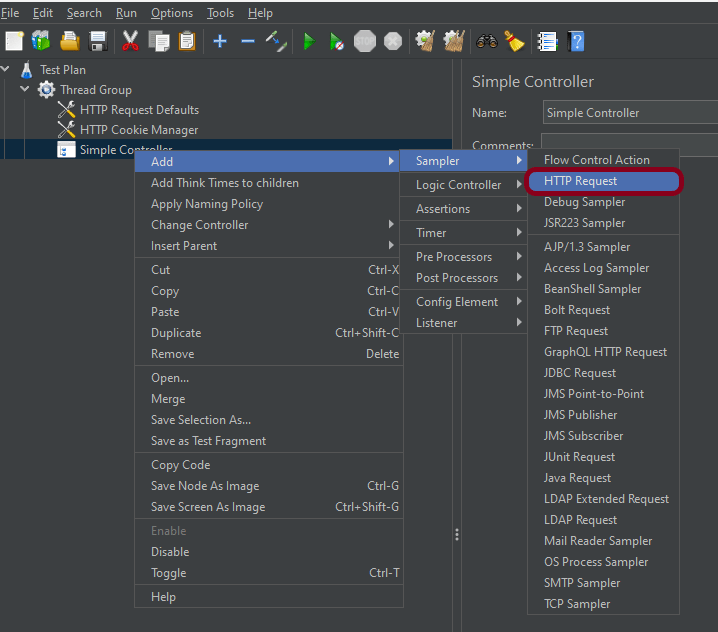
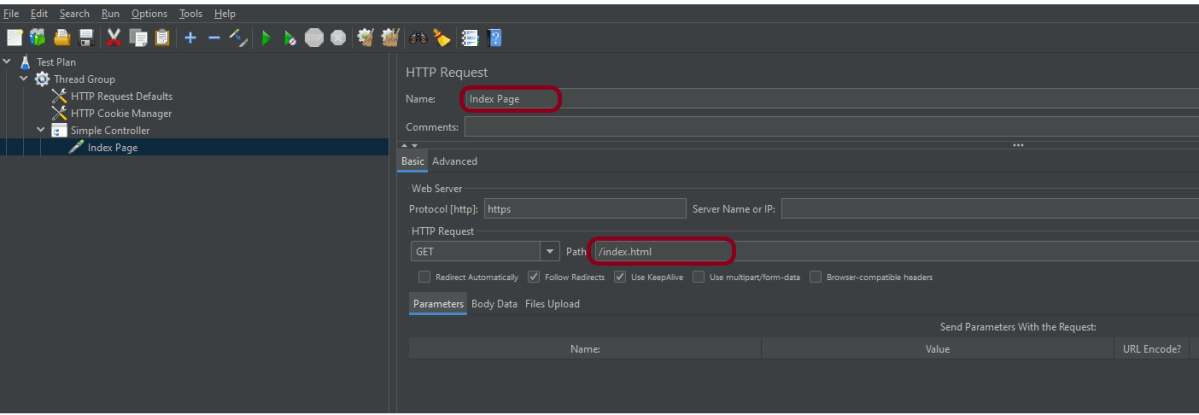
Step 2: Create a JMeter Script

It is advisable to have a JMeter Script built and tested that it is working locally. To know how to create a JMeter Script, please refer to this tutorial – How to send POST requests in JMeter.

Step 3: Create a new FreeStyle project

  1. Give the Name of the project – JMeter_Demo
  2. Click on the FreeStyle project. 
  3. Click on the OK button.

In the General section, enter the project description in the Description box.

Step 4: Source Code Management

Select Source Code Management as None if the project is locally present on the machine.

Step 5: Select Execute Windows batch command

In the Build Steps section, select Execute Windows batch command.

Use the below command to go to the path where the JMeter is placed in your system.

cd C:\Users\Vibha\Documents\Vibha\Automation\apache-jmeter-5.6\apache-jmeter-5.6\bin

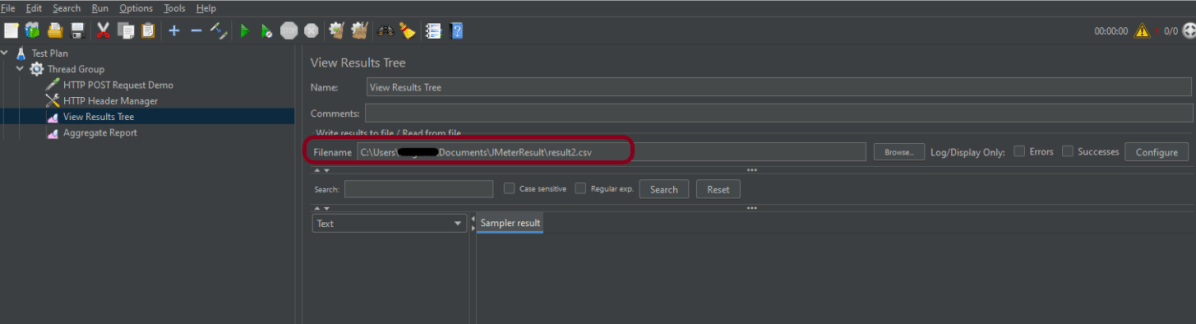
jmeter -n -t C:\Users\Vibha\Documents\Vibha\Automation\apache-jmeter-5.6\apache-jmeter-5.6\bin\POST_Demo.jmx -l C:\Users\Vibha\Documents\Vibha\Automation\apache-jmeter-5.6\apache-jmeter-5.6\results\result1.jtl

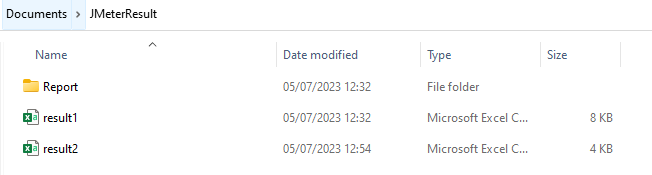
In the above command, we are executing the JMeter Script – POST_Demo.jmx as well as generating a result1.jtl file in the folder results.

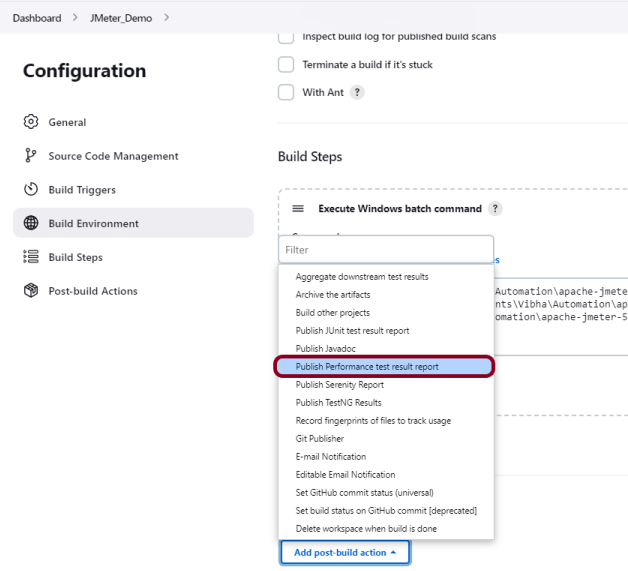
Step 6: Select “Publish Performance test result report” from “Post Build Actions”

Scroll down to ‘Post Build Actions’ and click on the ‘Add Post Build Actions’ drop-down list. Select Publish Performance test result report.“. 

Enter the Source data files as the path in workspace where the report will be saved .

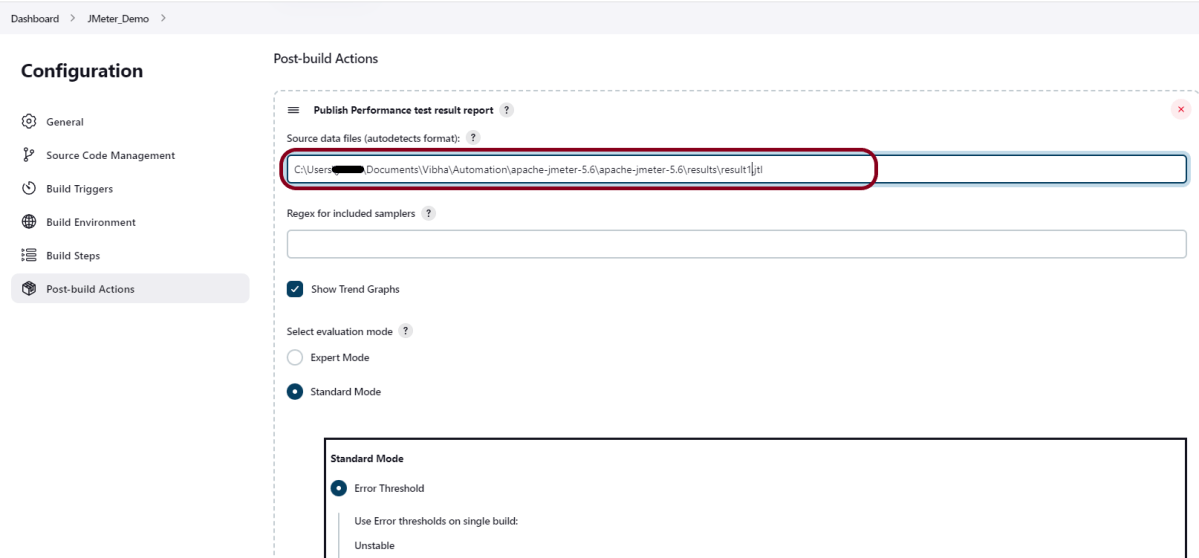
Click on the Apply and Save buttons.

We have created a new project JMeter_Demo” with the configuration to run the JMeter and also to generate JMeter Reports after execution using Jenkins.

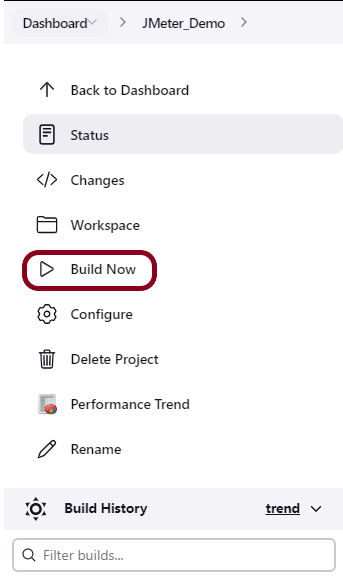
Step 7: Execute the tests

Let’s execute it now by clicking on the “Build Now” button. 

Right-click on Build Number (here in my case it is #1).

Click on Console Output to see the result.

Step 8: View the Performance Report

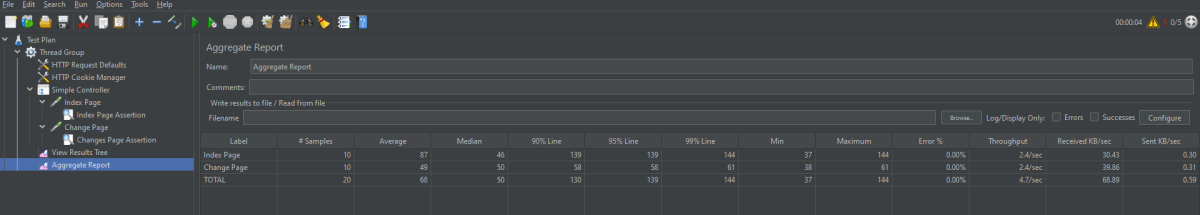
Once the execution is completed, we can see a link to view the ‘Performance Report’.

Click on the Performance Report. It displays the summary of the tests.

Congratulations on making it through this tutorial and hope you found it useful! Happy Learning!! Cheers!!

Additional Tutorials

Integration Of Jenkins With Selenium WebDriver
How to install Maven Plugin in Jenkins
Integrate Gradle project with Jenkins
Jenkins GitLab Integration
How to generate HTML Reports in Jenkins
Integration of Cucumber Report with TestNG in Jenkins
Serenity with Jenkins

How to create Web Test Plan for JMeter?

Last Updated On

HOME

In this tutorial, we will explain how to create a JMeter Test Plan for a Web Application.

Create a Web Test Plan in JMeter


Step 1 –  Add Thread Group

  • Select Test Plan on the tree
  • Add Thread Group                                                                                                                               Right-click on Test Plan> Add > Threads

In the Thread Group control panel, enter Thread Properties as follows: We will take an example of row no 5

Number of Threads: 5 – Number of users connects to the target website
Ramp-Up Period: 5 – It tells JMeter how long to delay before starting the next user. For example, if we have 5 users and a 5 -second Ramp-Up period, then the delay between starting users would be 1 second (5 seconds /5 users).

Loop Count: 2  – Number of times to execute testing

Step 2 –  Adding JMeter elements  

2.1 Add HTTP Request Defaults
Here, we need to enter the URL of the testing site.
Right-click on Thread Group> Add > Config Element > HTTP Request Defaults

2.2 Add HTTP Cookie Manager

The cookie policy should be set to Compatibility.
Right-click on Thread Group > Add > Config Element > HTTP Cookie Manager

Below is the HTTP Cookie Manager added to the plan.

2.3 Add the Simple Controller

A simple controller is used as a container for the request. We add the login and home page under the simple Controller.
Right-click on Thread Group > Add > Logic Controller > Simple Controller


2.4 Add HTTP Request Sampler

It is used for HTTP page requests.
Right-click on Simple Controller> Add >Sampler> HTTP Request

The below-mentioned are the values used in HTTP Request to perform the test

  • Name – Index Page
  • Server Name or IP – Blank
  • Port – Blank
  • Method – GET
  • Path – /index.html

2.5 Add Response Assertion

Add the Assertion method to verify the Index page.
Right-click on Index Page (HTTP request) > Add > Assertions > Response Assertion

Add text to verify the Index Page

2.6 Add Second HTTP Request Sampler

It is used for HTTP page requests for the Change page.
Right-click on Simple Controller> Add >Sampler> HTTP Request

The below-mentioned are the values used in HTTP Request to perform the test

  • Name – Change Page
  • Server Name or IP – Blank
  • Port – Blank
  • Method – GET
  • Path – /changes.html

2.7 Add Second Response Assertion

Add the Assertion method to verify the Change page.
Right-click on Index Page (HTTP request) > Add > Assertions > Response Assertion

Add text to verify the Changes Page

Step 3 – Adding Listeners to Test Plan

Listeners – They show the results of the test execution. They can show results in a different format such as a tree, table, graph, or log file
We are adding the View Result Tree listener

View Result Tree – View Result Tree shows the results of the user request in basic HTML format
Right-click on Test Plan, Add -> Listener -> View Result Tree

Aggregate Report

It is almost the same as Summary Report except Aggregate Report gives a few more parameters like, “Median”, “90% Line”, “95% Line” and “99% Line”.

 Right Click on Thread Group > Add > Listener > Aggregate Report

Step 4 – Save the Test Plan

To Save: Click File Select -> Save Test Plan as ->Give the name of the Test Plan. It will be saved in .jmx format.

Step 5  – Run the Test Plan

Click on the Green Triangle as shown at the top to run the test.

Step 6 – View the Execution Status

Click on View Result Tree to see the status of Run. A successful request will be of a Green in the Text Section.

Click on Response data and Response Header to view other information about Response.

Click on Aggregate Report Result to see the aggregated status of Run.

We are done! Congratulations on making it through this tutorial and hope you found it useful! Happy Learning!!

Run Cucumber Tests in GitLab CI/CD

Last Updated on

HOME

This tutorial explains the process to run the Cucumber Tests in the GitLab pipeline. This is a very important step towards achieving CI/CD.

Table of Contents

  1. Prerequisite
  2. What is GitLab CI/CD Workflow?
  3. What is a headless browser?
  4. Why do we use Headless browser for executing tests in CI/CD pipeline?
  5. GitLab Section
    1. Create a blank project in GitLab
    2. Push the project from local repository to Gitlab Repository
    3. Create a .gitlab-ci.yml file in the project in GitLab
    4. Run the tests in the GitLab pipeline
    5. Check the status of the pipeline
    6. Download the report

Prerequisite:

  1. Cucumber 7
  2. TestNG (for Assertions)
  3. Selenium 4
  4. Java 11
  5. Maven/ Gradle
  6. GitLab Account

What is GitLab CI/CD Workflow?

GitLab automatically enables CI/CD pipelines for new projects. It’s just a matter of adding a new configuration file called .gitlab-ci.yml to your code repository with instructions for GitLab on what to run. So simply create the following basic workflow in your main repository directory and commit it:

The Serenity tests run on a headless browser in the pipeline.

What is a headless browser?

A headless browser is a web browser that operates without a graphical user interface (GUI). It is typically used for automated testing, web scraping, and server-side rendering of web pages. While traditional web browsers like Chrome, Firefox, or Safari have a visible interface for users to interact with, headless browsers work in the background and don’t display the web content visually.

Why do we use Headless browser for executing tests in CI/CD pipeline?

Headless browsers provide a consistent and controlled environment for running tests. They eliminate the variability introduced by different operating systems, browser versions, or screen resolutions, ensuring that tests produce consistent and reliable results across different environments.

Headless browsers can often execute tasks faster than their graphical counterparts. They don’t need to render and display web content, which can significantly reduce the execution time for automated tests or other web-related tasks, contributing to faster feedback in the CI/CD pipeline.

In the below example, our tests are in headless mode.

WebDriverManager.chromedriver().setup();
ChromeOptions ops = new ChromeOptions().setHeadless(true);
ops.addArguments("--remote-allow-origins=*");
driver = new ChromeDriver(ops);

To get the Cucumber Framework with MasterThoughts Report with TestNG, please refer to this tutorial – Implemention of ‘Masterthought’ Reports in Cucumber with TestNG.

GitLab Section

Step 1 – Create a blank project in GitLab

To know, how to create a blank new project in GitLab, please refer to this tutorial.

Step 2 – Push the project from local repository to Gitlab Repository

To know, how to push the changes in GitLab, please refer to this tutorial.

Step 3 – Create a .gitlab-ci.yml file in the project in GitLab

There are many ways to create a new file in GitLab. One of the ways is to create a file as shown in the below image.

It is a YAML file where you configure specific instructions for GitLab CI/CD. In the .gitlab-ci.yml, we can define:

  • The scripts you want to run.
  • Other configuration files and templates you want to include.
  • Dependencies and caches.
  • The commands you want to run in sequence and those you want to run in parallel.
  • The location to deploy your application to.
  • Whether you want to run the scripts automatically or trigger any of them manually.

Below is a sample example to run the Cucumber tests in the GitLab pipeline.

image: markhobson/maven-chrome
 
stages:
  - test
 
variables:
  MAVEN_OPTS: "-Dmaven.repo.local=.m2/repository"
 
test:
  stage: test
  allow_failure: true
 
# Run the tests  
  script:
    - echo "Executing BDD scenarios with maven"
    - mvn clean test
 
# Store artifacts
  artifacts:
    when: always
    name: "Cucumber Report"
    paths:
    - target/*
    expire_in: 24 h

Image – markhobson/maven-chrome is used in this test. It is a docker image for Java automated UI tests.

Pipeline configuration begins with jobs. Jobs are the most fundamental element of a  .gitlab-ci.yml file.

Jobs are:

  • Defined with constraints stating under what conditions they should be executed.
  • Top-level elements with an arbitrary name must contain at least the script clause.
  • Not limited in how many can be defined.

Jobs can output an archive of files and directories. This output is known as a job artifact. The expire_in keyword determines how long GitLab keeps the job artifacts. Here, it shows 24 hrs to retain the artifacts.

Step 4 – Run the tests in the GitLab pipeline

Now, when a new change is committed, a pipeline kicks off and it runs all the tests.

Step 5 – Check the status of the pipeline

Once the Status of the pipeline changes to either failed or passed.. that means the tests are already executed.

As you can see the Status is passed, it’s green colour. This means all the tests present in the test suite are executed and passed. If any test fails in the test suite, the final execution status will be brown. The reason for the brown colour is we have mentioned allow_failure: true.

Below shows the execution status report in the GitLab pipeline.

As I have added an artifact also in the .gitalb-ci.yml, which is highlighted in the image. This artifact creates a folder with the name “Cucumber_Report” and the reports in this folder come from the path /target/site. This artifact gives us the option to download the reports or browse the report. This report will be available for 24 hours only as mentioned in the gitlab-ci.yml.

Step 5 – Download the report

Once, will click on the download button, it will download “Cucumber_Report.zip”. Unzip the folder and it looks like something as shown below:

Example of Overview Features

Example of Overview Tags

Example of Overview Steps

Congratulations. This tutorial has explained the steps to run Cucumber tests in GitLab CI/CD. Happy Learning!!

How to generate JMeter HTML Report?

Last Modified Date

HOME

JMeter supports dashboard report generation to get graphs and statistics from a test plan. In this tutorial, we will explain how to generate JMeter HTML Report.

The dashboard generator is a modular extension of JMeter. Its default behaviour is to read and process samples from CSV files to generate HTML files containing graph views. It can generate the report at the end of a load test or on demand.

There are 2 ways to generate HTML Report

  1. Generation after load test
  2. Generation from an existing sample CSV log file

Create a Test Plan in JMeter

Sample Request

{
    "name": "Test",
    "job": "JMeter"
}

Sample Response

{
  "name":"Test",
  "job":"JMeter",
  "id":"955",
  "createdAt":"2023-07-03T15:46:18.038Z"
}


Step 1 –  Add Thread Group

  • Select Test Plan on the tree
  • Add Thread Group                                                                                                                               To add Thread Group: Right-click on the “Test Plan” and add a new thread group: Add -> Threads (Users) -> Thread Group

In the Thread Group control panel, enter Thread Properties as follows: We will take an example of row no 5

Number of Threads: 5 – Number of users connects to the target website
Loop Count: 5  – Number of times to execute testing
Ramp-Up Period: 5 – It tells JMeter how long to delay before starting the next user. For example, if we have 5 users and a 5 -second Ramp-Up period, then the delay between starting users would be 1 second (5 seconds /5 users).

Step 2 –  Adding JMeter elements  

The JMeter element used here is HTTP Request Sampler. In HTTP Request Control Panel, the Path field indicates which URL request you want to send


2.1 Add HTTP Request Sampler
To add: Right-click on Thread Group and select: Add -> Sampler -> HTTP Request

The below-mentioned are the values used in HTTP Request to perform the test

  • Name – HTTP POST Request Demo
  • Server Name or IP – reqres.in
  • Port – Blank
  • Method – POST
  • Path – /api/users

2.2 Add HTTP Head Manager

The Header Manager lets you add or override HTTP request headers like can add Accept-Encoding, Accept, Cache-Control

To add: Right-click on Thread Group and select: Add -> Config Element -> HTTP Read Manager

The below-mentioned are the values used in Http Request to perform the test
Content-type = application/json
accept – application/json

Step 3 – Adding Listeners to Test Plan

Listeners – They show the results of the test execution. They can show results in a different format such as a tree, table, graph, or log file
We are adding the View Result Tree listener

View Result Tree – View Result Tree shows the results of the user request in basic HTML format
To add: Right-click on Test Plan, Add -> Listener -> View Result Tree

Aggregate Report

It is almost the same as Summary Report except Aggregate Report gives a few more parameters like, “Median”, “90% Line”, “95% Line” and “99% Line”.

 To add: Right Click on Thread Group > Add > Listener > Aggregate Report

Step 4 – Save the Test Plan

To Save: Click File Select -> Save Test Plan as ->Give the name of the Test Plan. It will be saved in .jmx format.

The below image shows that the test is saved in Documents with the name POST_Load.jmx.

Report Generation after load test

Step 5  – Run the Test Plan from Command Line

Open the command prompt and go into JMeter’s bin folder.

cd C:\Users\Vibha\Documents\apache-jmeter-5.6\apache-jmeter-5.6\bin

Step 6 – View the Execution Status

Enter the following command:

jmeter -n -t <test JMX file> -l <test log file> -e -o <Path to output folder>

This is the command used in the script:

jmeter -n -t C:\Users\Vibha\Documents\apache-jmeter-5.6\apache-jmeter-5.6\POST_Load.jmx -l C:\Users\Vibha\Documents\JMeterResult\result1.csv -e -o C:\Users\Vibha\Documents\JMeterResult\Report

Below is the detail about the commands used in the execution.

-n: This specifies JMeter is to run in cli mode

-t: [name of JMX file that contains the Test Plan]

-l: [name of JTL file to log sample results to]

e: generate report dashboard after load test

-o: output folder where to generate the report dashboard after the load test. The folder must not exist or be empty

The test execution is displayed in the command line as shown below:

The result1.csv is saved as mentioned in the above command in the JMeterResult folder present in Documents:

Go to the Report Folder. You can find the generated HTML files in the given report path.

This report provides the following metrics:

In the Dashboard of the report;

  • APDEX (Application Performance Index) table that computes for every transaction the APDEX based on configurable values for tolerated and satisfied thresholds
  • A request summary graph showing the Success and failed requests

A Statistics table providing in one table a summary of all metrics per transaction including 3 configurable percentiles:

An error table providing a summary of all errors and their proportion in the total requests

A Top 5 Errors by Sampler table providing for every Sampler (excluding Transaction Controller by default) the top 5 Errors:

You can see that there are a lot of other types of reports too. You should explore these reports.

Generation from an existing sample CSV log file

Imagine, we have run the tests from JMeter GUI. Mention the path where we want to save the result file in the Filename option of one of the listeners.

Run the tests, and we can see that the result is generated.

Now, let us create a Report.

jmeter -g C:\Users\Vibha\Documents\JMeterResult\Result2.csv -o C:\Users\Vibha\Documents\JMeterResult\Report1

We can see that a new folder – Report1 is created.

Go inside the Report1 folder and see that the Index.html report is generated.

We are done! Congratulations on making it through this tutorial and hope you found it useful! Happy Learning!!

How to run JMeter tests from the command line


In this tutorial, we will explain how to run tests in JMeter in non-GUI mode (Command Line mode).

Why execute tests in non-GUI mode?

The JMeterGUI’s inability to handle huge loads and excessive resource consumption risks overloading the server, which would give you inaccurate test results information. Additionally, the less load you can generate throughout your tests, the more resource-intensive the server is.

Sample Request

{
    "name": "Test",
    "job": "JMeter"
}

Sample Response

{
  "name":"Test",
  "job":"JMeter",
  "id":"955",
  "createdAt":"2023-07-03T15:46:18.038Z"
}

Create a Test Plan in JMeter by following the below-mentioned steps


Step 1 –  Add Thread Group

  • Select Test Plan on the tree
  • Add Thread Group                                                                                                                               To add Thread Group: Right-click on the “Test Plan” and add a new thread group: Add -> Threads (Users) -> Thread Group

In the Thread Group control panel, enter Thread Properties as follows: We will take an example of row no 5

Number of Threads: 5 – Number of users connects to the target website
Loop Count: 5  – Number of times to execute testing
Ramp-Up Period: 5 – It tells JMeter how long to delay before starting the next user. For example, if we have 5 users and a 5 -second Ramp-Up period, then the delay between starting users would be 1 second (5 seconds /5 users).

Step 2 –  Adding JMeter elements  

The JMeter element used here is HTTP Request Sampler. In HTTP Request Control Panel, the Path field indicates which URL request you want to send


2.1 Add HTTP Request Sampler
To add: Right-click on Thread Group and select: Add -> Sampler -> HTTP Request

The below-mentioned are the values used in HTTP Request to perform the test

  • Name – HTTP POST Request Demo
  • Server Name or IP – reqres.in
  • Port – Blank
  • Method – POST
  • Path – /api/users

2.2 Add HTTP Head Manager

The Header Manager lets you add or override HTTP request headers like can add Accept-Encoding, Accept, Cache-Control

To add: Right-click on Thread Group and select: Add -> Config Element -> HTTP Read Manager

The below-mentioned are the values used in Http Request to perform the test
Content-type = application/json
accept – application/json

Step 3 – Adding Listeners to Test Plan

Listeners – They show the results of the test execution. They can show results in a different format such as a tree, table, graph, or log file
We are adding the View Result Tree listener

View Result Tree – View Result Tree shows the results of the user request in basic HTML format
To add: Right-click on Test Plan, Add -> Listener -> View Result Tree

Aggregate Report

It is almost the same as Summary Report except Aggregate Report gives a few more parameters like, “Median”, “90% Line”, “95% Line” and “99% Line”.

 To add: Right Click on Thread Group > Add > Listener > Aggregate Report

Step 4 – Save the Test Plan

To Save: Click File Select -> Save Test Plan as ->Give the name of the Test Plan. It will be saved in .jmx format.

The below image shows that the test is saved in Documents with the name POST_Load.jmx.

Step 5  – Run the Test Plan from Command Line

Open the command prompt and go into JMeter’s bin folder.

cd C:\Users\Vibha\Documents\apache-jmeter-5.6\apache-jmeter-5.6\bin

Step 6 – View the Execution Status

Enter the following command:

jmeter -n –t test.jmx -l testresults.jtl

This is the command used in the script:

jmeter -n -t C:\Users\Vibha\Documents\apache-jmeter-5.6\apache-jmeter-5.6\POST_Load.jmx -l C:\Users\Vibha\Documents\JMeterResult\result.jtl

Below is the detail about the commands used in the execution.

-n: This specifies JMeter is to run in cli mode

-t: [name of JMX file that contains the Test Plan]

-l: [name of JTL file to log sample results to]

The test execution is displayed in the command line as shown below:

The result.jtl is saved as mentioned in the above command in the JMeterResult folder present in Documents:

Let us open the result.jtl file.

It is very difficult to understand the result in this format. So, open JMeter in GUI mode.

Mention the location of the file in the Filename of the “View Results Tree” listener and hit enter. We can see the result now.

Click on Response data and Response Header to view other information about Response.

We are done! Congratulations on making it through this tutorial and hope you found it useful! Happy Learning!!

Run Gradle API Tests in GitLab CI/CD

Last Updated On

HOME

This tutorial explains the process to run the Gradle API Tests in the GitLab pipeline. This is a very important step towards achieving CI/CD.

Prerequisite:

  1. Serenity – 2.6.0
  2. Serenity Cucumber – 2.6.0
  3. Serenity Rest Assured – 2.6.0
  4. Rest Assured – 4.3.2
  5. Java 11
  6. JUnit – 4.13.2
  7. Gradle – 7.2
  8. GitLab Account

Please refer to this tutorial to get the structure and code of the Gradle project with Serenity and Rest API – Serenity BDD with Cucumber and Rest Assured in Gradle

What is GitLab CI/CD Workflow?

GitLab automatically enables CI/CD pipelines for new projects. It’s just a matter of adding a new configuration file called .gitlab-ci.yml to your code repository with instructions for GitLab on what to run. So simply create the following basic workflow in your main repository directory and commit it.

GitLab Section

Step 1 – Create a blank project in GitLab

To know, how to create a blank new project in GitLab, please refer to How to create a new project in GitLab.

Step 2 – Push the project from the local repository to Gitlab Repository

To know, how to push the changes to GitLab, please refer to How to push new local GIT Repository to GitLab.

Step 3 – Create a .gitlab-ci.yml file in the project in GitLab

There are many ways to create a new file in GitLab. One of the ways is to create a file as shown in the below image.

It is a YAML file where you configure specific instructions for GitLab CI/CD. In the .gitlab-ci.yml, we can define:

  • The scripts you want to run.
  • Other configuration files and templates you want to include.
  • Dependencies and caches.
  • The commands you want to run in sequence and those you want to run in parallel.
  • The location to deploy your application to.
  • Whether you want to run the scripts automatically or trigger any of them manually.

image : gradle:7.1.0-jdk11 
stages:
  - test

variables:
  GRADLE_OPTS: "-Dorg.gradle.daemon=false"

test:
  stage: test
  allow_failure: true
 
# Run the tests
  script:
    - echo "Executing BDD scenarios with Gradle"
    - gradle clean test
    - gradle reports	

 
# Store artifacts
  artifacts:
    when: always
    name: "Gradle Report"
    paths:
    - lib/target/site/serenity/*
    expire_in: 24 h

Image – gradle:7.1.0-jdk11 is used in this test. It is a docker image for Gradle with Java 11 installed in it.

Pipeline configuration begins with jobs. Jobs are the most fundamental element of a  .gitlab-ci.yml file.

Jobs are:

  • Defined with constraints stating under what conditions they should be executed.
  • Top-level elements with an arbitrary name and must contain at least the script clause.
  • Not limited in how many can be defined.

Jobs can output an archive of files and directories. This output is known as a job artifact. The expire_in keyword determines how long GitLab keeps the job artifacts. Here, it shows 24 hrs to retain the artifacts.

Step 4 – View GitLab Pipeline

Now, when a new change is committed, a pipeline kicks off and it runs all the tests. To view the pipeline, go to the left panel and click on the Build option. There are a number of sub-options in the Build option, click on the Pipelines.

Step 5 – Run the tests in the GitLab pipeline

The below image shows that the tests are running in the GitLab pipeline.

Step 6 – Check the status of the pipeline

Once the Status of the pipeline changes to either failed or passed, that means the tests are already executed.

As you can see, the Status is passed, its green colour. This means all the tests present in the test suite are executed and passed. If any test fails in the test suite, the final execution status will be brown. The reason for the brown colour is we have mentioned allow_failure: true.

Below shows the execution status report in the GitLab pipeline.

As I have added an artifact also in the .gitalb-ci.yml, which is highlighted in the image. This artifact creates a folder with the name “Serenity_Report” and the reports in this folder come from the path /target/site. This artifact gives us the option to download the reports or browse the report. This report will be available for 24 hours only as mentioned in the gitlab-ci.yml.

Step 7 – Download the report

Once, will click on the download button, it will download “Gradle_Report.zip”. Unzip the folder and it looks like something as shown below:

Example of Index.html

Example of Serenity Summary Report

Congratulations. This tutorial has explained the steps to run Serenity tests in GitLab CI/CD. Happy Learning!!

How to run SpringBoot project in GitLab CI/CD

Last Modified Date

HOME

This tutorial explains the process to run the SpringBoot project in the GitLab pipeline. This is a very important step towards achieving CI/CD.

Prerequisite:

  1. SpringBoot Starter Parent – 3.1.0
  2. Rest Assured – 5.3.0
  3. Java 17
  4. Maven – 3.8.6
  5. GitLab Account

Please refer to this tutorial to get the structure and code of the SpringBoot project – Testing of SpringBoot Application with JUnit5

What is GitLab CI/CD Workflow?

GitLab automatically enables CI/CD pipelines for new projects. It’s just a matter of adding a new configuration file called .gitlab-ci.yml to your code repository with instructions for GitLab on what to run. So simply create the following basic workflow in your main repository directory and commit it:

By default, GitLab will have CI/CD pipelines and Auto DevOps enabled for all projects. What this means is that, when you push code to the repository, GitLab will automatically trigger the pipeline.

GitLab Section

Step 1 – Create a blank project in GitLab

To know, how to create a blank new project in GitLab, please refer to How to create a new project in GitLab.

Step 2 – Push the project from the local repository to Gitlab Repository

To know, how to push the changes to GitLab, please refer to How to push new local GIT Repository to GitLab.

Step 3 – Create a .gitlab-ci.yml file in the project in GitLab

There are many ways to create a new file in GitLab. One of the ways is to create a file as shown in the below image. I have already created .gitlab-ci.yml in the project, which can be seen in the image.

It is a YAML file where you configure specific instructions for GitLab CI/CD. In the .gitlab-ci.yml, we can define:

  • The scripts you want to run.
  • Other configuration files and templates you want to include.
  • Dependencies and caches.
  • The commands you want to run in sequence and those you want to run in parallel.
  • The location to deploy your application to.
  • Whether you want to run the scripts automatically or trigger any of them manually.

Below is a sample example to run the SpringBoot project (Maven) in the GitLab pipeline.

image: maven:3.8.5-openjdk-17
 
stages:
  - test
 
variables:
  MAVEN_OPTS: "-Dmaven.repo.local=.m2/repository"
 
test:
  stage: test
  allow_failure: true
 
# Run the tests
  script:
    - echo "Executing SpringBoot scenarios with maven"
    - mvn clean test site
 
# Store artifacts
  artifacts:
    when: always
    name: "SpringBoot Report"
    paths:
    - target/site/*
    expire_in: 24 h

Image – maven:3.8.5-openjdk-17 is used in this test. It is a docker image for Maven and have Java 17 installed in it.

Pipeline configuration begins with jobs. Jobs are the most fundamental element of a  .gitlab-ci.yml file.

Jobs are:

  • Defined with constraints stating under what conditions they should be executed.
  • Top-level elements with an arbitrary name and must contain at least the script clause.
  • Not limited in how many can be defined.

Jobs can output an archive of files and directories. This output is known as a job artifact. The expire_in keyword determines how long GitLab keeps the job artifacts. Here, it shows 24 hrs to retain the artifacts.

Step 4 – View GitLab Pipeline

Now, when a new change is committed, a pipeline kicks off and it runs all the tests. To view the pipeline, go to the left panel and click on the Build option. There are a number of sub-options in the Build option, click on the Pipelines.

Step 5 – Run the tests in the GitLab pipeline

The below image shows that the tests are running in the GitLab pipeline.

Step 6 – Manually run the tests in the GitLab pipeline

Whenever there is a new change committed, the pipeline runs automatically. Imagine the scenario when we need to run the pipeline without any new change. This can be done by clicking on the button “Run pipeline”.

Step 7 – Check the status of the pipeline

Once the Status of the pipeline changes to either failed or passed, that means the tests are already executed.

As you can see, the Status is passed, its green colour. This means all the tests present in the test suite are executed and passed. If any test fails in the test suite, the final execution status will be brown. The reason for the brown colour is we have mentioned allow_failure: true.

Below shows the execution status report in the GitLab pipeline.

As I have added an artifact also in the .gitalb-ci.yml, which is highlighted in the image. This artifact creates a folder with the name “Serenity_Report” and the reports in this folder come from the path /target/site. This artifact gives us the option to download the reports or browse the report. This report will be available for 24 hours only as mentioned in the gitlab-ci.yml.

Step 8 – Download the report

Once, will click on the download button, it will download “SpringBoot_Report.zip”. Unzip the folder and it looks like something as shown below:

Example of SureFire-Report.html

Example of Project Summary Report

Congratulations. This tutorial has explained the steps to run Serenity tests in GitLab CI/CD. Happy Learning!!

How to run SpringBoot tests with GitHub Actions

Last Modified Date

HOME

GitHub Actions is a powerful tool that can be used to automate your software development workflows. In this blog post, we will show you how to get started with GitHub Actions for Java Spring Boot.

Why GitHub?

The flexible aspects of GitHub Actions enable users to create powerful, fast, and efficient automated testing workflows in CI/CD environments.

CI/CD pipelines have contributed to the success of the DevOps cycle in all software development projects. This is a holistic process that bridges development and operations. Continuous integration helps development teams deploy code efficiently, and continuous delivery automates code deployment.

Implementation Steps

Step 1 – Create GitHub Actions and Workflows

I have a repository available on GitHub – SpringBoot_Serenity_Cucumber_JUnit4_Demo as shown in the below image. Go to the “Actions” tab.  Click on the “Actions” tab.

Step 2 – Select the type of Actions

You will see that GitHub recommends Actions depending on the project. In our case, it is recommending actions suitable for a Java project. I have selected the “Java with Maven” option as my project is built in Maven.

Step 3 – Generation of Sample pipeline

If you choose an existing option, it will automatically generate a .yaml for the project as shown below.

We will replace the current workflow with the following yml file as shown below:

name: Build and Test Java Spring Boot Application 

on:
  push:
    branches: [ "main" ]
  pull_request:
    branches: [ "main" ]

jobs:
  build:

    runs-on: ubuntu-latest

    steps:
    - uses: actions/checkout@v3
    - name: Set up JDK 17
      uses: actions/setup-java@v3
      with:
        java-version: '17'
        distribution: 'temurin'
        cache: maven
   
    - name: Build with Maven
      run: mvn clean verify

    - name: Test Report
      uses: actions/upload-artifact@v3
      if: success() || failure()
      with:
          name: SpringBoot Report               # Name of the folder
          path: target/site/serenity/           # Path to test results

Step 4 – Commit the changes

After the changes, hit the “Commit changes” button.

This will give the option to add a description for the commit. It will enable the user to commit either to the main branch. The user can also commit to any other branch that exists in the project. Click on the “Commit changes” button to set up the workflow file.

Below is the image of the newly created maven.yml file.

Step 5 – Verify that the workflow is running

Next, head over to the “Actions” tab, and you will see your YAML workflow file present under the tab. The yellow sign represents that the job is in the queue.

In Progress – When the job starts building and running, you will see the status change from “Queued” to “in progress”.

Passed – If the build is successful, you will see a green tick mark. 

Failed – In case the build has failed, then there will be a red cross mark.

Click on the workflow and the below screen is displayed. It shows the status of the run of the workflow. It also shows the total time taken to run the workflow and the name of the .yml file.

Below shows all the steps of the workflow.

Step 6 – Published artifacts on GitHub

Once the pipeline run, a SpringBoot Report folder will be generated as shown in the below image:

When we click on the folder SpringBoot Report, a zipped file will be downloaded. We can extract it to see all the files contained within it.

The image of the report is shown below:

The complete code can be found here on GitHub – SpringBoot_Serenity_Cucumber_JUnit4_Demo.

Congratulations! We just created our CI workflow for running our SpringBoot test cases.

Integration of GitHub with Jenkins

Last Modified Date

HOME

The previous tutorial has explained how to install it onto a Windows 10 system and create a Maven or Gradle project in Jenkins. Jenkins and GitHub are two powerful tools on their own, but what about using them together? In this tutorial, learn about the benefits of a Jenkins GitHub integration and how to set up the integration on your own.

What is GitHub?

GitHub is a web-based version control system and collaboration platform for developers. It is the center around which all things involving git revolve. GitHub allows software developers and engineers to create remote, public-facing repositories on the cloud for free. Once you’ve set up a repository on GitHub, you can copy it to your device, add and modify files locally, then “push” your changes back to the repository where your changes display for the public.

What is Jenkins?

Jenkins is a well-known open-source tool that aids in the implementation of Continuous Integration (CI) and Continuous Deployment/Continuous Delivery (CD) processes by automating parts of the software development pipeline such as building, testing, and deployment.

Jenkins Version Used – 2.361.2

In this version of Jenkins, Git Plugin is already installed. If the Git Plugin is not installed, then follow the below steps to add Git Plugin in Jenkins.

Step 1: Open your dashboard

Click on the Manage Jenkins button on your Jenkins dashboard:

Step 2: Select Manage Plugins

Click on the Manage Jenkins. Choose Manage Plugins.

Step 3:  Add Git Plugin

On the Plugins Page, go to the Available option.

  1. Select the GIT Plugin
  2. Click on Install without restart. The plugin will take a few moments to finish downloading depending on your internet connection, and will be installed automatically.
  3. You can also select the option Download now and Install after the restart button. In which plugin is installed after the restart
  4. You will be shown a “No updates available” message if you already have the Git plugin installed.

In my case, Git Plugin is already installed, so you can’t see it in the Available Plugin.

Step 4: Verify Git Plugin is installed

Once the plugins have been installed,
Go to Manage Jenkins on your Jenkins dashboard. You will see your plugins listed among the rest.

How to Integrate Jenkins With GitHub

Step 1: Create a new project using the Maven project plugin

  1. Give the Name of the project.
  2. Click on the Maven project. 
  3. Click on the OK button.

In the General section, enter the project description in the Description box.

Click on create new jobs.

Enter the item name, select the job type, and click OK. We shall create a Maven project as an example.

Step 2: Describe the project in the description section

In the General section, enter the project description in the Description box.

Step 3 – Source Code Management section

You will see a Git option under Source Code Management if your Git plugin has been installed in Jenkins.

Enter the Git repository URL to pull the code from GitHub. Enter the credentials to log in to GitHub.

I have already set up the credentials to log in to GitHub. For first-time users, click on the Add button and select Jenkins.

Add the username and password used to log in to GitHub. Click on the “Add” button.

Note:- Please make sure that Git is installed on your local machine. To install Git on your local machine, go to this tutorial – How to install Git on Windows 10.

Step 4: Build Management

Go to the Build section of the new job.

  1. In the Root POM textbox, enter pom.xml
  2. In the Goals and Options section, enter “clean test

Step 5: Select “Publish TestNG Results” from “Post Build Actions”

Scroll down to “Post Build Actions” and click on the “Add Post Build Actions” drop-down list. Select “Publish TestNG Results“. In my case, the project is set up to generate TestNG Report, so I have selected TestNG. But if your project uses any other reporting option, please select that from the dropdown.

Enter TestNG XML Report Pattern as “**target/surefire-reports/testng-results.xml” and click on the “Apply” and “Save” button.

We have created a new project GitHub_Demo” with the configuration to run TestNG Tests and also to generate TestNG Reports after execution using Jenkins.

Step 6: Execute the tests

Let’s execute it now by clicking on the “Build Now” button. 

Right-click on Build Number (here in my case it is #1) and click on Console Output to see the result.

Below is the screenshot of the Console Output. It displays all the information regarding the execution of the tests.

Step 7: View the TestNG Report

Once the execution is completed, we could see a link to view “TestNG Results“.

Click on the TestNG Results. It displays the summary of the tests.

This way, we could integrate GitHub in Jenkins.

Congratulations on making it through this tutorial and hope you found it useful! Happy Learning!! Cheers!!

Run Serenity Tests in GitLab CI/CD

Last Updated on

HOME

This tutorial explains the process to run the Serenity Tests in the GitLab pipeline. This is a very important step towards achieving CI/CD.

Table of Contents:

What is GitLab CI/CD Workflow?

GitLab automatically enables CI/CD pipelines for new projects. It’s just a matter of adding a new configuration file called .gitlab-ci.yml to your code repository with instructions for GitLab on what to run. So simply create the following basic workflow in your main repository directory and commit it:

The Serenity tests run on a headless browser in the pipeline.

What is a headless browser?

A headless browser is like any other browser but without a Head/GUI (Graphical User Interface).  A headless browser is used to automate the browser without launching the browser. While the tests are running, we could not see the browser, but we can see the test results coming on the console. The tests can run in the GitLab pipeline if the tests run in the headless mode.

Prerequisite:

  1. Serenity – 3.2.3
  2. Serenity Cucumber – 3.2.3
  3. JUnit Jupiter – 5.8.0
  4. JUnit Vintage – 5.8.0
  5. Java 11
  6. Maven – 3.8.1
  7. Selenium – 3.141.59
  8. Maven Compiler Plugin – 3.8.1
  9. Maven Surefire Plugin – 3.0.0-M5
  10. Maven FailSafe Plugin – 3.0.0-M5
  11. GitLab Account

Please refer to this tutorial to get the structure and code of the Serenity Project – Integration of Serenity with Cucumber and JUnit5.

GitLab Section

Step 1 – Create a blank project in GitLab

To know, how to create a blank new project in GitLab, please refer to this tutorial.

Step 2 – Push the project from the local repository to GitLab Repository

To know, how to push the changes in GitLab, please refer to this tutorial.

Step 3 – Create a .gitlab-ci.yml file in the project in GitLab

There are many ways to create a new file in GitLab. One of the ways is to create a file as shown in the below image.

It is a YAML file where you configure specific instructions for GitLab CI/CD. In the .gitlab-ci.yml, we can define:

  • The scripts you want to run.
  • Other configuration files and templates you want to include.
  • Dependencies and caches.
  • The commands you want to run in sequence and those you want to run in parallel.
  • The location to deploy your application to.
  • Whether you want to run the scripts automatically or trigger any of them manually.

image: markhobson/maven-chrome
 
stages:
  - test
 
variables:
  MAVEN_OPTS: "-Dmaven.repo.local=.m2/repository"
 
test:
  stage: test
  allow_failure: true
 
# Run the tests  
  script:
    - echo "Executing BDD scenarios with maven"
    - mvn clean verify
 
# Store artifacts
  artifacts:
    when: always
    name: "Serenity Report"
    paths:
    - target/site/*
    expire_in: 24 h

Image – markhobson/maven-chrome is used in this test. It is a docker image for Java automated UI tests.

This command lets the pipeline continue running subsequent jobs, even if the previous job is failed.

allow_failure: true

The below command is used to execute the tests from Maven in the docker image.

mvn clean verify

The below command means that the artifact should be generated every time the pipeline is run, irrespective of the fact if the job is successful or failed.

artifacts:
    when: always

The below command provides the name of the artifact. If this is not used, then the artifacts file is named artifacts, which becomes artifacts.zip when downloaded.

artifacts:
    name: "Serenity Report"

The below command provides the path of the files that should be present in the artifact.

artifacts:
    paths:
    - target/site/*

Pipeline configuration begins with jobs. Jobs are the most fundamental element of a  .gitlab-ci.yml file.

Jobs are:

  • Defined with constraints stating under what conditions they should be executed.
  • Top-level elements with an arbitrary name and must contain at least the script clause.
  • Not limited in how many can be defined.

Jobs can output an archive of files and directories. This output is known as a job artifact. The expire_in keyword determines how long GitLab keeps the job artifacts. Here, it shows 24 hrs to retain the artifacts.

Step 4 – Run the tests in the GitLab pipeline

Now, when a new change is committed, a pipeline kicks off and it runs all the tests.

Step 5 – Check the status of the pipeline

Once the Status of the pipeline changes to either failed or passed, that means the tests are already executed.

As you can see, the Status is passed, its green colour. This means all the tests present in the test suite are executed and passed. If any test fails in the test suite, the final execution status will be brown. The reason for the brown colour is we have mentioned allow_failure: true.

Below is the execution status report in the GitLab pipeline.

As I have added an artifact also in the .gitalb-ci.yml, which is highlighted in the image. This artifact creates a folder with the name “Serenity_Report” and the reports in this folder come from the path /target/site. This artifact gives us the option to download the reports or browse the report. This report will be available for 24 hours only as mentioned in the gitlab-ci.yml.

Step 6 – Download the report

Once, will click on the download button, it will download “Serenity_Report.zip”. Unzip the folder and it looks like something as shown below:

Example of Index.html

Example of Serenity Summary Report

Congratulations. This tutorial has explained the steps to run Serenity tests in GitLab CI/CD. Happy Learning!!