Jenkins is a self-contained, open-source automation server that can be used to automate all sorts of tasks related to building, testing, and delivering or deploying software.
Jenkins can be installed through native system packages, Docker, or even run standalone by any machine with a Java Runtime Environment (JRE) installed.
Jenkin’s installed and started on the computer. The current Jenkins version is – 2.361.2
To generate HTML Report in Jenkins, we need to download HTML Publisher Plugin. Please refer to this tutorial to install the plugin – How to install Plugins in Jenkins.
Implementation Steps
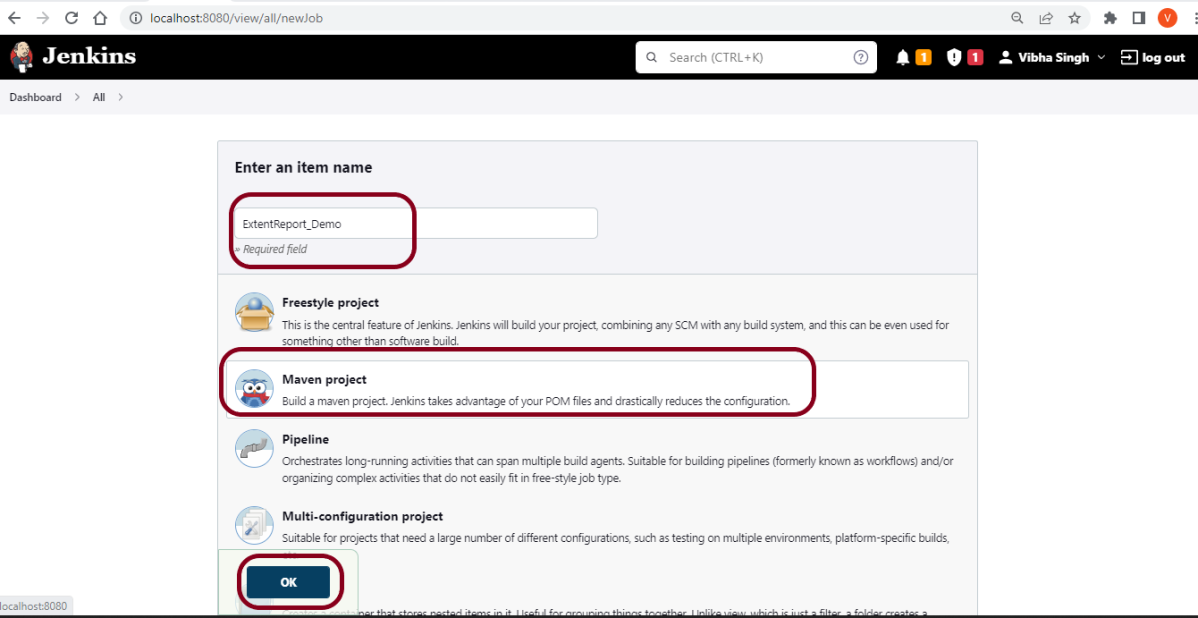
Step 1: Create a new Maven project
Give the Name of the project – ExtentReport_Demo
Click on the Maven project.
Click on the OK button.
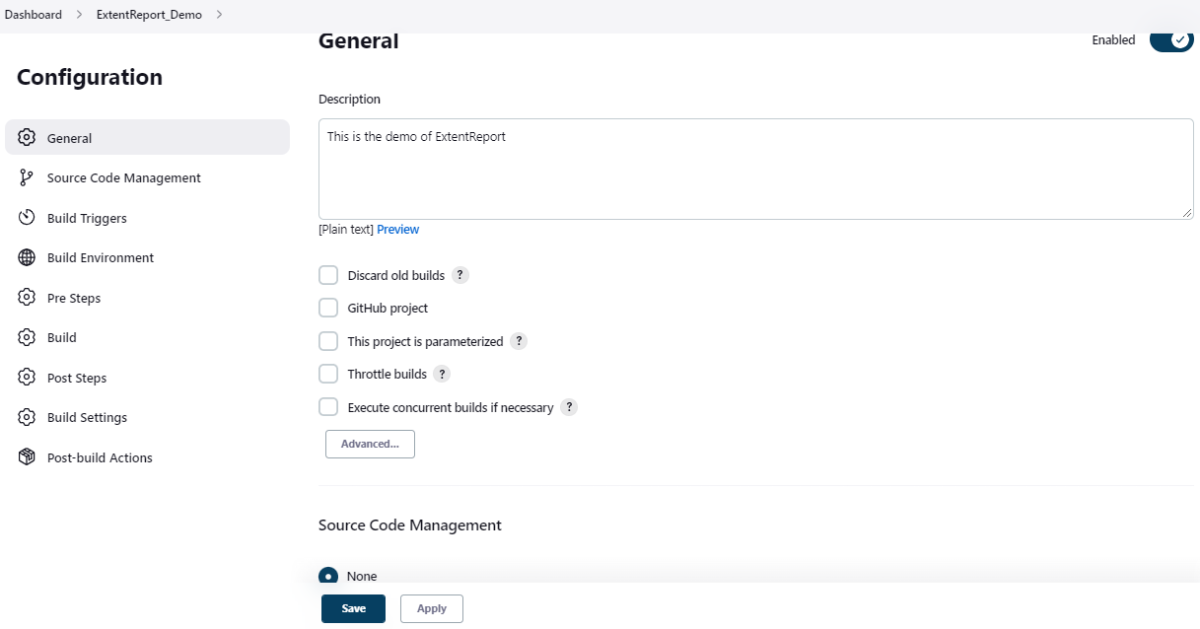
In the General section, enter the project description in the Description box.
Select Source Code Management as None if the project is locally present on the machine.
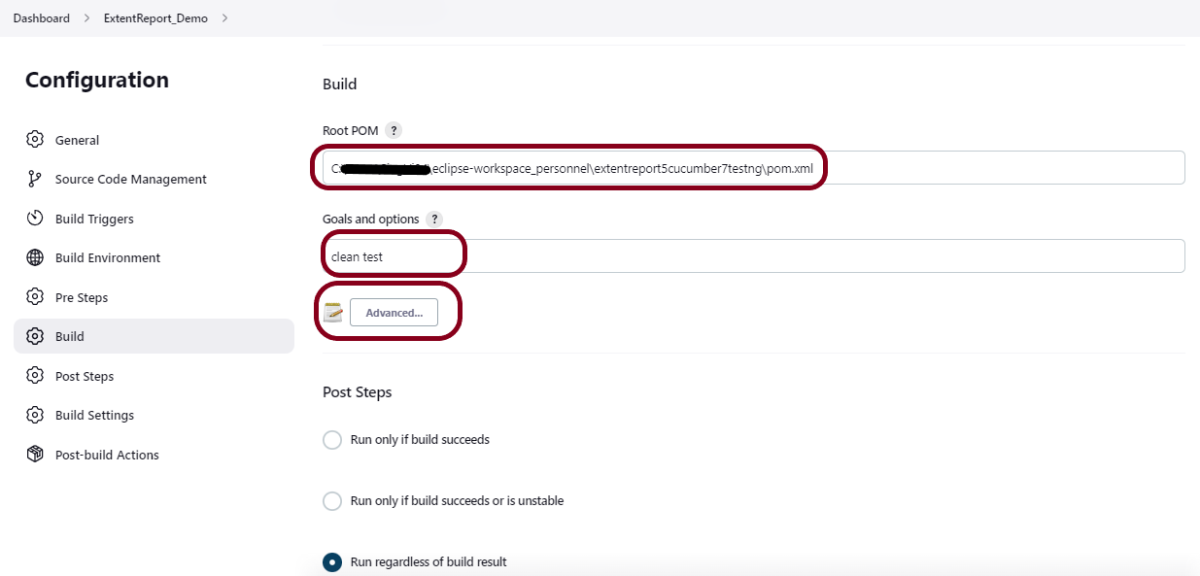
Step 2: Build Management
Go to the Build section of the new job.
In the Root POM textbox, enter the full path to pom.xml
In the Goals and options section, enter “clean test site”
Here, I have used the Selenium project with JUnit, so to see the complete project, please refer to this tutorial – How to generate JUnit4 Report.
Click on the Advanced button.
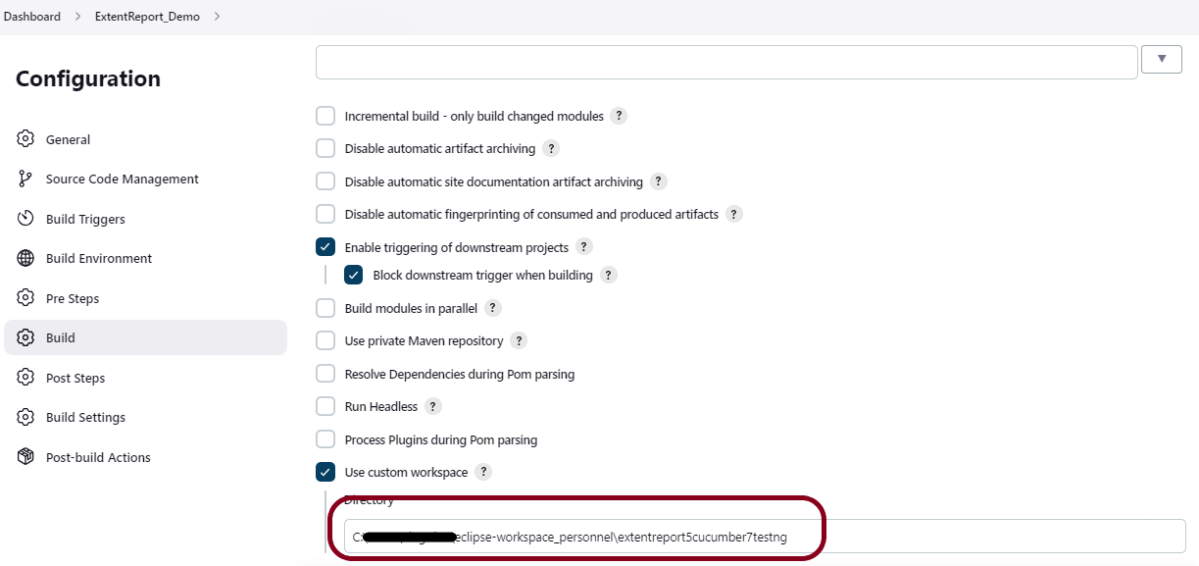
Step 3: Select a custom workspace
Mention the full path of the project in the directory.
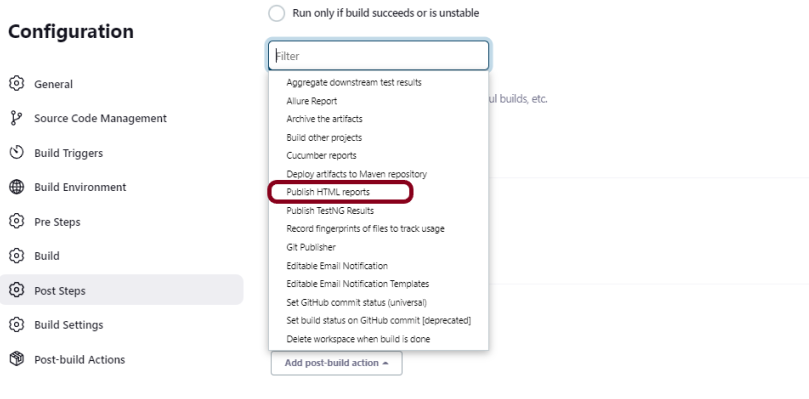
Step 4: Select “Publish HTML reports” from “Post Build Actions”
Scroll down to “Post Build Actions” and click on the “Add Post Build Actions” drop-down list. Select “Publish HTML reports“.
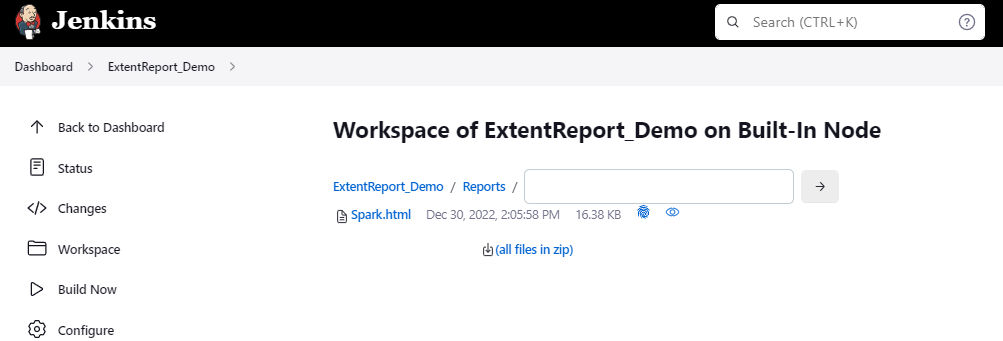
If you want to see where the report is saved in Jenkins, go to the Dashboard ->ExtentReport_Demo project -> Workspace ->target -> Reports -> Spark.html.
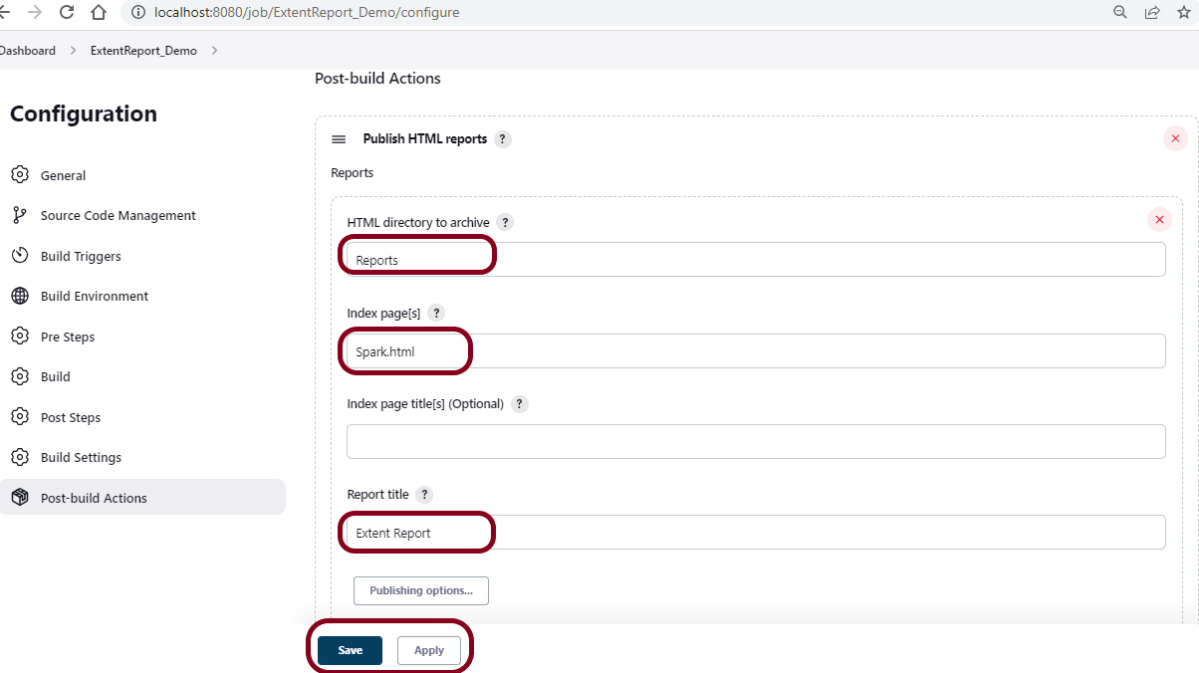
Enter the HTML directory to archive – Reports, Index page[s] – Spark.html, and Report title – Extent Report.
Click on the Apply and Save buttons.
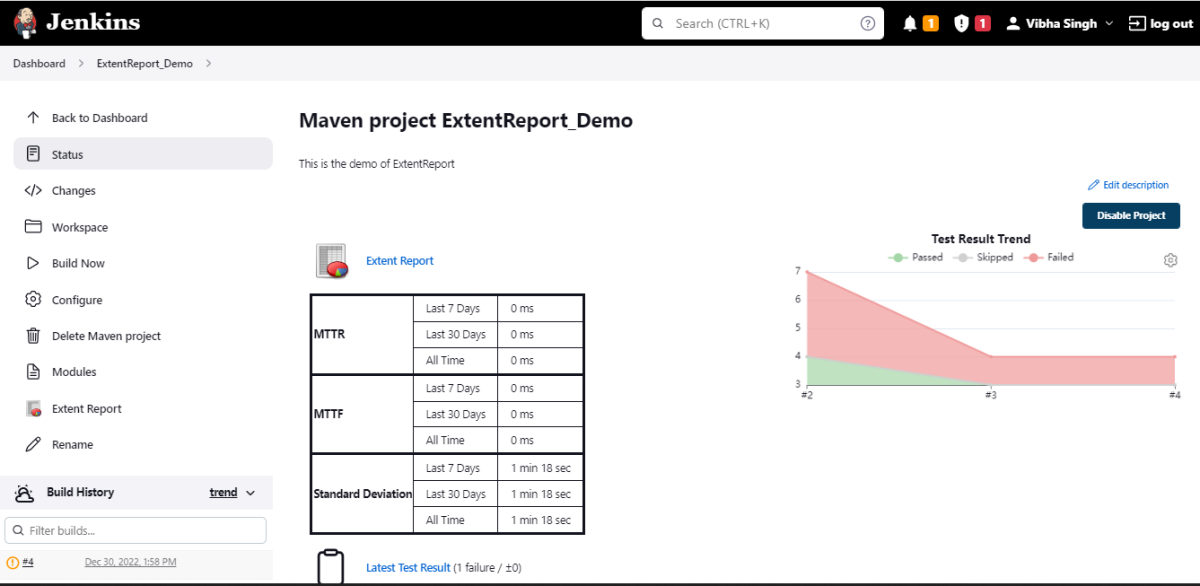
We have created a new Maven project “ExtentReport_Demo” with the configuration to run the Cucumber, and Selenium with TestNG Tests and also to generate HTML Report after execution using Jenkins.
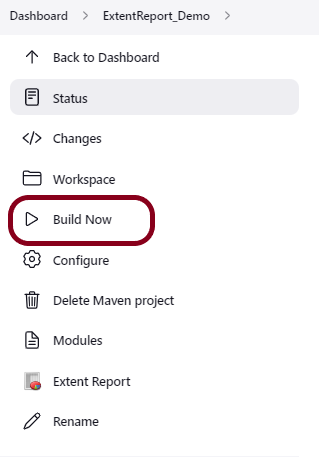
Step 5: Execute the tests
Let’s execute it now by clicking on the “Build Now” button.
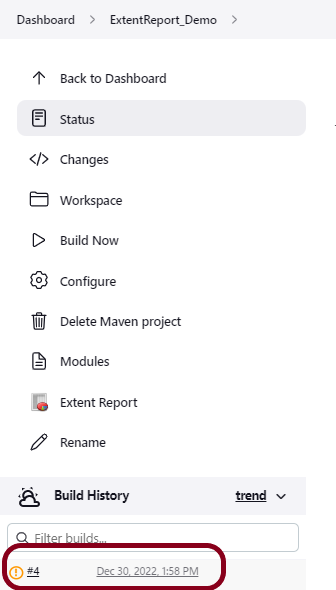
Right-click on Build Number (here in my case it is #4).
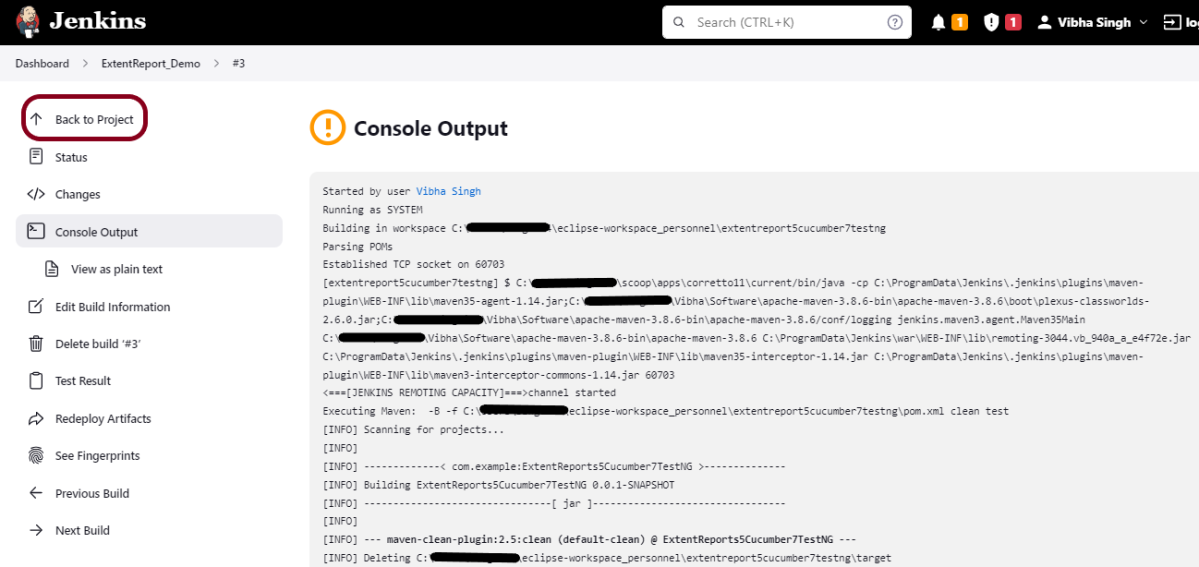
Click on Console Output to see the result.
Step 6: View the Extent Report
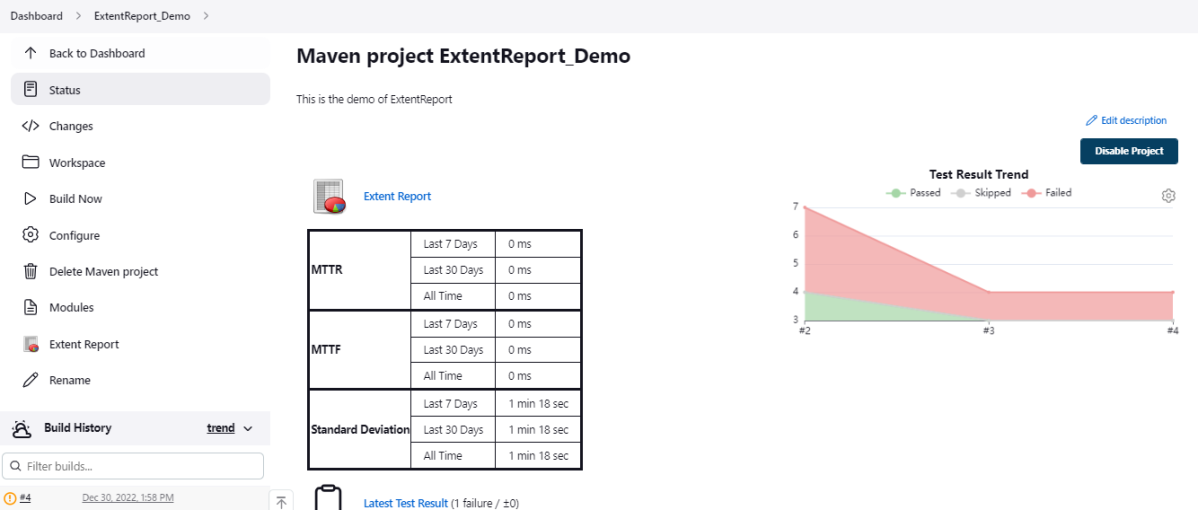
Once the execution is completed, click on go “Back to Project“, and we can see a link to view the “Extent Report“.
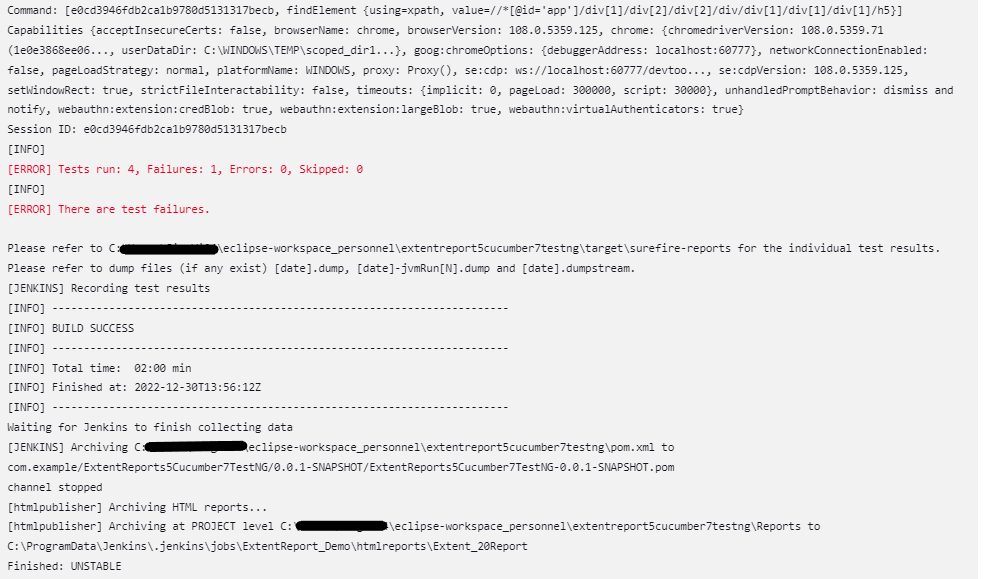
We can see here that the Extent Report link is displayed in the Console.
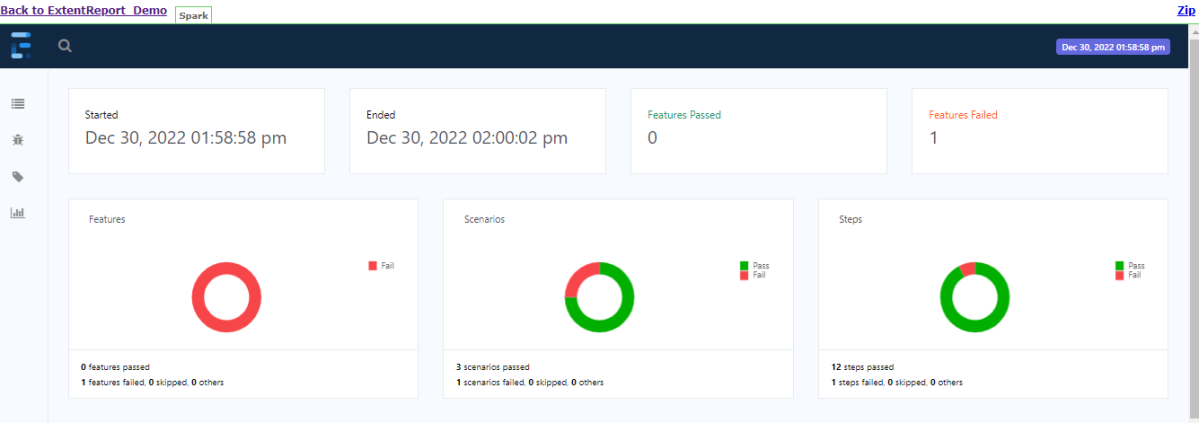
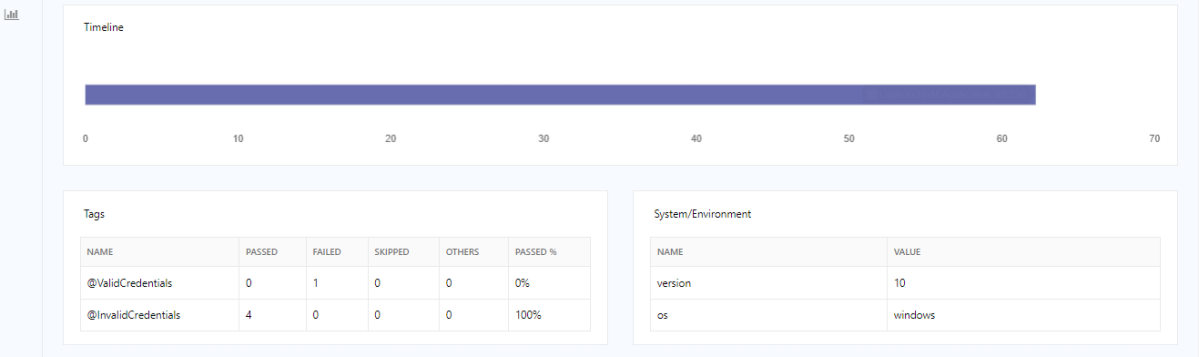
Below is the Extent Report generated in Jenkins.
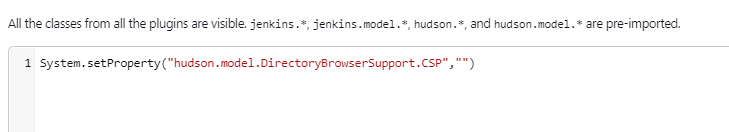
Tip: If you don’t see the Report UI intact, then you need to configure a simple Groovy script. For that, go to Dashboard–>Manage Jenkins–>Script Console and add the script as:
In the previous tutorial, I discussed the Jenkins pipeline. This tutorial will discuss the steps to create the Jenkins pipeline for Selenium tests. This is an important step in CI/CD.
3. To generate a HTML Report in Jenkins, we need to download the HTML Publisher Plugin. Please refer to this tutorial to install the plugin – How to generate HTML Reports in Jenkins
Implementation Steps
Step 1: Create a new pipeline project
Give the Name of the project – Selenium_PipelineDemo.
Click on the pipeline project.
Click on the OK button.
In the General section, enter the project description in the Description box.
Step 2: Scroll down to Pipeline
From the Definition field, choose the “Pipeline script from SCM” option. This option instructs Jenkins to obtain your Pipeline from Source Control Management (SCM), which will be your locally cloned Git repository.
From the SCM field, choose Git.
The “Repositories” section contains the “Repository URL” and “Credentials“.
In the Repository URL field, specify the directory path of the GitLab/GitHub project.
In the Credentials field, specify the username and password needed to log in to GitLab/GitHub.
In this case, I have the project present in GitLab and using it.
Step 3: Create Jenkinsfile
Create and save a new text file with the name Jenkinsfile at the root of the project in the GitLab repository. Here, we are using the Selenium project with TestNG. To learn more about the Integration of Selenium with TestNG, please refer to this tutorial – Integration of Selenium and TestNG.
For this tutorial, we are using Declarative syntax. The sample example is given below:
Here, I have used emailable-report.html, you can also use index.html and that report will be published.
pipeline {
    agent any

    stages {
        stage('Test') {
            steps {
                bat "mvn -D clean test"
            }

            post {
                // If Maven was able to run the tests, even if some of the test
                // failed, record the test results and archive the jar file.
                success {
                   publishHTML([
                       allowMissing: false,
                       alwaysLinkToLastBuild: false,
                       keepAll: false,
                       reportDir: 'target/surefire-reports/',
                       reportFiles: 'emailable-report.html',
                       reportName: 'HTML Report',
                       reportTitles: '',
                       useWrapperFileDirectly: true])
                }
            }
        }
    }
}
Step 4: Specify branches to build a section under Repositories
Branch Specifier – */master (This is my main branch)
ScriptPath – Jenkinsfile
Click on the Apply and Save buttons.
We have created a new Maven project “Selenium_PipelineDemo” with the configuration to run the Selenium Test with TestNG.
Step 5: Execute the tests
Let’s execute it now by clicking on the “Build Now” button.
Right-click on Build Number (here in my case it is #11) and click on Console Output to see the result.
Below is the test execution summary.
Step 6: Pipeline Steps
Once the execution is completed, and we want to see the Pipeline Steps, click on the Pipeline Steps mentioned on the left side of the page.
Step 7: View the Report
Once the execution is completed, go back to “Selenium_PipelineDemo”. We can see below that the HTML Report is generated.
We could see a link to view ‘HTML Reports’. Click on the HTML Reports. It displays the emailable-report.html Report.
Tip: If you don’t see the Report UI intact, then you need to configure a simple groovy script. For that, go to Dashboard–>Manage Jenkins–>Script Console and add the script as:
Jenkins was installed and started on the computer.
Implementation Steps
Step 1: Create a new pipeline project
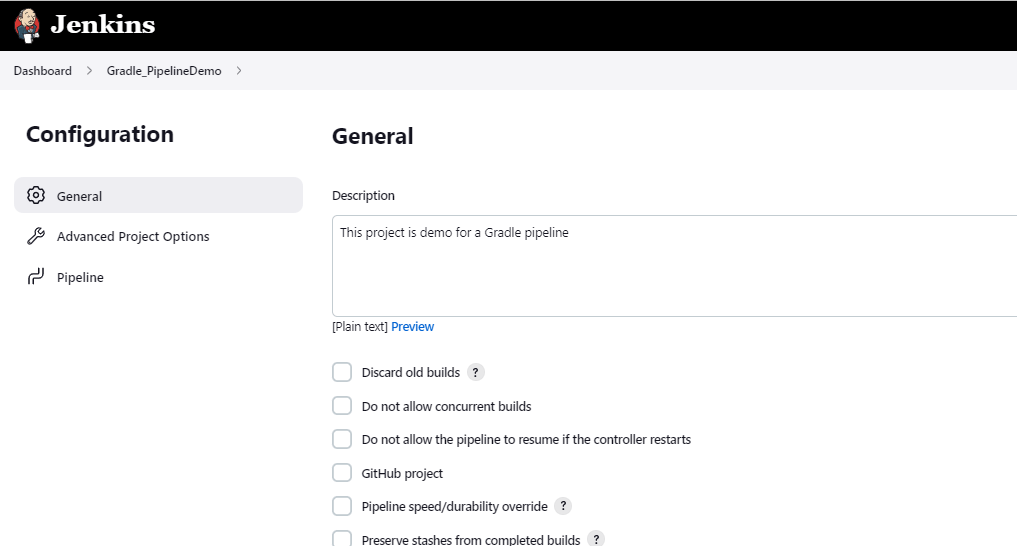
Give the Name of the project – Gradle_PipelineDemo
Click on the pipeline project.
Click on the OK button.
In the General section, enter the project description in the Description box.
Step 2: Scroll down to Pipeline
From the Definition field, choose the “Pipeline script from SCM” option. This option instructs Jenkins to obtain your Pipeline from Source Control Management (SCM), which will be your locally cloned Git repository.
From the SCM field, choose Git.
The Repositories section contains the Repository URL and Credentials.
In the Repository URL field, specify the directory path of the GitLab/GitHub project.
In the Credentials field, specify the username and password needed to log in to GitLab/GitHub.
In this case, I have the project is present in GitLab and using it.
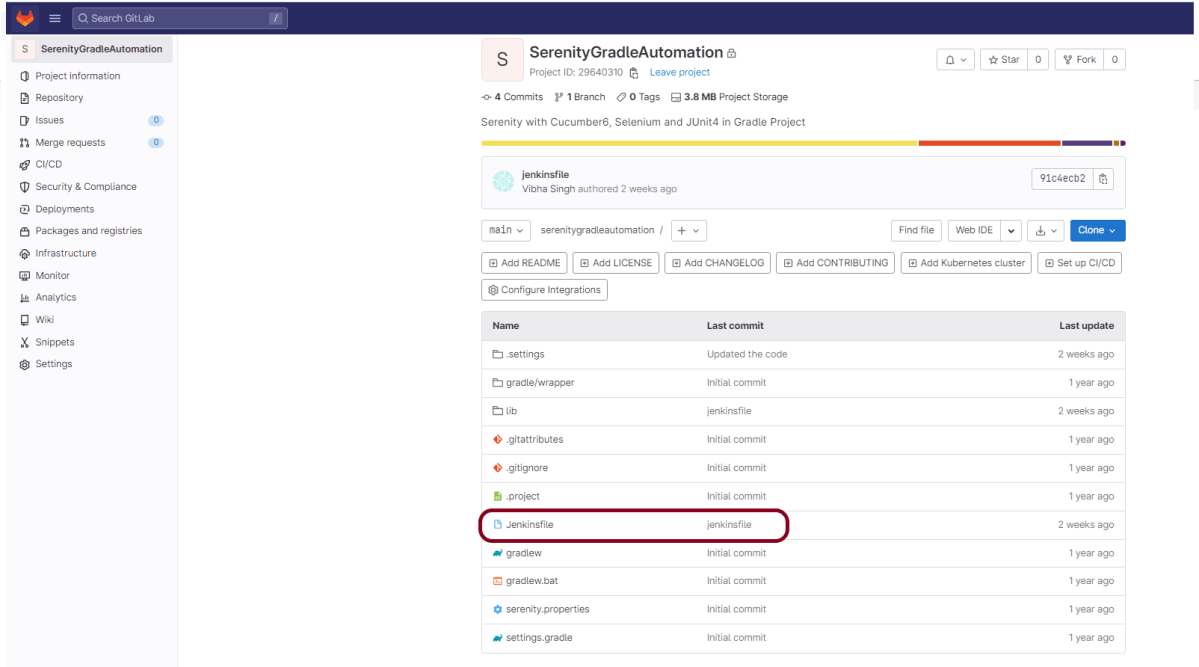
Step 3: Create Jenkinsfile
Create and save a new text file with the name Jenkinsfile at the root of the project in the GitLab repository. Here, we are using the Gradle project with Serenity. To know more about the Integration of Gradle with Serenity, please refer to this tutorial – Serenity BDD with Gradle and Cucumber for Web Application
For this tutorial, we are using Declarative syntax. The sample example is given below
pipeline {
    agent any

    stages {
        stage('Test') {
            steps {
                bat "gradle clean test"
            }

            post {
                // If Gradle was able to run the tests, even if some of the test
                // failed, record the test results and archive the jar file.
                success {
                   publishHTML([
                      allowMissing: false,
                      alwaysLinkToLastBuild: false,
                      keepAll: false,
                      reportDir: 'lib/target/site/serenity/',
                      reportFiles: 'index.html',
                      reportName: 'Serenity Report',
                      reportTitles: '',
                      useWrapperFileDirectly: true])
                }
            }
        }
    }
}
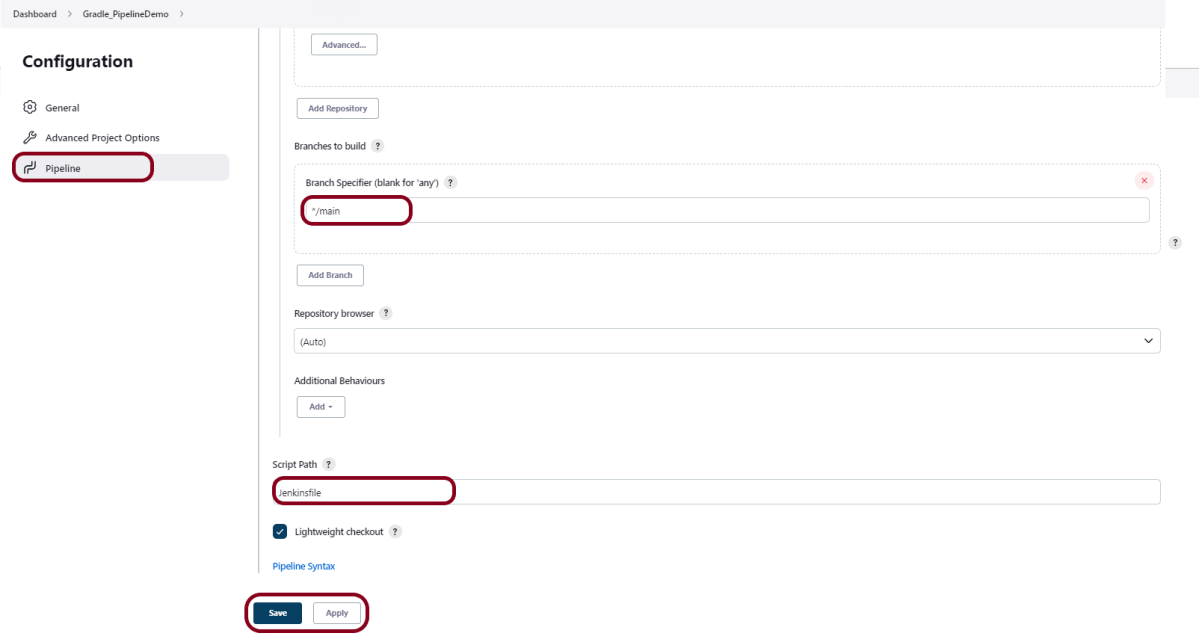
Step 4: Specify branches to build a section under Repositories
Branch Specifier – */main(This is my main branch)
ScriptPath – Jenkinsfile
Click on the Apply and Save buttons.
We have created a new Maven project “Gradle_PipelineDemo” with the configuration to run the Selenium Test with TestNG.
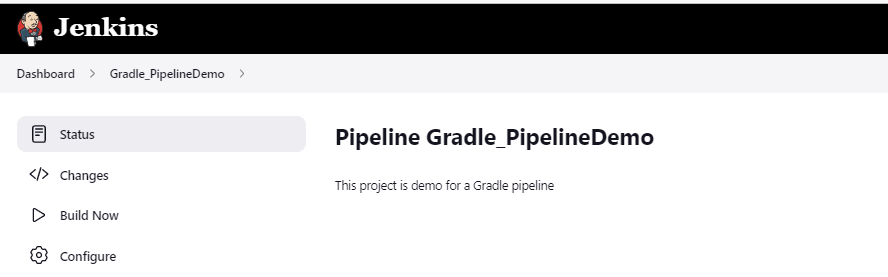
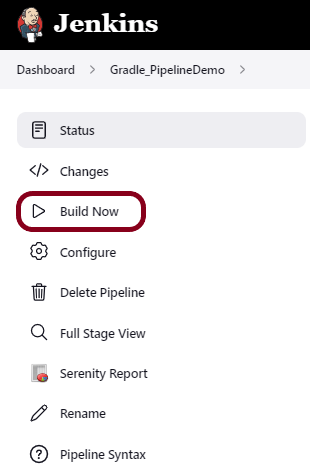
Step 5: Execute the tests
Let’s execute it now by clicking on the “Build Now” button.
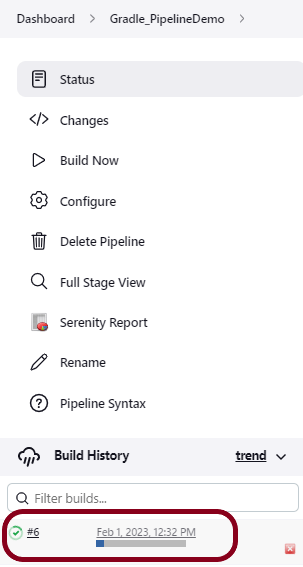
Right-click on Build Number (here in my case it is #6) and click on Console Output to see the result.
Below is the test execution summary.
Step 6: Pipeline Steps
Once the execution is completed, and we want to see the Pipeline Steps, click on the Pipeline Steps mentioned on the left side of the page.
Step 7: View the Report
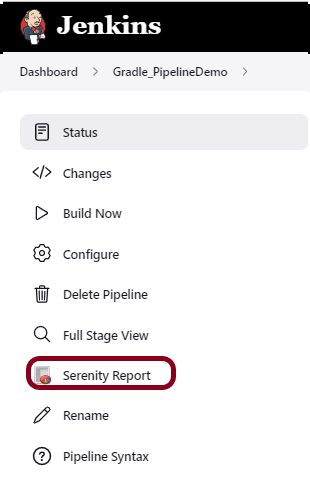
Once the execution is completed, go back to “Gradle_PipelineDemo“. We can see below that the Serenity Report is generated. To know, how to generate Serenity Report, please refer to this tutorial – How to create Jenkins pipeline for Serenity tests
We could see a link to view the “Serenity Report“. Click on theSerenity Report. It displays the Serenity Report.
Tip: If you don’t see the Report UI intact, then you need to configure a simple groovy script. For that, go to Dashboard–>Manage Jenkins–>Script Console and add the script as:
Jenkins was installed and started on the computer.
Implementation Steps
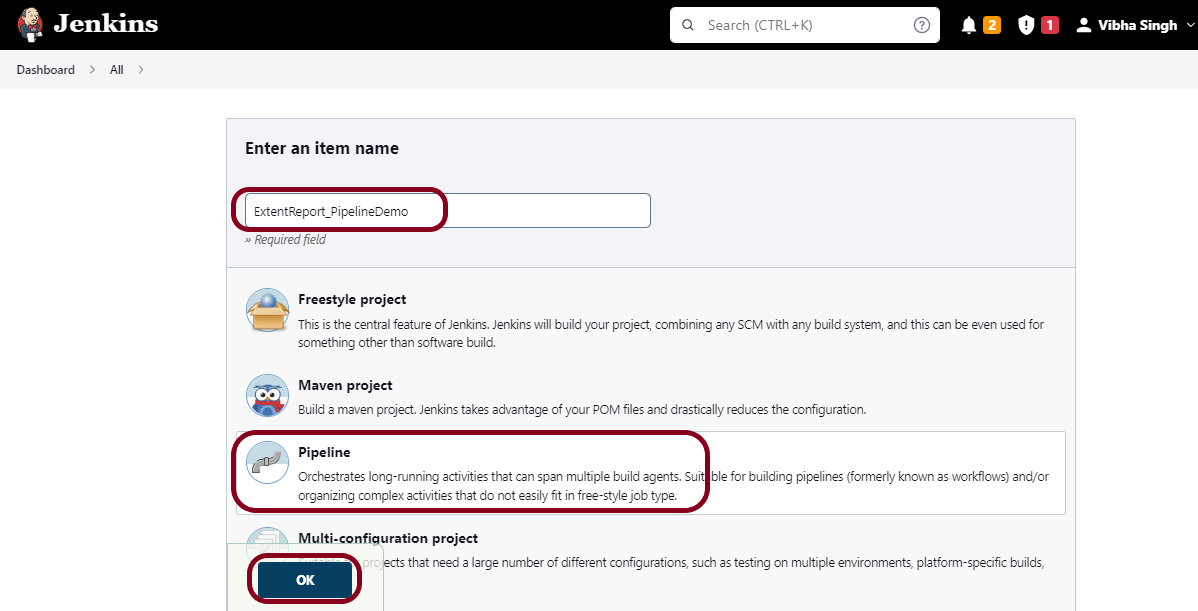
Step 1: Create a new pipeline project.
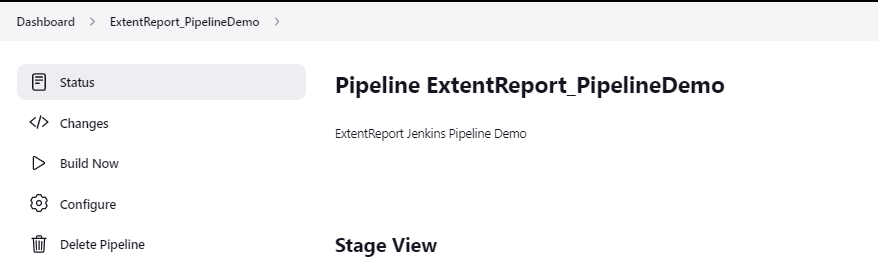
Give the Name of the project – ExtentReport_PipelineDemo
Click on the pipeline project.
Click on the OK button.
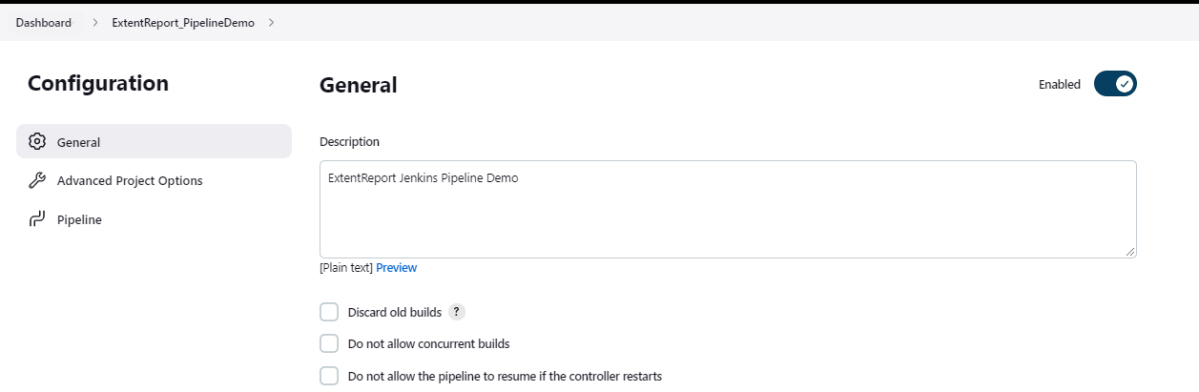
In the General section, enter the project description in the Description box.
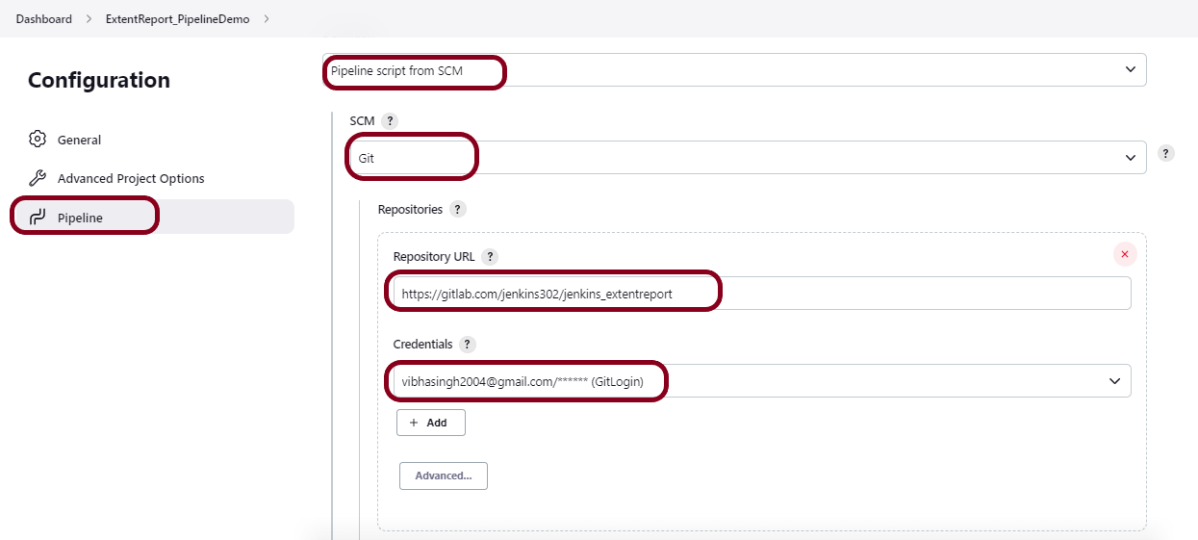
Step 2: Scroll down to Pipeline
From the Definition field, choose the “Pipeline script from SCM” option. This option instructs Jenkins to obtain your Pipeline from Source Control Management (SCM), which will be your locally cloned Git repository.
From the SCM field, choose Git.
The Repositories section contains the Repository URL and Credentials.
In the Repository URL field, specify the directory path of the GitLab/GitHub project.
In the Credentials field, specify the username and password needed to log in to GitLab/GitHub.
In this case, I have the project is present in GitLab and using it.
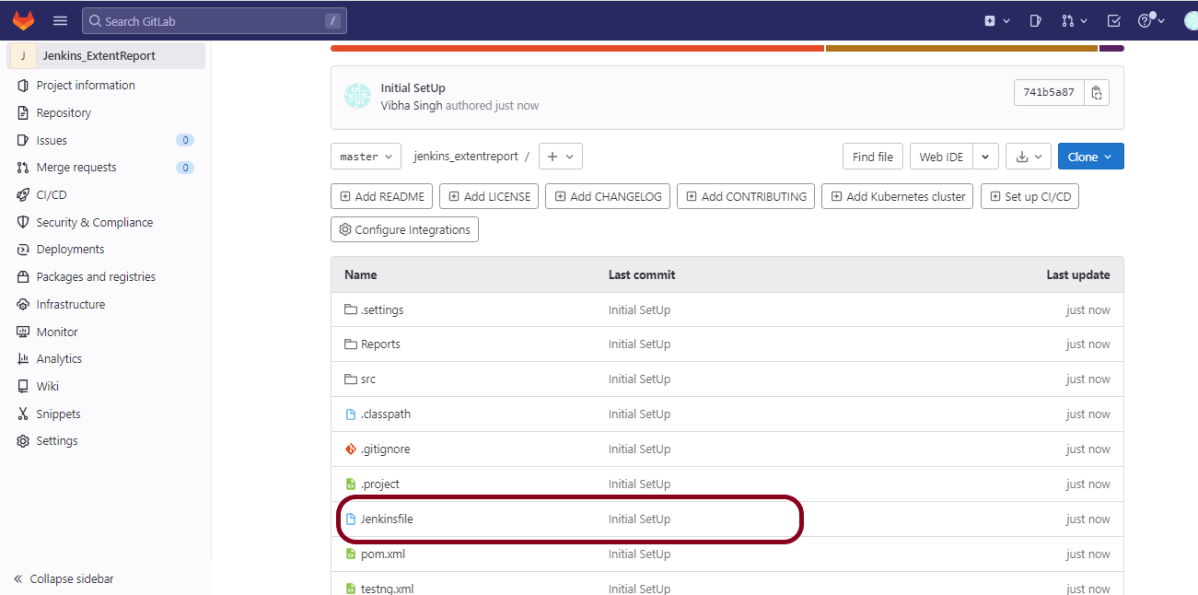
Step 3: Create Jenkinsfile
Create and save a new text file with the name Jenkinsfile at the root of the project in the GitLab repository. Here, we are using the Selenium project with TestNG. To know more about the Integration of Selenium with TestNG, please refer to this tutorial –
For this tutorial, we are using Declarative syntax. The sample example is given below:
pipeline {
    agent any

    stages {
        stage('Test') {
            steps {
                bat "mvn -D clean test"
            }

            post {

				// If Maven was able to run the tests, even if some of the test
                // failed, record the test results and archive the jar file.
				success {
                  publishHTML([
				              allowMissing: false,
				              alwaysLinkToLastBuild: false,
							  keepAll: false,
							  reportDir: 'Reports',
							  reportFiles: 'Spark.html',
							  reportName: 'ExtentReport',
							  reportTitles: '',
							  useWrapperFileDirectly: true])
				}
            }
        }
    }
}
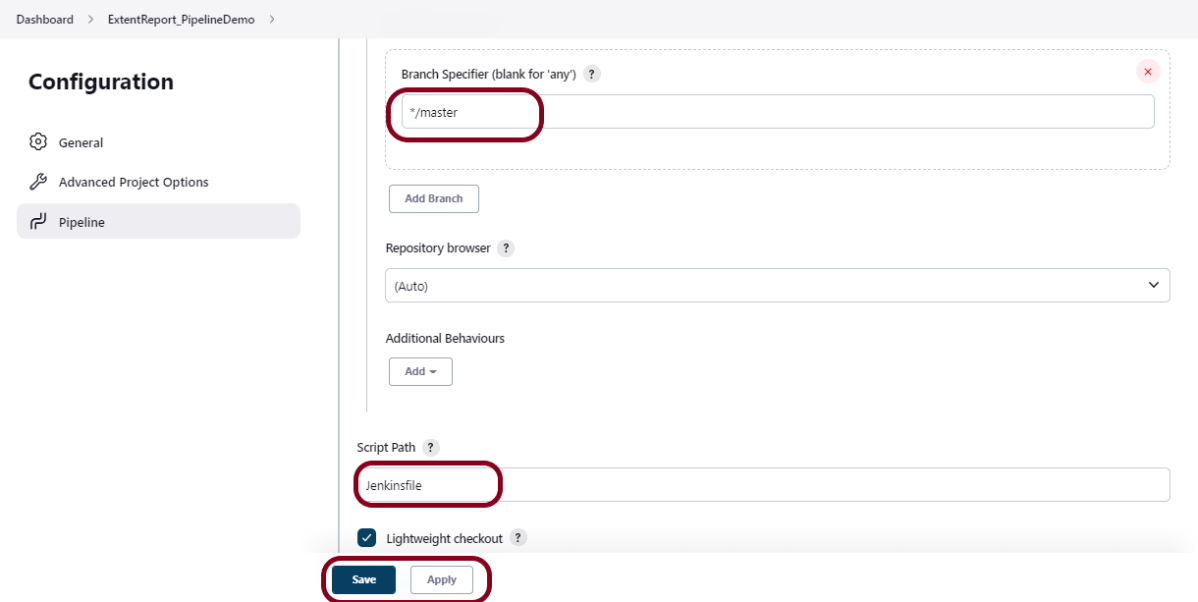
Step 4: Specify branches to build a section under Repositories
Branch Specifier – */master (This is my main branch)
ScriptPath – Jenkinsfile
Click on the Apply and Save buttons.
We have created a new Maven project “ExtentReport_PipelineDemo” with the configuration to run the Selenium Test with TestNG.
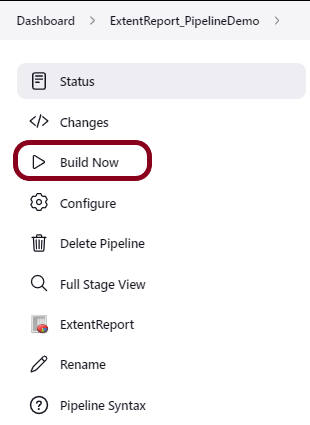
Step 5: Execute the tests
Let’s execute it now by clicking on the “Build Now” button.
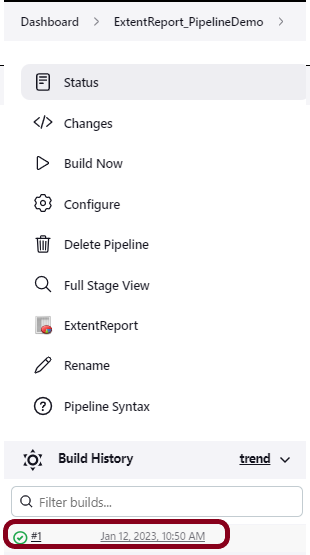
Right-click on Build Number (here in my case it is #1) and click on Console Output to see the result.
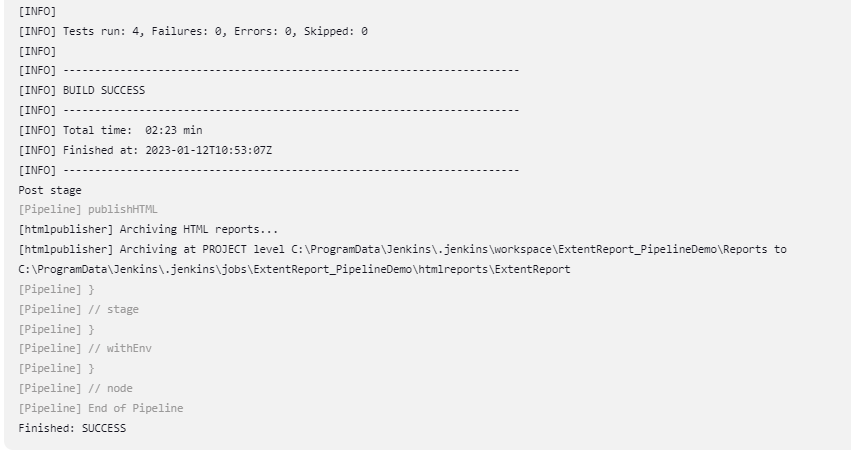
Below is the test execution summary.
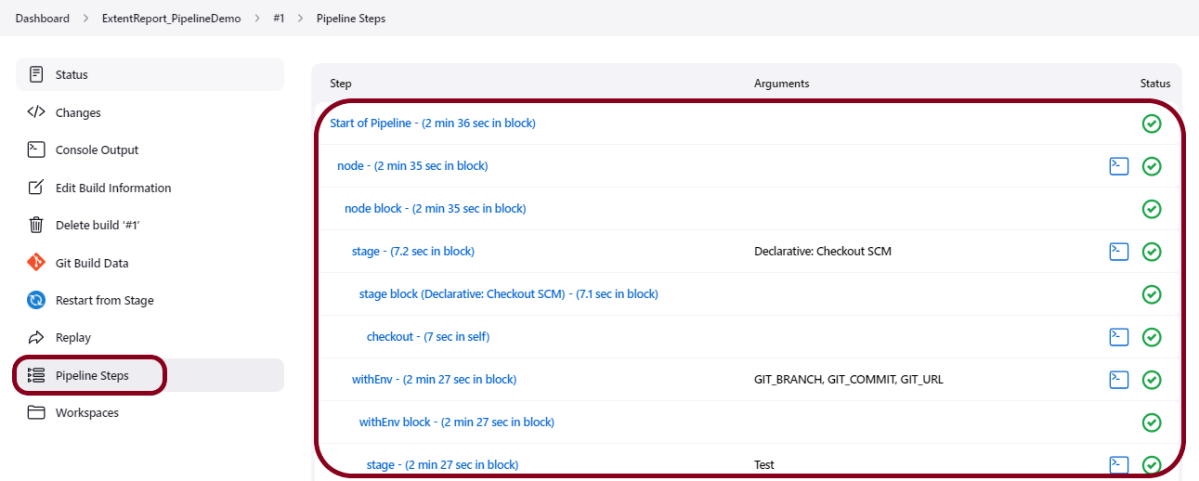
Step 6: Pipeline Steps
Once the execution is completed, and we want to see the Pipeline Steps, click on the Pipeline Steps mentioned on the left side of the page.
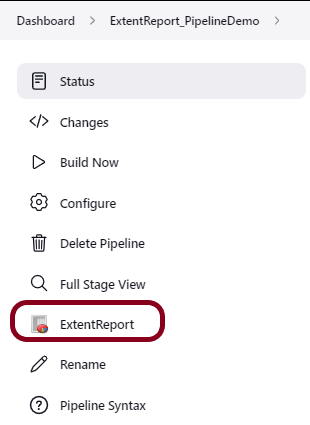
Step 7: View the Report
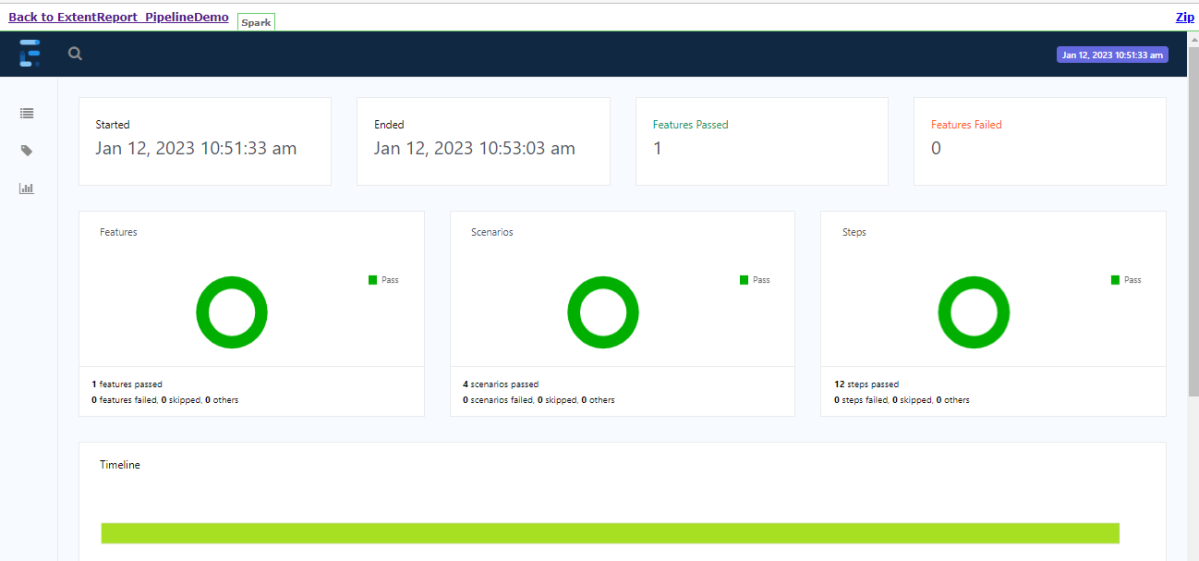
Once the execution is completed, go back to “ExtentReport_PipelineDemo“. We can see below that the ExtentReport is generated.
We could see a link to view “ExtentReport“. Click on theExtentReport. It displays the Spark.html Report.
Tip: If you don’t see the Report UI intact, then you need to configure a simple groovy script. For that, go to Dashboard–>Manage Jenkins–>Script Console and add the script as:
Jenkins was installed and started on the computer.
Implementation Steps
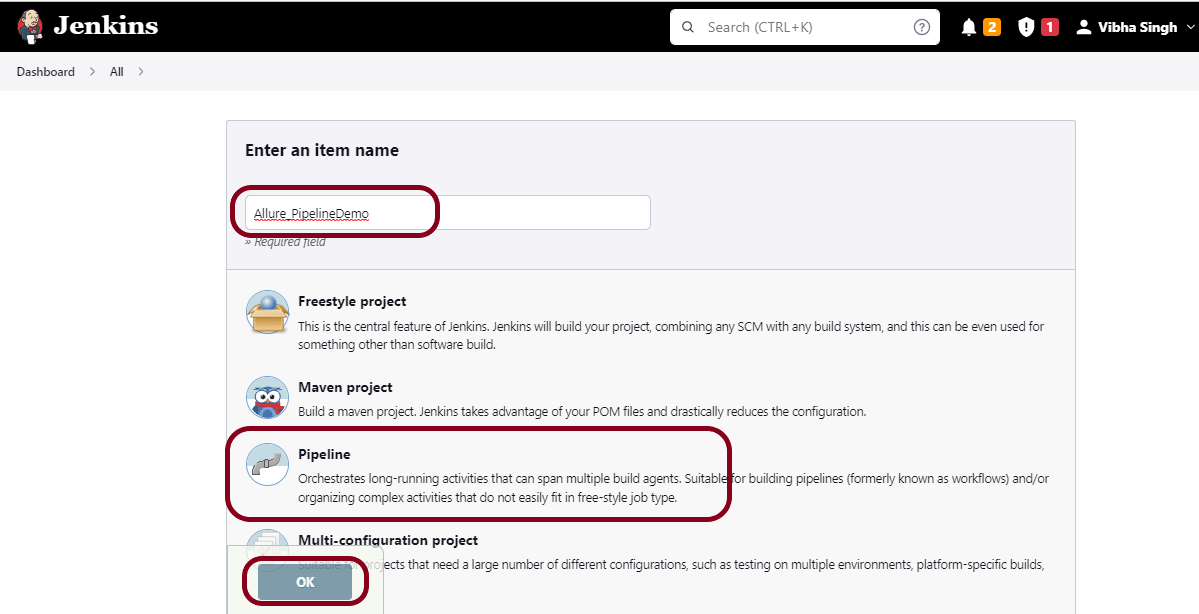
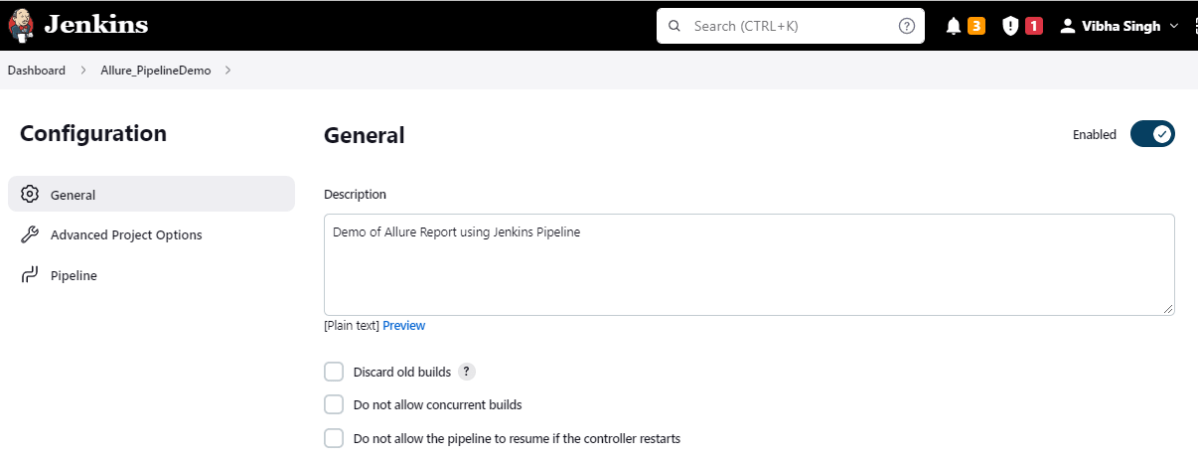
Step 1: Create a new pipeline project
Give the Name of the project – Allure_PipelineDemo
Click on the pipeline project.
Click on the OK button.
In the General section, enter the project description in the Description box.
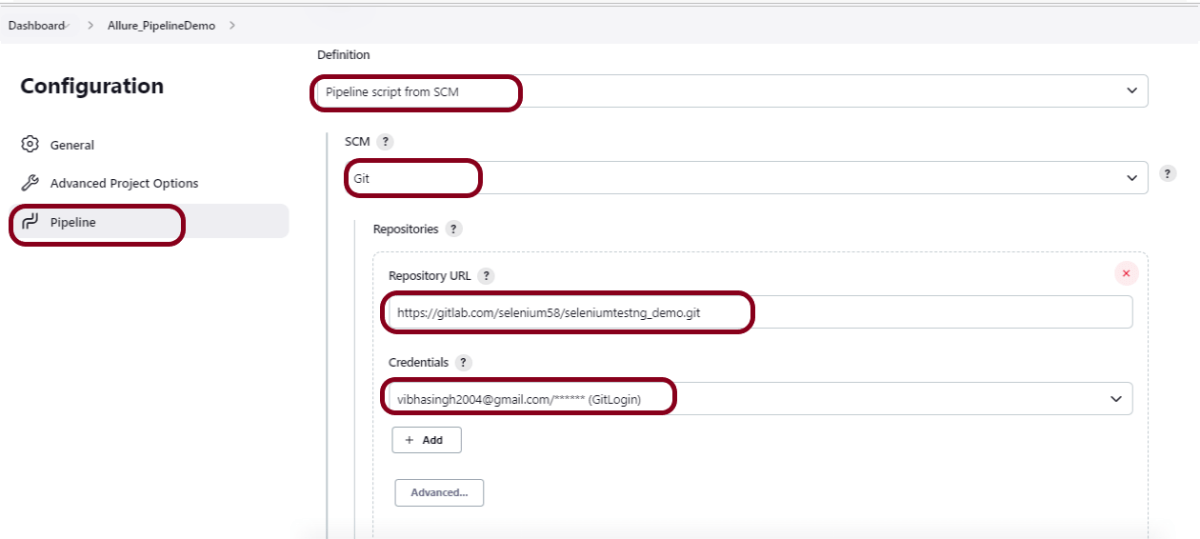
Step 2: Scroll down to Pipeline
From the Definition field, choose the “Pipeline script from SCM” option. This option instructs Jenkins to obtain your Pipeline from Source Control Management (SCM), which will be your locally cloned Git repository.
From the SCM field, choose Git.
The Repositories section contains the Repository URL and Credentials.
In the Repository URL field, specify the directory path of the GitLab/GitHub project.
In the Credentials field, specify the username and password needed to log in to GitLab/GitHub.
In this case, I have the project is present in GitLab and using it.
Step 3: Create Jenkinsfile
Create and save a new text file with the name Jenkinsfile at the root of the project in the GitLab repository. Here, we are using the Selenium project with TestNG. To know more about the Integration of Selenium with TestNG, please refer to this tutorial –
For this tutorial, we are using Declarative syntax. The sample example is given below:
pipeline {
    agent any

    stages {
        stage('Test') {
            steps {
                bat "mvn -D clean test"
            }

            post {
                // If Maven was able to run the tests, even if some of the test
                // failed, record the test results and archive the jar file.
                success { allure([
                    includeProperties: false,
                    jdk: '',
                    properties: [],
                    reportBuildPolicy: 'ALWAYS',
                    results: [[path: 'target/allure-results']]
                ])
            }
         }
    }
}
}
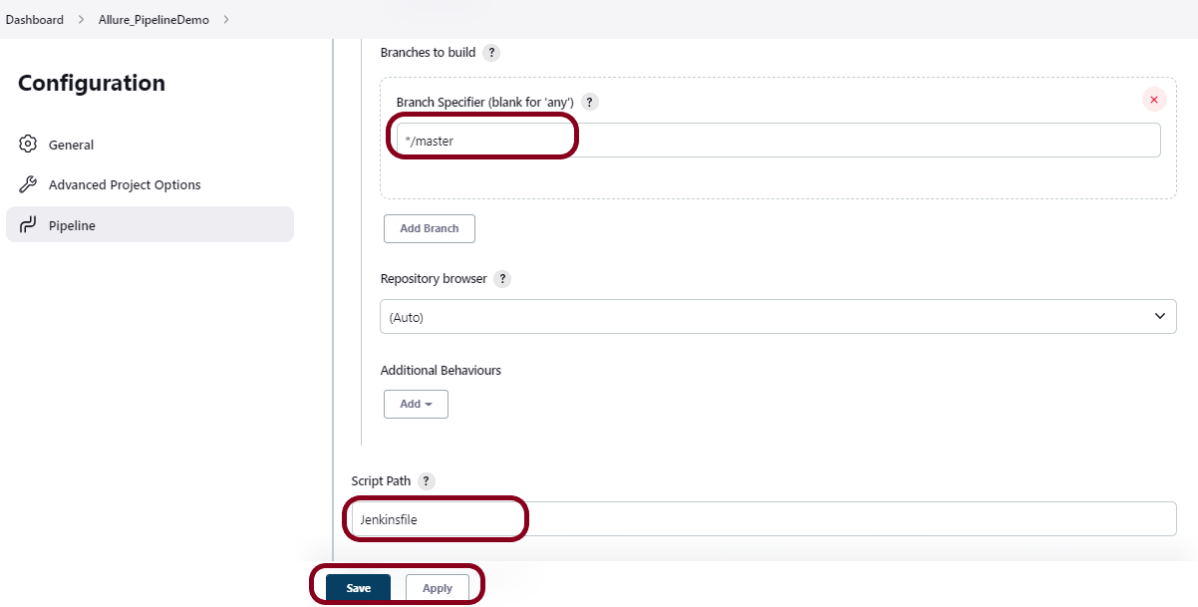
Step 4: Specify branches to build a section under Repositories
Branch Specifier – */master (This is my main branch)
ScriptPath – Jenkinsfile
Click on the Apply and Save buttons.
We have created a new Maven project “AllurePipelineDemo” with the configuration to run the Selenium Test with TestNG.
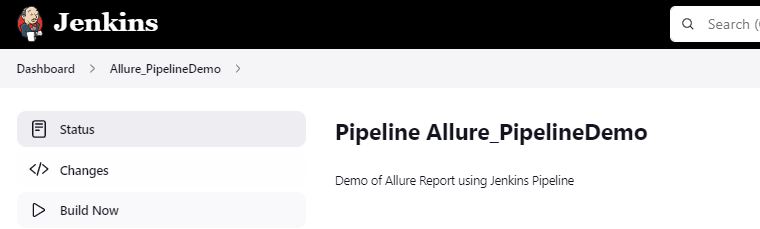
Step 5: Execute the tests
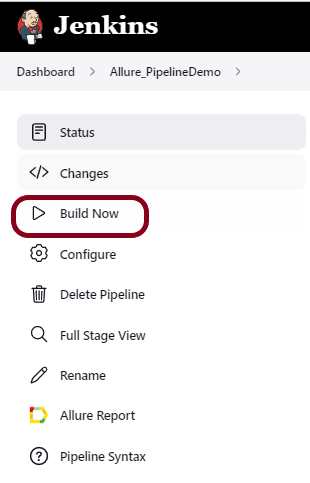
Let’s execute it now by clicking on the “Build Now” button.
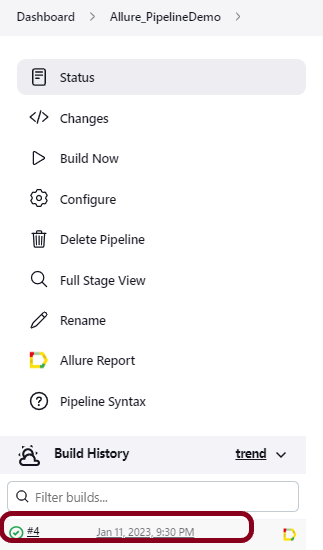
Right-click on Build Number (here in my case it is #4) and click on Console Output to see the result.
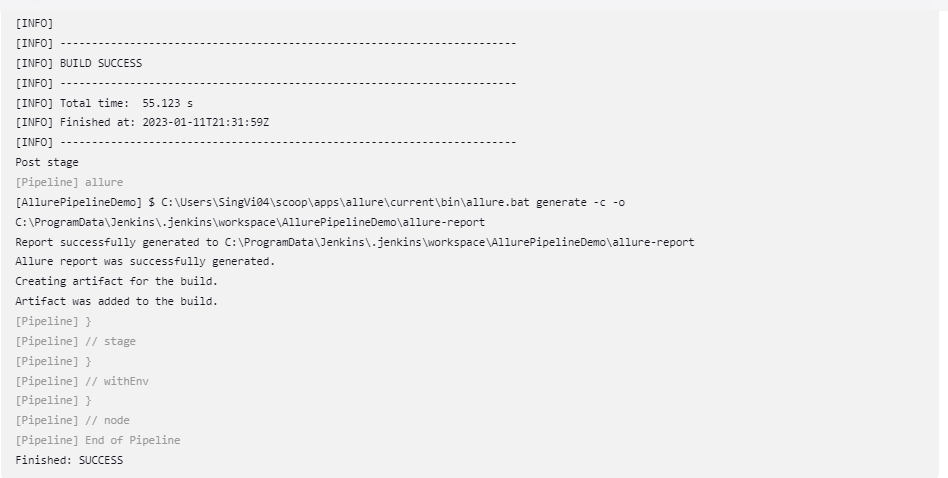
Below is the test execution summary.
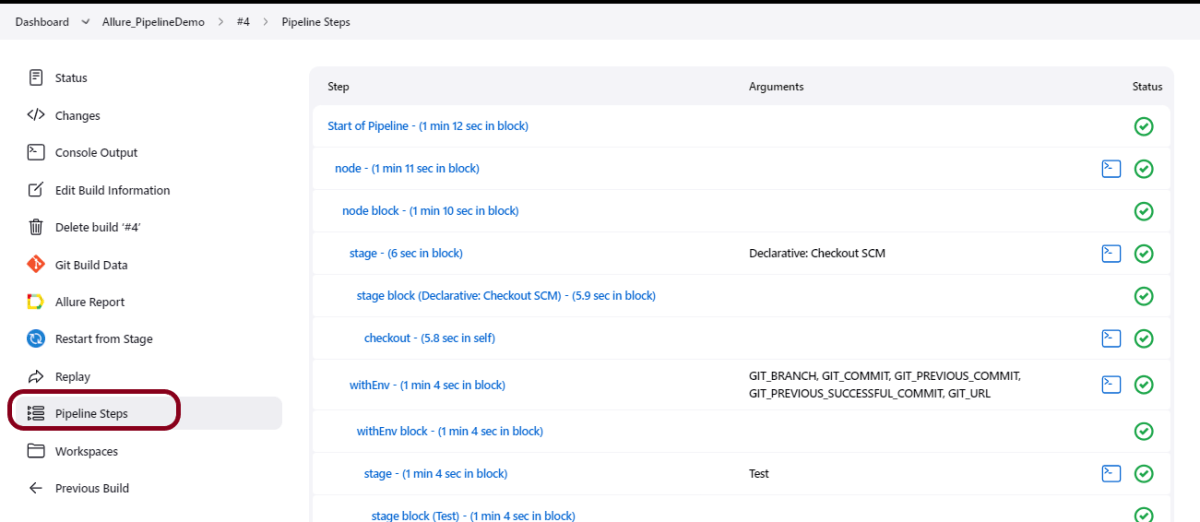
Step 6: Pipeline Steps
Once the execution is completed, and we want to see the Pipeline Steps, click on the Pipeline Steps mentioned on the left side of the page.
Step 7: View the Report
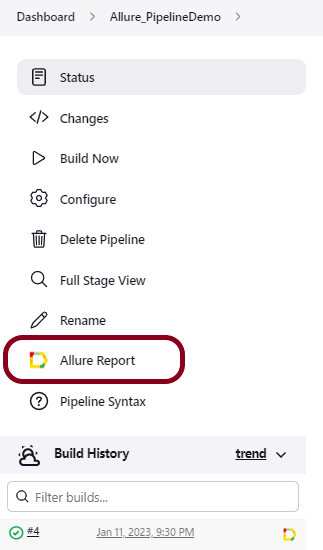
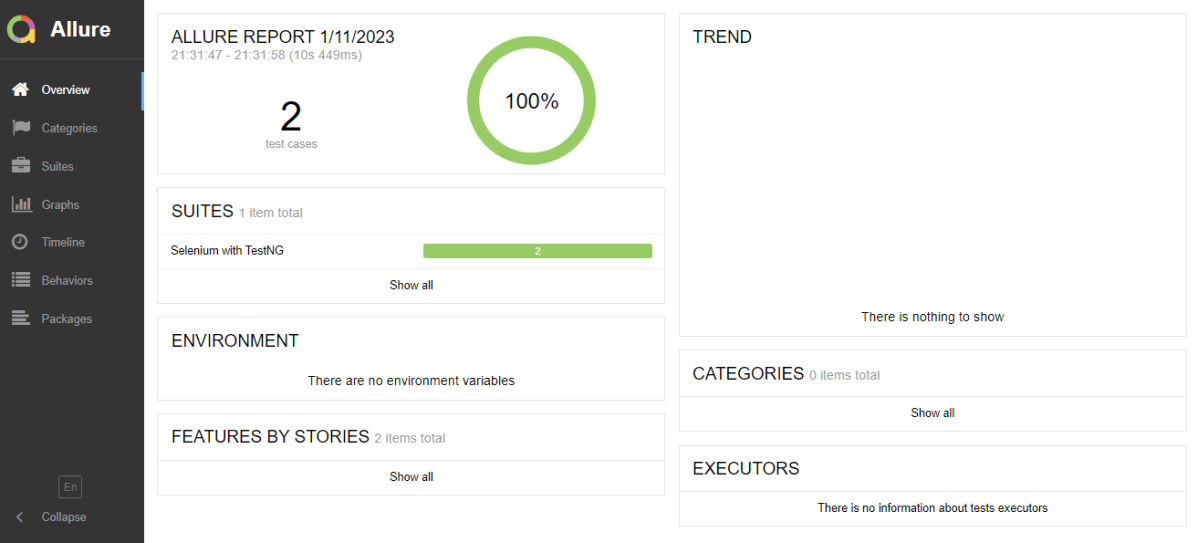
Once the execution is completed, go back to “Allure_PipelineDemo”. We can see below that the Allure Report is generated.
We could see a link to view the ‘Allure Report’. Click on the Allure Report. It displays the Report.
Tip: If you don’t see the Report UI intact, then you need to configure a simple groovy script. For that, go to Dashboard–>Manage Jenkins–>Script Console and add the script as:
Jenkins was installed and started on the computer.
To generate Cucumber Report in Jenkins, we need to download HTML Publisher. Please refer to this tutorial to install the plugin – How to install Plugins in Jenkins
Implementation Steps
Step 1: Create a new pipeline project
Give the Name of the project – Cucumber_PipelineDemo
Click on the pipeline project.
Click on the OK button.
In the General section, enter the project description in the Description box.
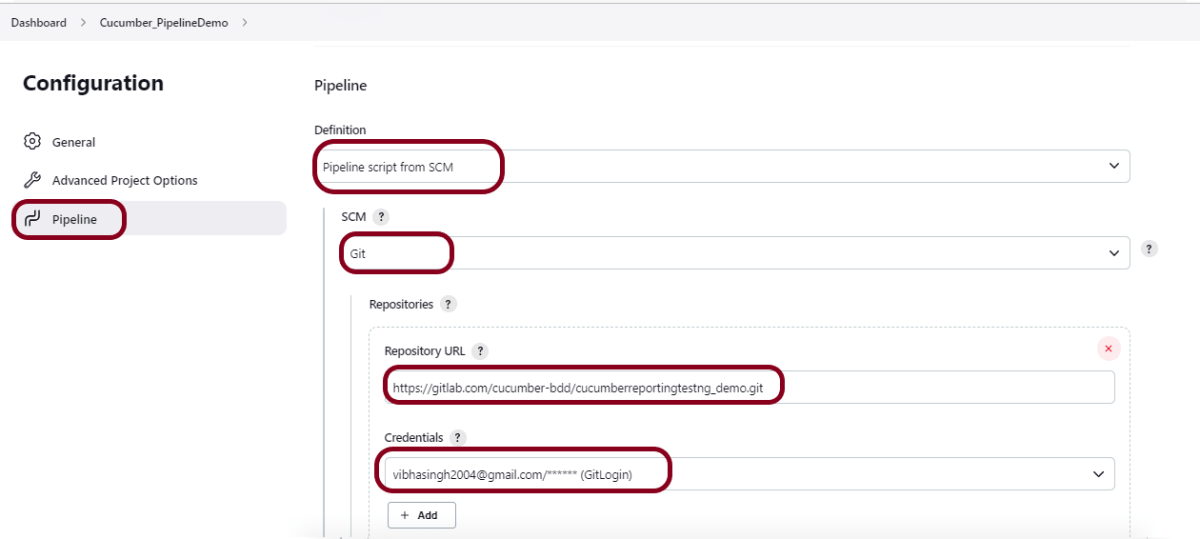
Step 2: Scroll down to Pipeline
From the Definition field, choose the “Pipeline script from SCM” option. This option instructs Jenkins to obtain your Pipeline from Source Control Management (SCM), which will be your locally cloned Git repository.
From the SCM field, choose Git.
The Repositories section contains the Repository URL and Credentials.
In the Repository URL field, specify the directory path of the GitLab/GitHub project.
In the Credentials field, specify the username and password needed to log in to GitLab/GitHub.
In this case, I have the project is present in GitLab and using it.
Step 3: Create Jenkinsfile
Create and save a new text file with the name Jenkinsfile at the root of the project in the GitLab repository. Here, we are using the Cucumber project with Selenium and TestNG. To know more about the Integration of Cucumber with Serenity and TestNG, please refer to this tutorial – Implemention of ‘Masterthought’ Reports in Cucumber with TestNG.
For this tutorial, we are using Declarative syntax. The sample example is given below:
pipeline {
    agent any

    stages {
        stage('Test') {
            steps {

                // To run Maven on a Windows agent, use
                bat "mvn -D clean test"
            }

            post {

                // If Maven was able to run the tests, even if some of the test
                // failed, record the test results and archive the jar file.
                success {
                        cucumber buildStatus: 'null',
                        customCssFiles: '',
                        customJsFiles: '',
                        failedFeaturesNumber: -1,
                        failedScenariosNumber: -1,
                        failedStepsNumber: -1,
                        fileIncludePattern: '**/*.json',
                        pendingStepsNumber: -1,
                        skippedStepsNumber: -1,
                        sortingMethod: 'ALPHABETICAL',
                        undefinedStepsNumber: -1
                }
            }
        }
    }
}
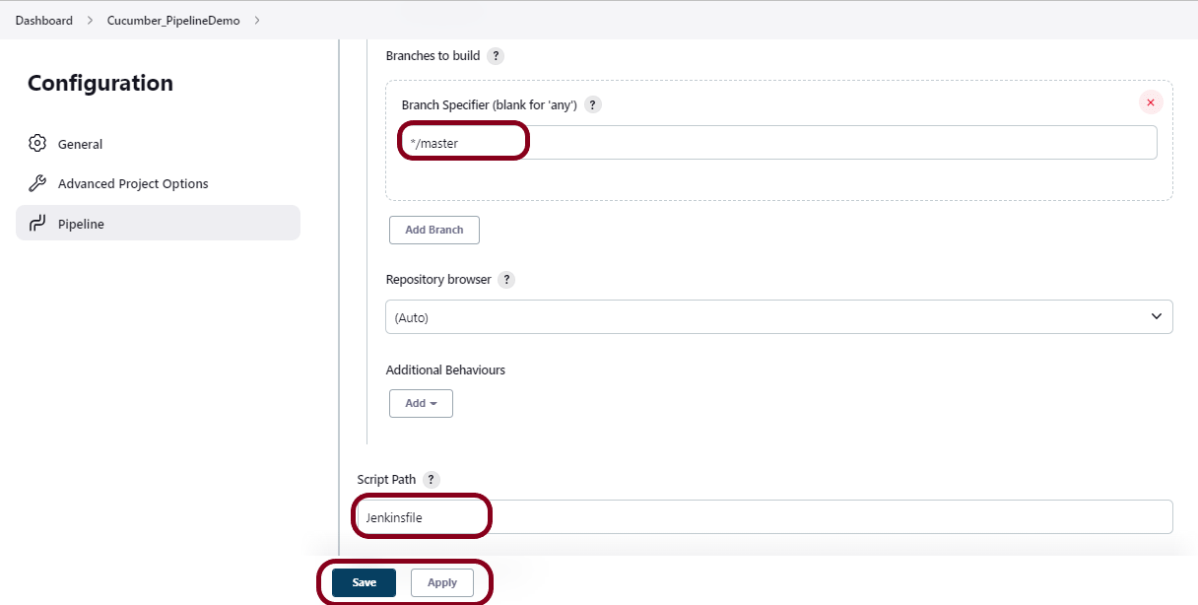
Step 4: Specify branches to build a section under Repositories
Branch Specifier – */master (This is my main branch)
ScriptPath – Jenkinsfile
Click on the Apply and Save buttons.
We have created a new Maven project “Cucumber_PipelineDemo” with the configuration to run the Cucumber Tests with TestNG.
Step 5: Execute the tests
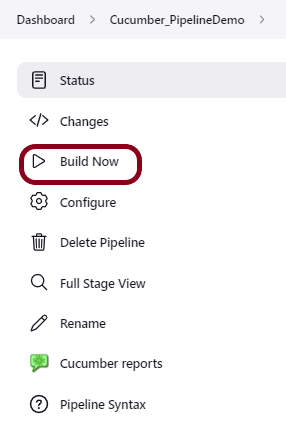
Let’s execute it now by clicking on the “Build Now” button.
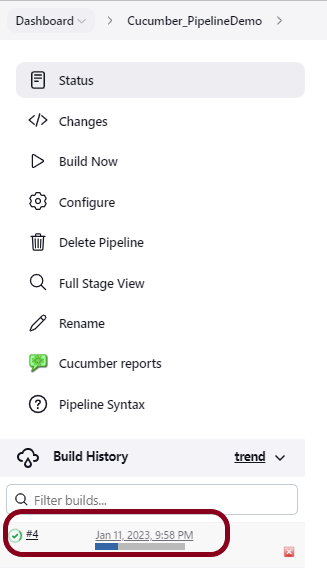
Right-click on Build Number (here in my case it is #4) and click on Console Output to see the result.
Below is the test execution summary.
Step 6: Pipeline Steps
Once the execution is completed, and we want to see the Pipeline Steps, click on the Pipeline Steps mentioned on the left side of the page.
Step 7: View the Report
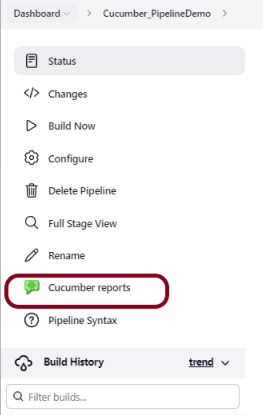
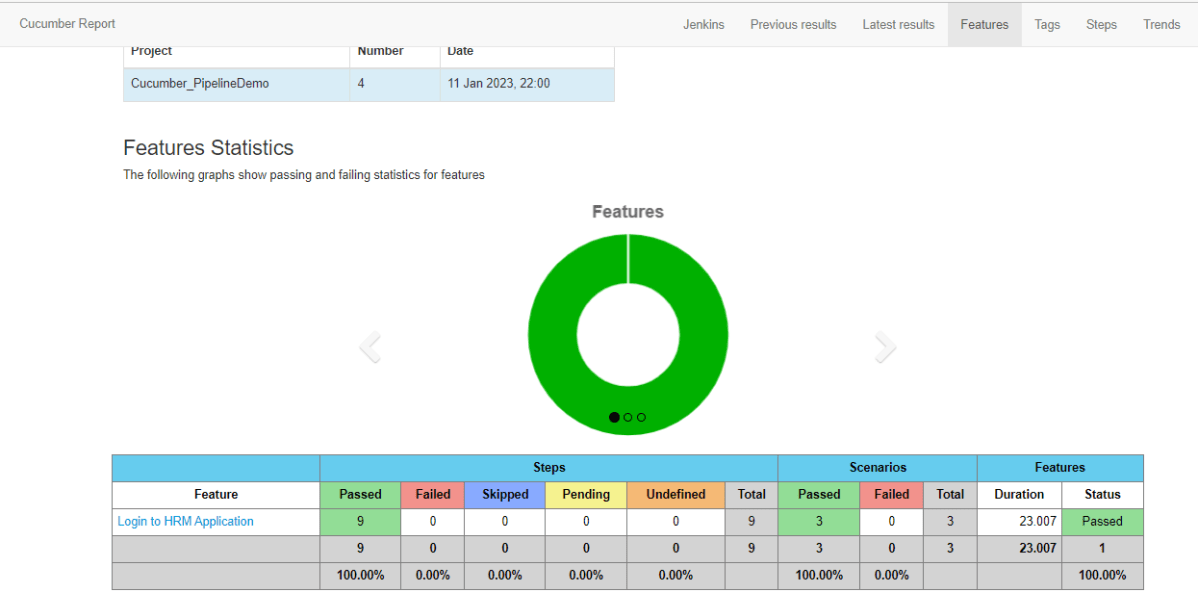
Once the execution is completed, go back to “Cucumber_PipelineDemo”. We can see below that the Cucumber report is generated.
We could see a link to view the “Cucumber Report“. Click on the Cucumber Report. It displays the Report.
Tip: If you don’t see the Report UI intact, then you need to configure a simple groovy script. For that, go to Dashboard–>Manage Jenkins–>Script Console and add the script as:
Jenkins was installed and started on the computer.
To generate Serenity Report in Jenkins, we need to download HTML Publisher. Please refer to this tutorial to install the plugin – How to install Plugins in Jenkins.
Implementation Steps
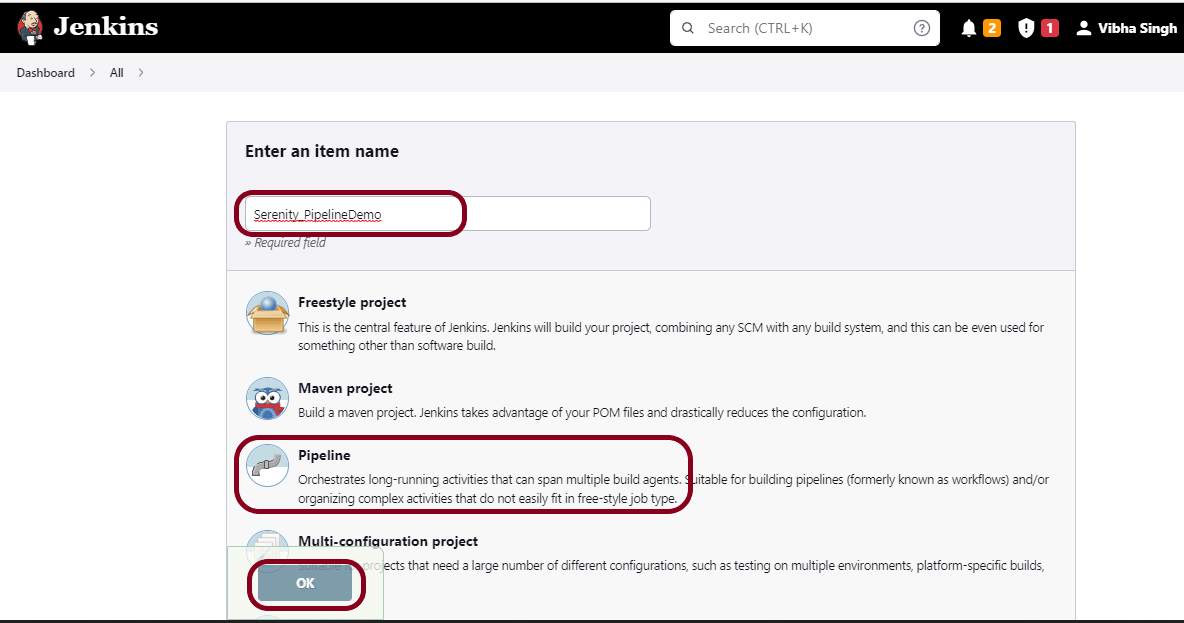
Step 1: Create a new pipeline project
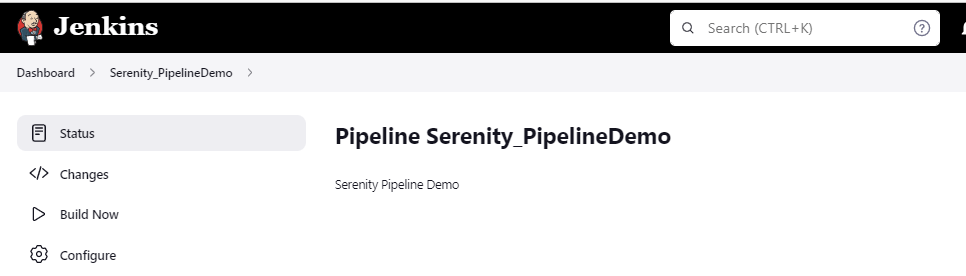
Give the Name of the project – Serenity_PipelineDemo
Click on the pipeline project.
Click on the OK button.
In the General section, enter the project description in the Description box.
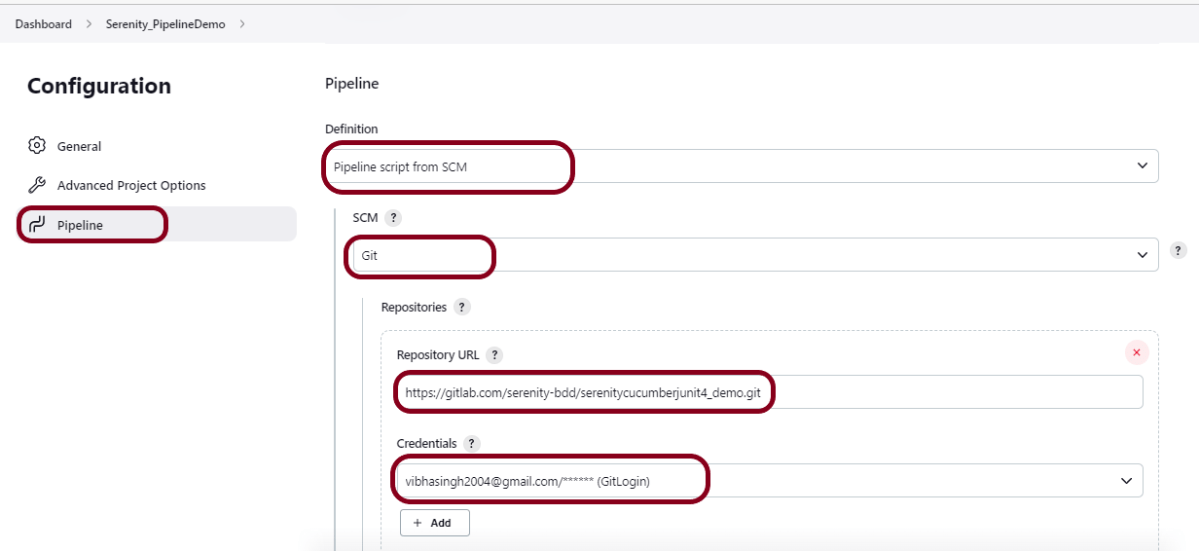
Step 2: Scroll down to Pipeline
From the Definition field, choose the “Pipeline script from SCM” option. This option instructs Jenkins to obtain your Pipeline from Source Control Management (SCM), which will be your locally cloned Git repository.
From the SCM field, choose Git.
The Repositories section contains the Repository URL and Credentials.
In the Repository URL field, specify the directory path of the GitLab/GitHub project.
In the Credentials field, specify the username and password needed to log in to GitLab/GitHub.
In this case, I have the project is present in GitLab and using it.
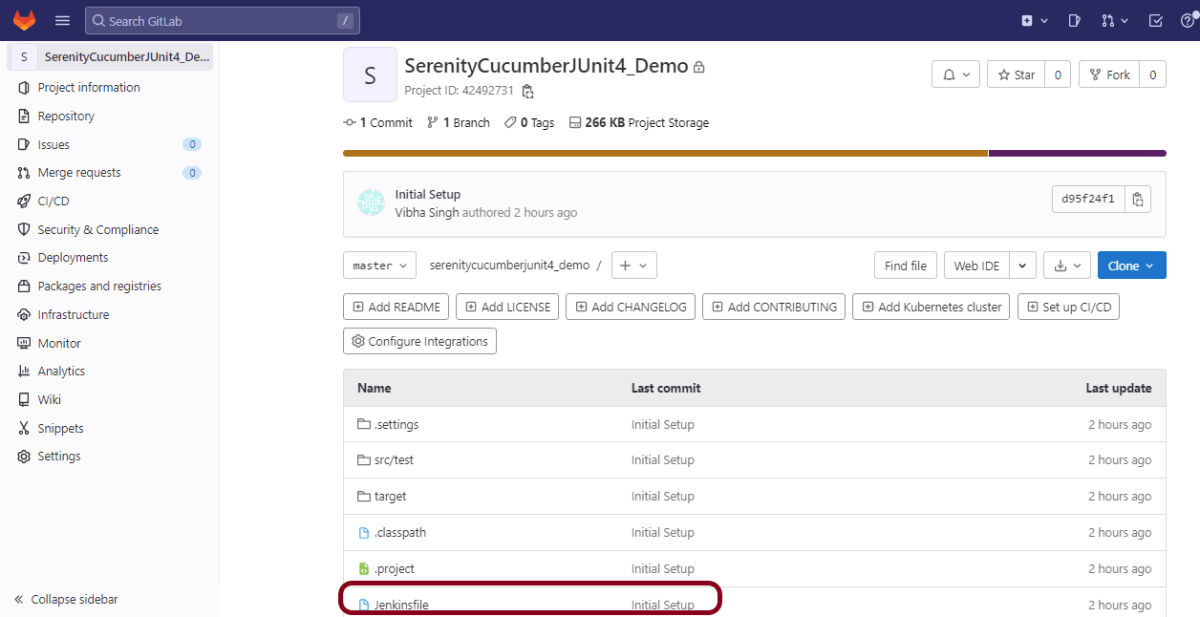
Step 3: Create Jenkinsfile
Create and save a new text file with the name Jenkinsfile at the root of the project in the GitLab repository. Here, we are using the Selenium project with TestNG. To know more about the Integration of Serenity with TestNG, please refer to this tutorial – Testing of Web Application using Serenity with JUnit4.
For this tutorial, we are using Declarative syntax. The sample example is given below:
pipeline {
    agent any

    stages {
        stage('Test') {
            steps {
                bat "mvn -D clean verify"
            }

            post {
                // If Maven was able to run the tests, even if some of the test
                // failed, record the test results and archive the jar file.
                success {
                   publishHTML([allowMissing: false, alwaysLinkToLastBuild: false, keepAll: false, reportDir: 'target/site/serenity/', reportFiles: 'index.html', reportName: 'Serenity Report', reportTitles: '', useWrapperFileDirectly: true])
				}
            }
        }
    }
}
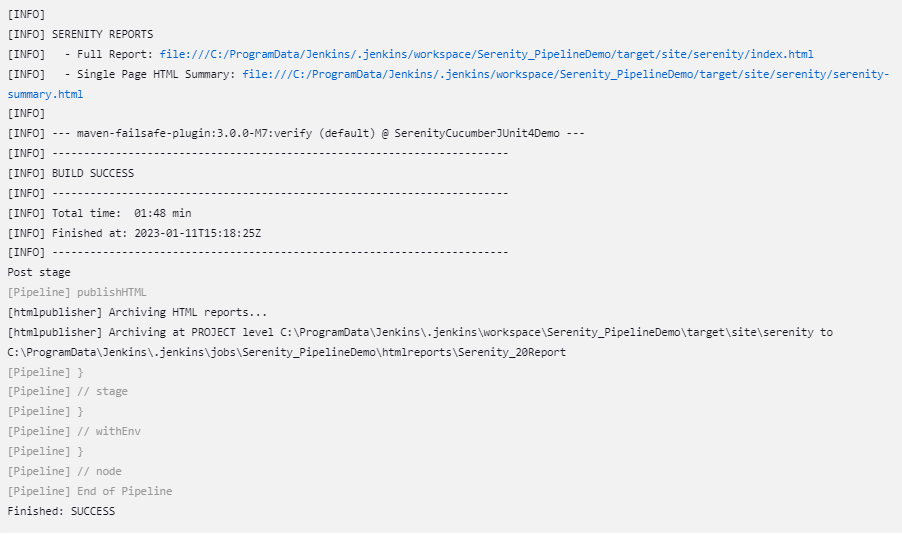
We are publishing index.html, so it is mentioned as reportFiles and it is present in Directory – target/site/serenity.
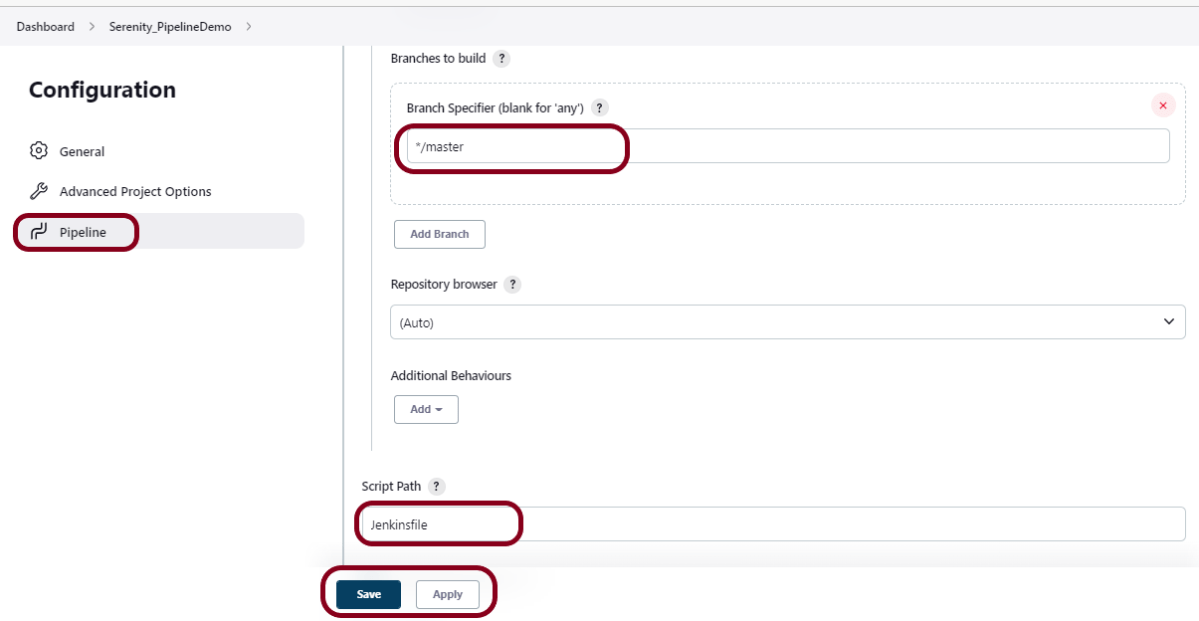
Step 4: Specify branches to build a section under Repositories
Branch Specifier – */master (This is my main branch)
ScriptPath – Jenkinsfile
Click on the Apply and Save buttons.
We have created a new Maven project “Serenity_PipelineDemo” with the configuration to run the Serenity Tests with JUnit4.
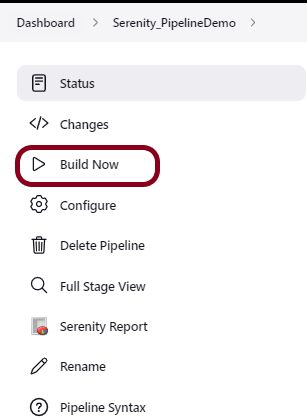
Step 5: Execute the tests
Let’s execute it now by clicking on the “Build Now” button.
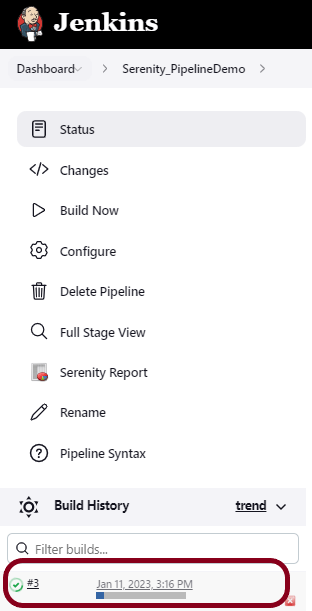
Right-click on Build Number (here in my case it is #3) and click on Console Output to see the result.
Below is the test execution summary.
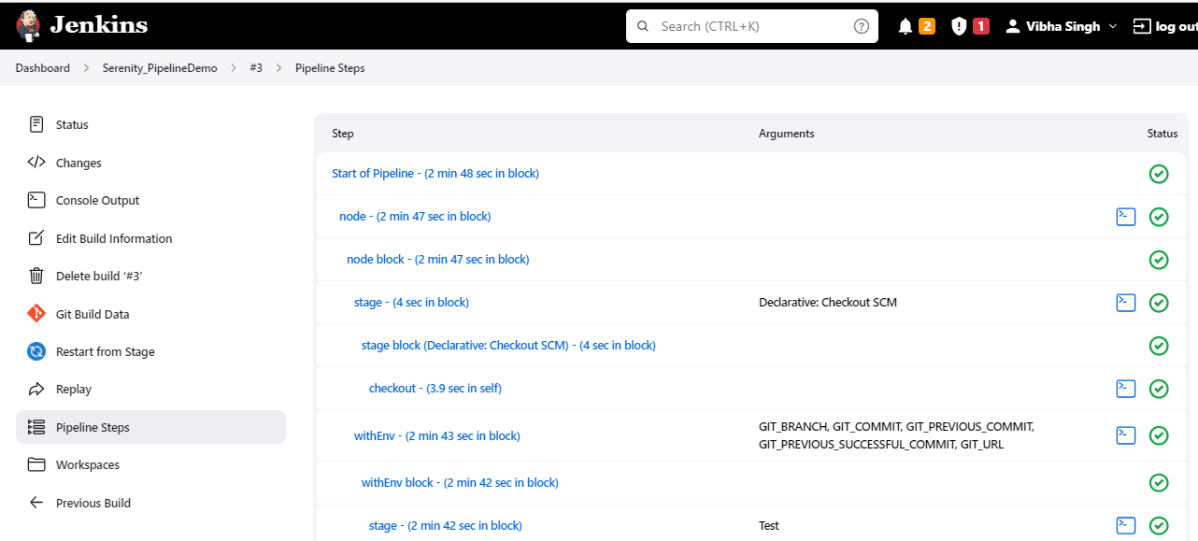
Step 6: Pipeline Steps
Once the execution is completed, and we want to see the Pipeline Steps, click on the Pipeline Steps mentioned on the left side of the page.
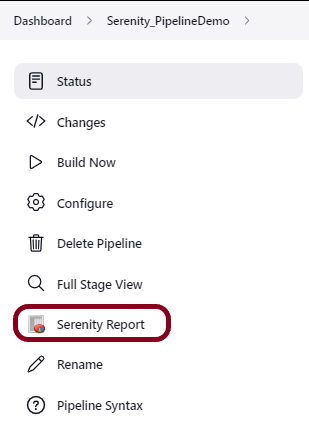
Step 7: View the Report
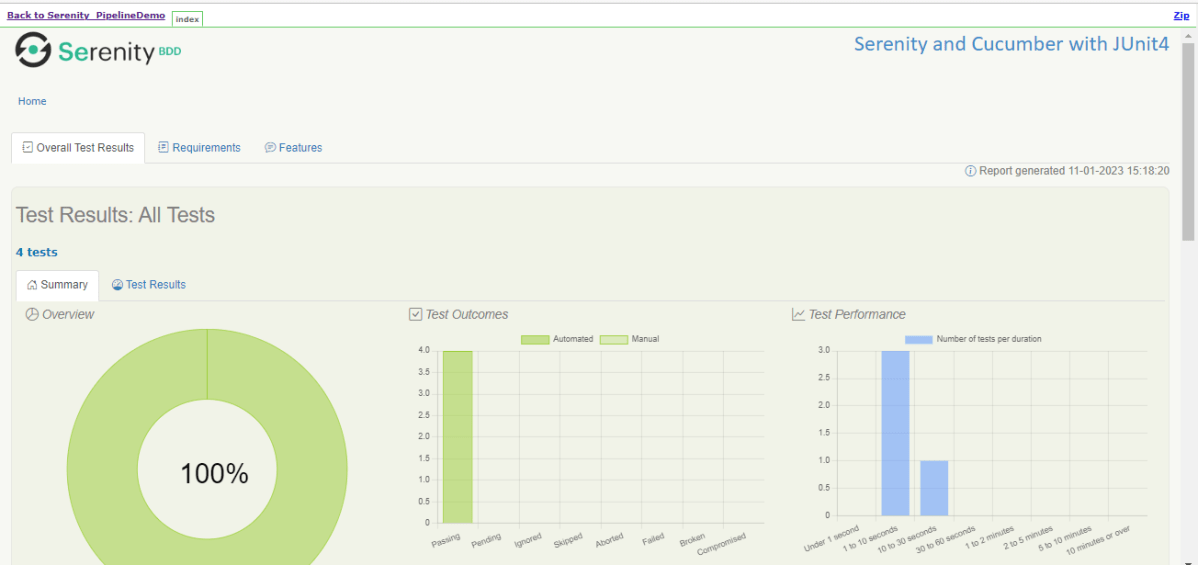
Once the execution is completed, go back to “Serenity_PipelineDemo”. We can see below that the Serenity Report is generated.
We could see a link to view the “Serenity Report“. Click on the Serenity Report. It displays the index.html Report.
Tip: If you don’t see the Report UI intact, then you need to configure a simple groovy script. For that, go to Dashboard–>Manage Jenkins–>Script Console and add the script as:
Jenkins Pipeline (or simply “Pipeline”) is a suite of plugins that supports implementing and integrating continuous delivery pipelines into Jenkins.
Jenkins Pipeline provides an extensible set of tools for modeling simple-to-complex delivery pipelines “as code”. The definition of a Jenkins Pipeline is typically written into a text file (called a Jenkinsfile) which in turn is checked into a project’s source control repository.
Creating a Jenkinsfile and committing it to source control provides a number of immediate benefits:
Automatically creates a Pipeline build process for all branches and pull requests.
Code review/iteration on the Pipeline (along with the remaining source code).
Audit trail for the Pipeline.
Single source of truth for the Pipeline, which can be viewed and edited by multiple members of the project.
Why do we need Jenkins pipeline?
Code: Pipelines are implemented in code and typically checked into source control, giving teams the ability to edit, review, and iterate upon their delivery pipeline.
Durable: Pipelines can survive both planned and unplanned restarts of the Jenkins controller.
Pausable: Pipelines can optionally stop and wait for human input or approval before continuing the Pipeline run.
Versatile: Pipelines support complex real-world CD requirements, including the ability to fork/join, loop, and perform work in parallel.
Extensible: The Pipeline plugin supports custom extensions to its DSL and multiple options for integration with other plugins.
Jenkins Pipeline Concepts
Pipeline A Pipeline is a user-defined model of a CD pipeline. A Pipeline’s code defines your entire build process, which typically includes stages for building an application, testing it, and then delivering it.
Node A node is a machine that is part of the Jenkins environment and is capable of executing a Pipeline.
Stage A stage block defines a subset of tasks performed through the entire Pipeline (e.g. “Build”, “Test” and “Deploy” stages), which is used by many plugins to visualize or present Jenkins Pipeline status/progress.
Step A step tells Jenkins what to do at a particular point in time (or “step” in the process). For example, to execute the shell command make use the sh step: sh 'make'. When a plugin extends the Pipeline DSL, [1] that typically means the plugin has implemented a new step.
Jenkins supports two different syntaxes.
Declarative
Scripted
Declarative
Declarative pipeline syntax simplifies pipeline construction. It comes with a predefined hierarchy for creating Jenkins pipelines. It gives you simple and straightforward control over all aspects of pipeline execution.
Scripted
A lightweight executor is used to run a scripted Jenkins pipeline on the Jenkins master. It uses minimal resources to convert the pipeline into atomic commands. Declarative and scripted syntax are distinct and are defined in entirely different ways.
The following example shows a Declarative pipeline with 2 stages:
pipeline {
    agent any

    stages {
        stage('Build ') {
            steps {
                echo 'Building the project...'
            }
        }

        stage('Test') {
            steps {
                echo 'Testing the project...'
            }
        }
    }
}
We have got some ideas about Jenkins Pipeline.
Congratulations on making it through this tutorial and hope you found it useful! Happy Learning!! Cheers!!