Jenkins is a self-contained, open-source automation server that can be used to automate all sorts of tasks related to building, testing, and delivering or deploying software.
Jenkins can be installed through native system packages, Docker, or even run standalone by any machine with a Java Runtime Environment (JRE) installed.
How to install the trends-related plugin in Jenkins?
To see overall trends in Jenkins, there are plugins available to gather information from within the builds and Jenkins and display them in a graphical format. One example of such a plugin is the ‘global-build-stats plugin’. So let’s go through the steps for this.
Provide a username and password and click on the Sign-in Button.
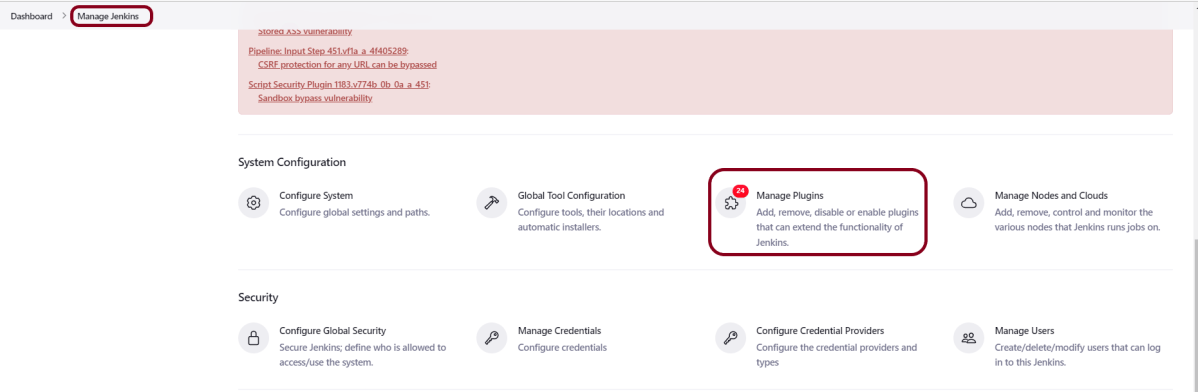
Step 3: Go to Manage Plugins
Click on the Manage Jenkins. Choose Manage Plugins.
Step 4: Add the global-build-stats plugin
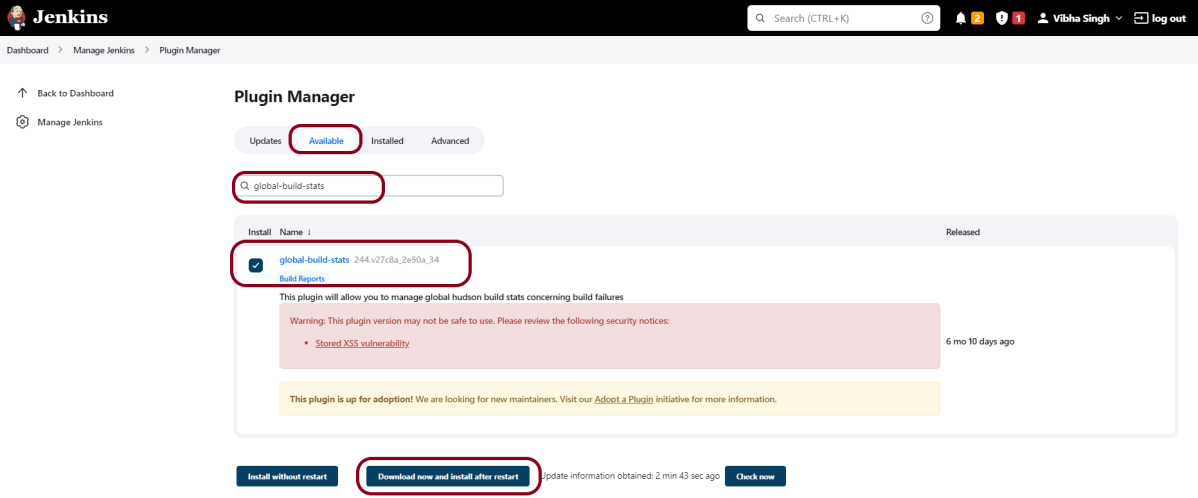
On the Plugins Page, go to the Available option.
Select the “global-build-stats” Plugin
Click on “Install without restart”.The plugin will take a few moments to finish downloading depending on your internet connection, and will be installed automatically.
You can also select the option “Download now and Install after the restart” button. In which plugin is installed after the restart
You will be shown a “No updates available” message if you already have the TestNG Report plugin installed.
Click on the checkbox “Restart Jenkins when installation is complete when no jobs are running“.
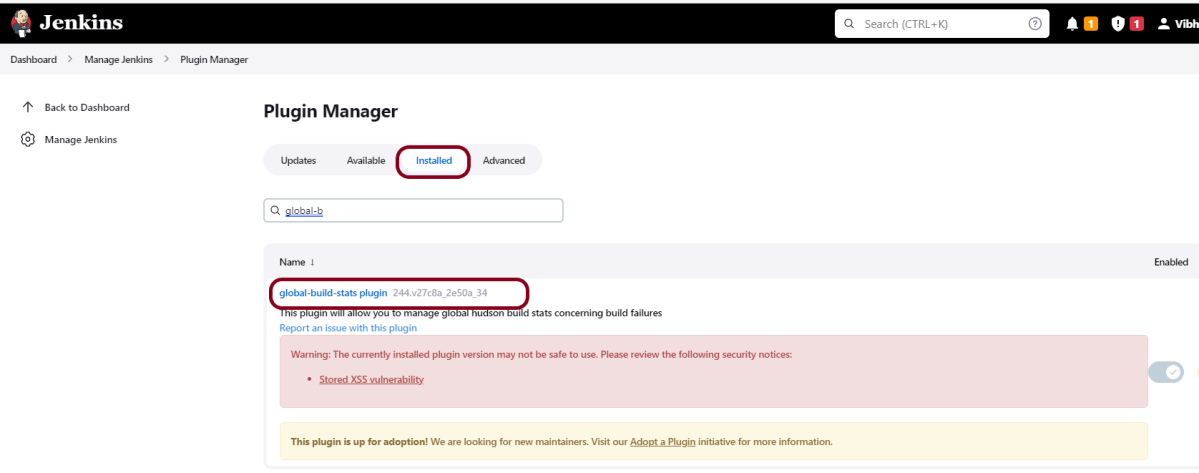
Step 5: Verify the global-build-stats plugin
For verification of the successful installation of the plugin, we can go to the “installed” tab, and we can see the presence of the build history metrics plugin.
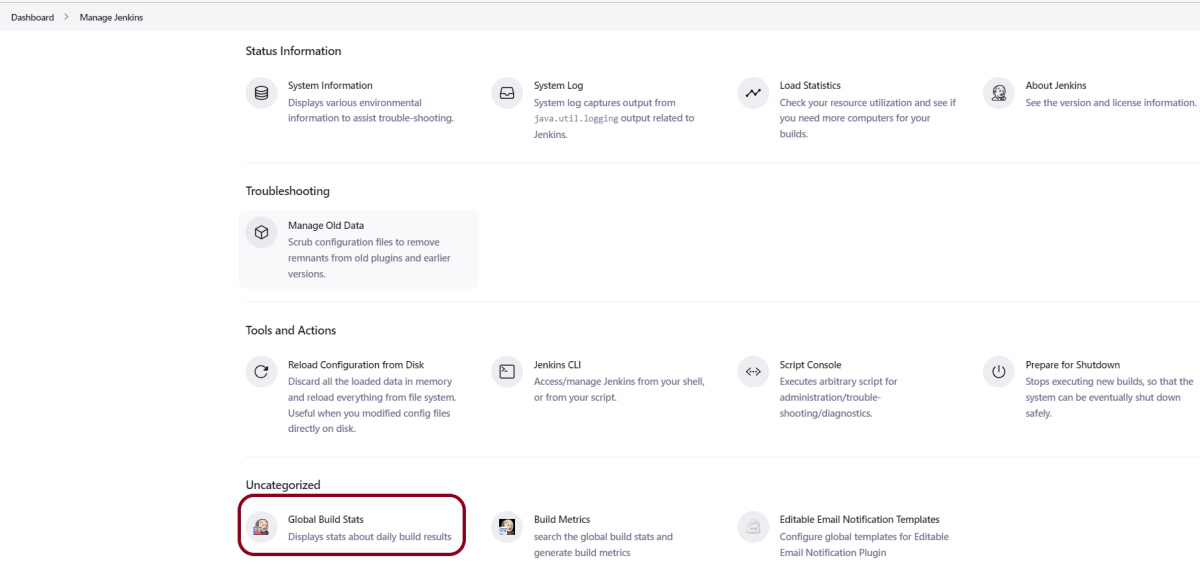
Step 6 − Generate Global Build Stats metrics
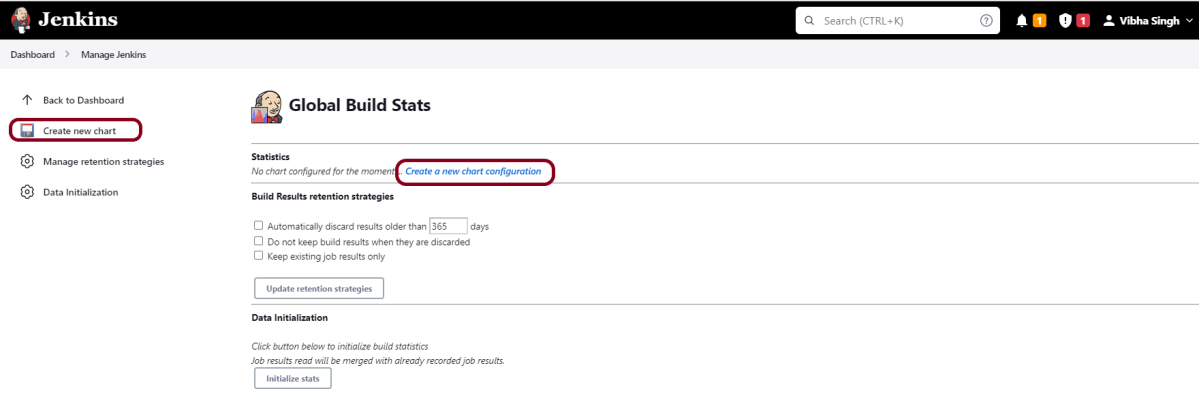
Go to the Jenkins dashboard and click on Manage Jenkins. In the Manage Jenkins screen, scroll down, and now you will now see an option called “Global Build Stats“. Click on this link.
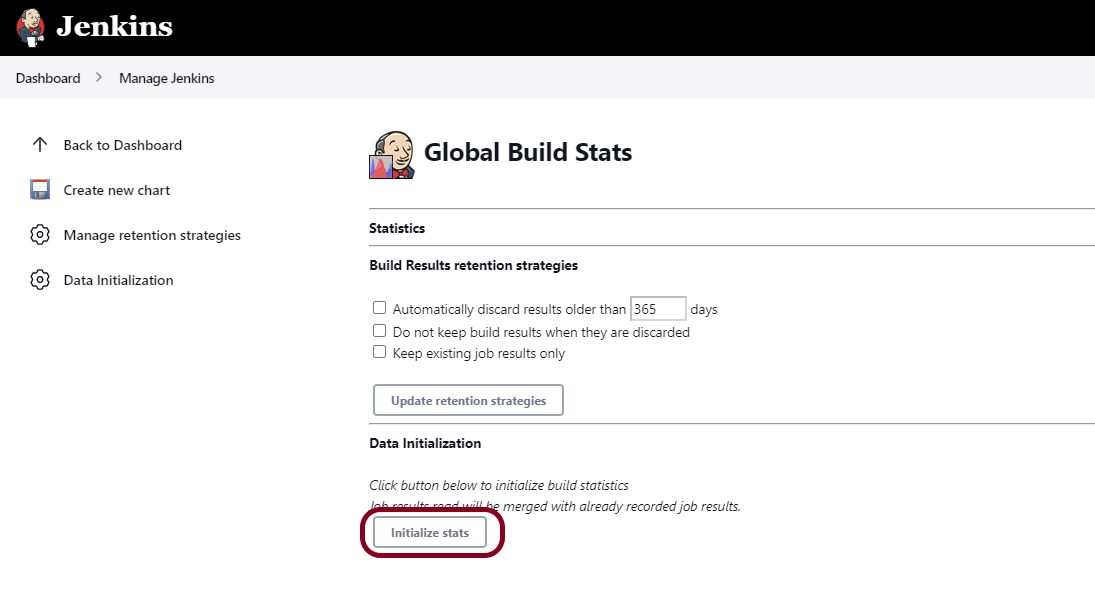
Click on the button “Initialize stats“. What this does is that it gathers all the existing records for builds that have already been carried out, and charts can be created based on these results.
Once the data has been initialized, it’s time to create a new chart. Click on the “Create new chart” link.
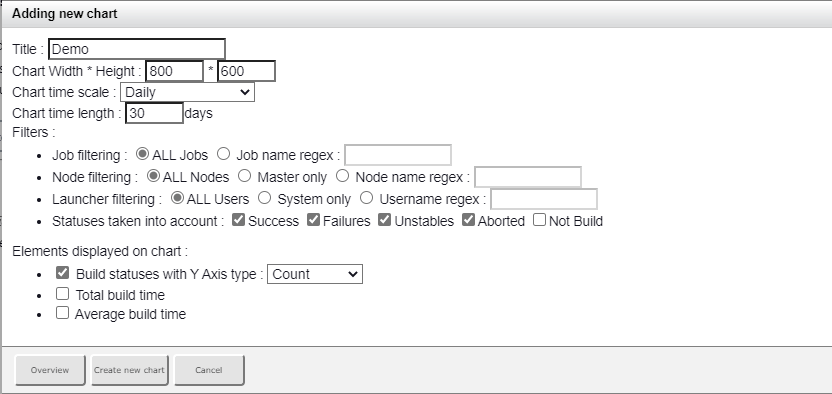
A pop-up will come to enter the relevant information for the new chart details. Enter the following mandatory information.
Title – Any title information, for this example is given as ‘Demo’
Chart Width – 800
Chart Height – 600
Chart time scale – Daily
Chart time length – 30 days
The rest of the information can remain as it is. Once the information is entered, click on Create New chart.
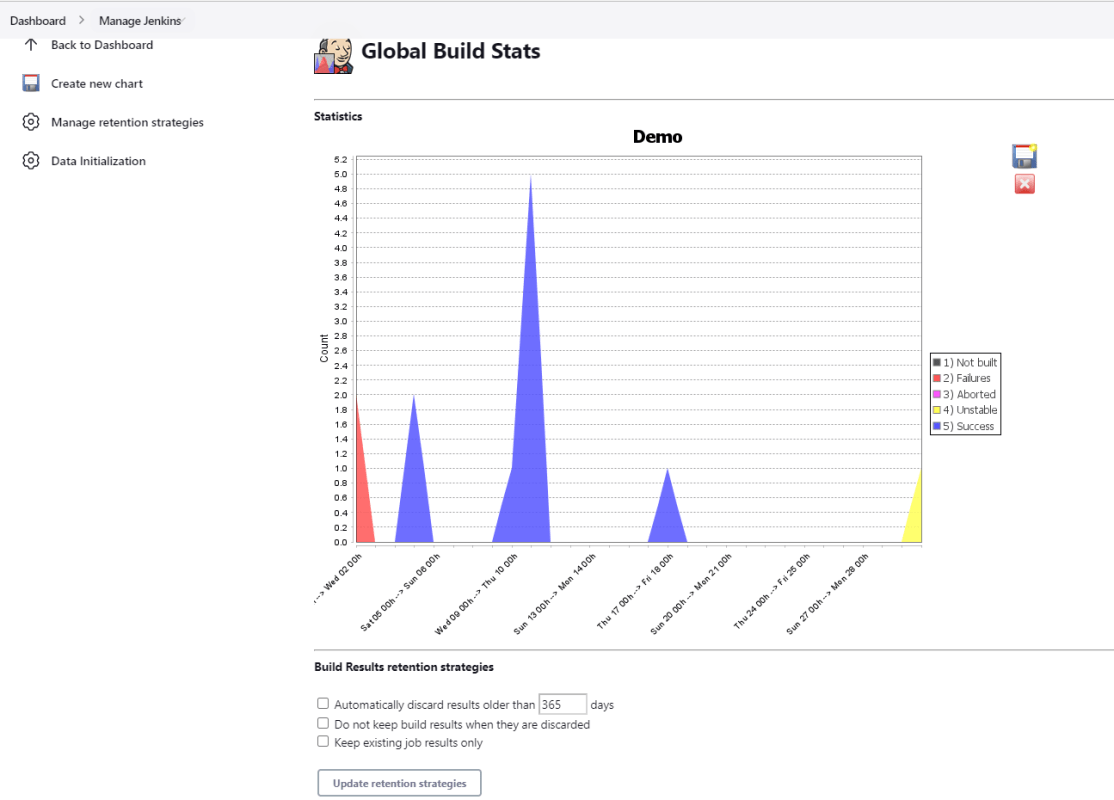
You will now see the chart which displays the trends of the builds over time.
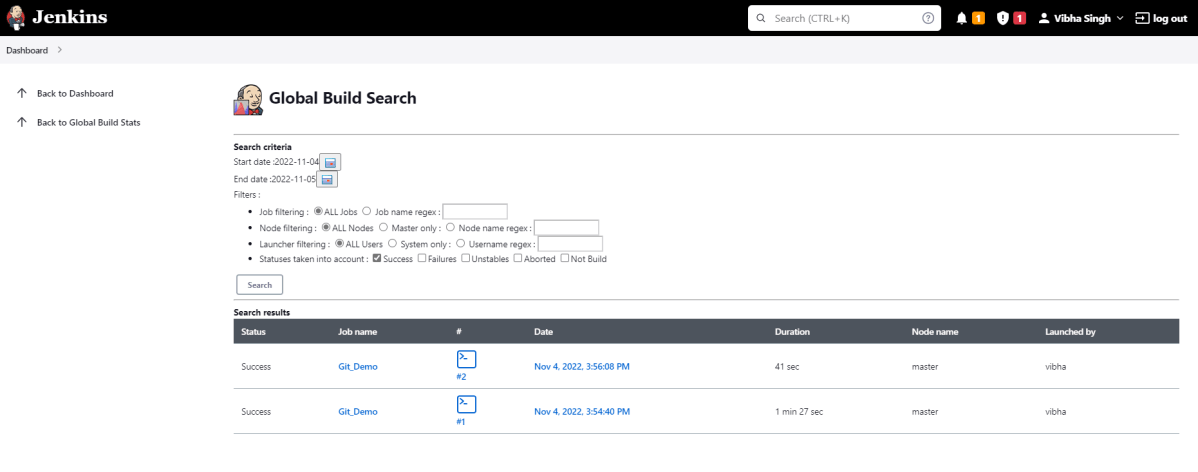
If you click on any section within the chart, it will give you a drill-down of the details of the job and its builds.
Congratulations on making it through this tutorial and hope you found it useful! Happy Learning!! Cheers!!
Jenkins includes a number of plugins for displaying metrics for builds that take place over time. These metrics can help you understand your builds and how often they fail/pass over time. Consider the ‘Build History Metrics plugin‘ as an example.
What is Build History Plugin?
This plugin calculates the following metrics for all of your builds once installed:
Mean Time To Failure (MTTF)
Mean Time To Recovery (MTTR)
Standard Deviation of Build Times
The calculated metrics are displayed in a table on each jobs page showing the metric for the last 7 days, last 30 days, and all time.
How to install the metric-related plugin in Jenkins?
Implementation Steps
Step 1: Start the Jenkins server and open the browser and navigate to the localhost and the port in which Jenkins is running
Provide a username and password and click on the Sign-in Button.
Step 3: Download and Install Build History Metrics Plugin
Click on the Manage Jenkins. Choose Manage Plugins.
Step 4: Add the Build History Metrics Plugin
On the Plugins Page, go to the Available option.
Select the Build History Metrics Plugin
Click onInstall without restart.The plugin will take a few moments to finish downloading depending on your internet connection, and will be installed automatically.
You can also select the option Download now and Install after the restart button. In which plugin is installed after the restart
You will be shown a “No updates available” message if you already have the TestNG Report plugin installed.
Step 5: Restart Jenkins
Click on the checkbox “Restart Jenkins when installation is complete when no jobs are running“.
For verification of the successful installation of the plugin, we can go to the “installed” tab, and we can see the presence of the build history metrics plugin.
How to view metrics in Jenkins?
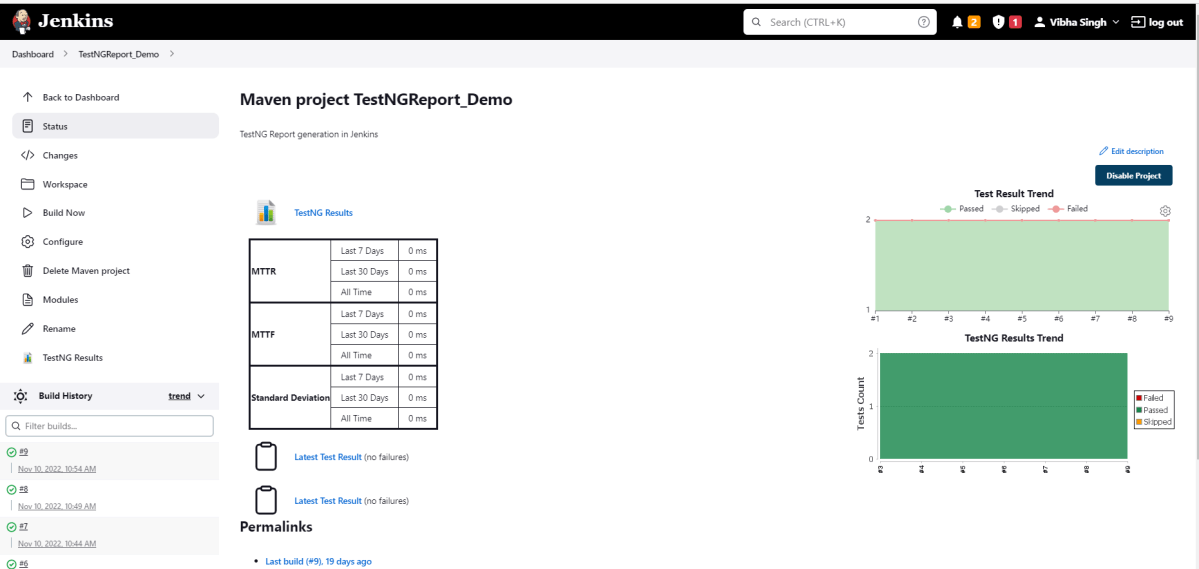
Step 1: Go to the Jenkinsdashboard and click on any job. Here we can see the metrics like MTTR, MTTF, and Standard deviation in the tabular form highlighted below.
Note: If, after installing the plugin below, the tabular form does not display, then restart Jenkins.
Metrics are shown for the last 7 days, last 30 days, and all time.
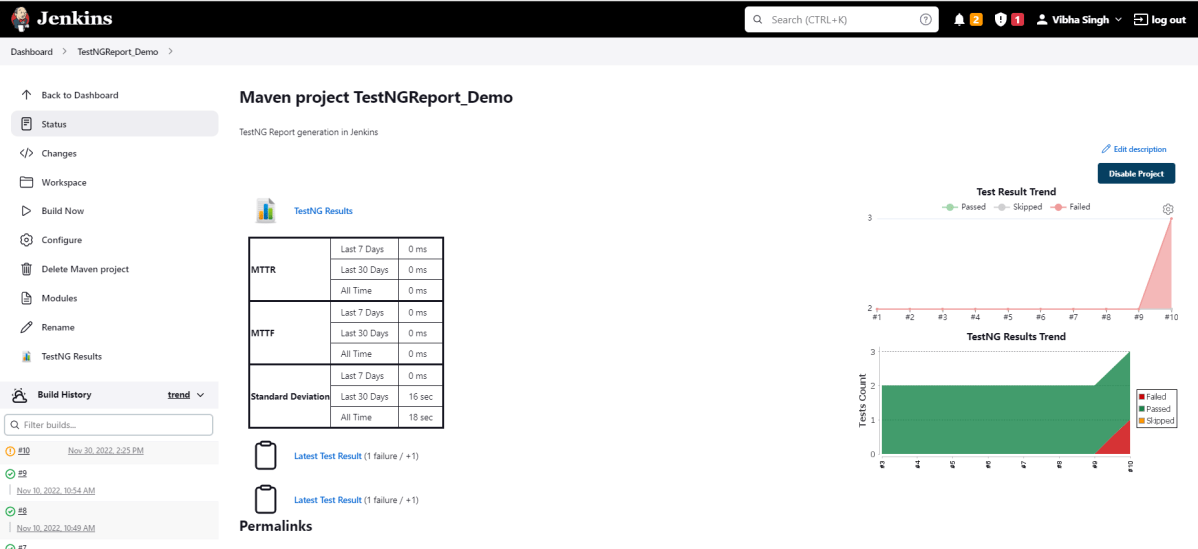
Step 2: Run any job for which the build is showing as failed status, and then we can see the time for MTTR and MTTF as mentioned in the below image.
Congratulations on making it through this tutorial and hope you found it useful! Happy Learning!! Cheers!!