Automate JMeter Testing with GitHub Actions

HOME

<project xmlns="http://maven.apache.org/POM/4.0.0" xmlns:xsi="http://www.w3.org/2001/XMLSchema-instance"
  xsi:schemaLocation="http://maven.apache.org/POM/4.0.0 http://maven.apache.org/xsd/maven-4.0.0.xsd">
  <modelVersion>4.0.0</modelVersion>

  <groupId>com.example</groupId>
  <artifactId>JMeter_GitHub_Integration</artifactId>
  <version>1.0-SNAPSHOT</version>
  <packaging>jar</packaging>

  <name>JMeter_GitHub_Integration</name>
  <url>http://maven.apache.org</url>

  <properties>
    <project.build.sourceEncoding>UTF-8</project.build.sourceEncoding>
  </properties>

  <build>
    <plugins>
      <plugin>
        <groupId>org.apache.maven.plugins</groupId>
        <artifactId>maven-compiler-plugin</artifactId>
        <version>3.14.0</version>
        <configuration>
          <source>17</source>
          <target>17</target>
        </configuration>
      </plugin>

      <plugin>
        <groupId>com.lazerycode.jmeter</groupId>
        <artifactId>jmeter-maven-plugin</artifactId>
        <version>3.8.0</version>
        <executions>
          <!-- Generate JMeter configuration -->
          <execution>
            <id>configuration</id>
            <goals>
              <goal>configure</goal>
            </goals>
          </execution>
          <!-- Run JMeter tests -->
          <execution>
            <id>jmeter-tests</id>
            <goals>
              <goal>jmeter</goal>
            </goals>
          </execution>
          <!-- Fail build on errors in test -->
          <execution>
            <id>jmeter-check-results</id>
            <goals>
              <goal>results</goal>
            </goals>
          </execution>
        </executions>
        <configuration>
          <generateReports>true</generateReports>
        </configuration>
      </plugin>
    </plugins>
  </build>
</project>

mvn clean verify

echo "# JMeter_Github_Integration" >> README.md
git init
git add .
git commit -m "Jmeter Tests"
git branch -M main
git remote add origin https://github.com/vibssingh/JMeter_Github_Integration.git
git push -u origin main

name: JMeter Test Run

on:
  push:
    branches: [ "main" ]
  pull_request:
    branches: [ "main" ]

jobs:
  build:

    runs-on: ubuntu-latest

    steps:
    - uses: actions/checkout@v4
    - name: Set up JDK 17
      uses: actions/setup-java@v4
      with:
        java-version: '17'
        distribution: 'temurin'
    
    - name: Run JMeter tests
      run: mvn clean verify

    - name: JMeter Test Report Generation
      uses: actions/upload-artifact@v4
      if: success() || failure()
      with:
          name: JMeter Report                                             # Name of the folder
          path: target/jmeter/reports/SOAP_Request           # Path to test results  

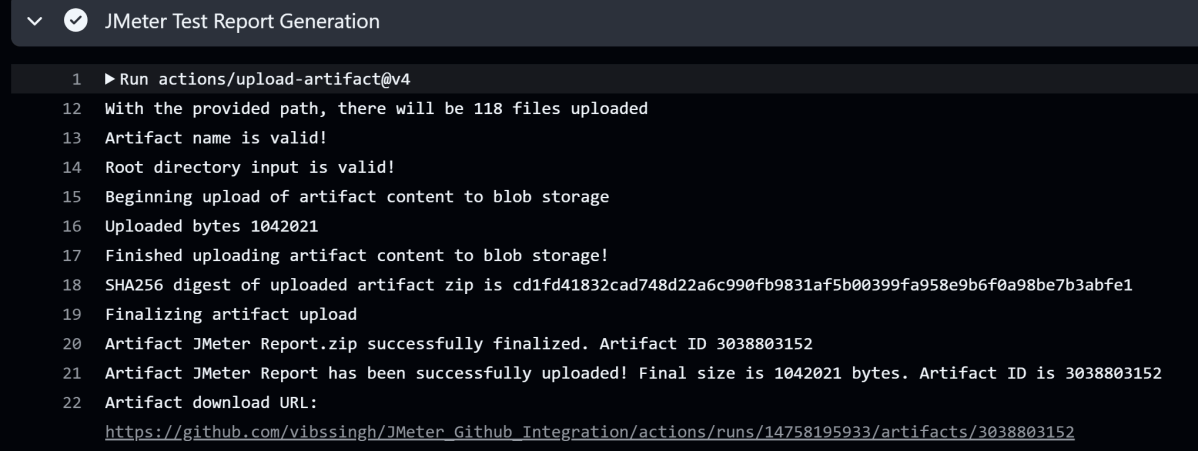
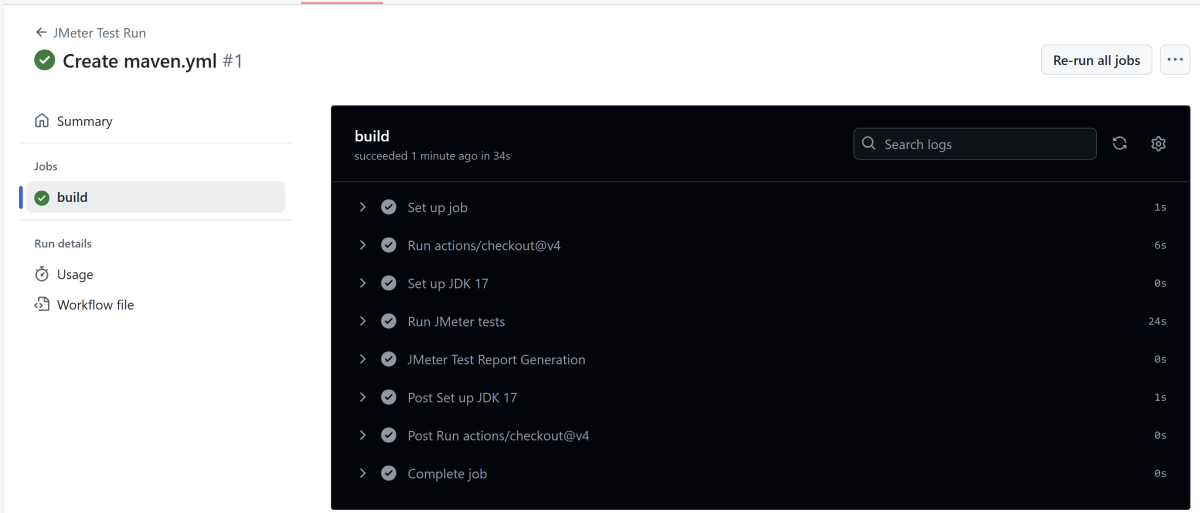
Below shows all the steps of the workflow.
JMeter Multiple Choice Questions – MCQ2

HOME


====================================================================

How to Save JMeter Test Results as CSV and XML Files

Last Updated On

HOME

Saving JMeter test results in multiple formats like CSV and XML is beneficial. It allows for detailed analysis and flexibility in processing. This flexibility is useful for reporting. Here’s a detailed guide on how to save or export the results of your Apache JMeter test script to a CSV or XML file.

The sample request and response used in this tutorial are shown below:

Sample Request

<?xml version="1.0" encoding="utf-8"?>
<soap:Envelope xmlns:soap="http://schemas.xmlsoap.org/soap/envelope/">
  <soap:Body>
    <NumberToWords xmlns="http://www.dataaccess.com/webservicesserver/">
      <ubiNum>500</ubiNum>
    </NumberToWords>
  </soap:Body>
</soap:Envelope>

Sample Response

<?xml version="1.0" encoding="utf-8"?>
<soap:Envelope xmlns:soap="http://schemas.xmlsoap.org/soap/envelope/">
  <soap:Body>
    <m:NumberToWordsResponse xmlns:m="http://www.dataaccess.com/webservicesserver/">
      <m:NumberToWordsResult>five hundred </m:NumberToWordsResult>
    </m:NumberToWordsResponse>
  </soap:Body>
</soap:Envelope>

1. Create a Test Plan in JMeter


2. Add Thread Group

  • Select Test Plan on the tree
  • Add Thread Group                                                                                                                               
  • To add Thread Group: Right-click on the “Test Plan” and add a new thread group: Add -> Threads (Users) -> Thread Group

In the Thread Group control panel, enter Thread Properties as follows:

3.  Adding JMeter elements  

The JMeter element used here is HTTP Request Sampler. In the HTTP Request Control Panel, the Path field indicates which URL request you want to send

Add HTTP Request

The below-mentioned are the values used in HTTP Request to perform the test

  • Protocolhttps
  • Method POST
  • Path – /webservicesserver/NumberConversion.wso

Add HTTP Head Manager

SOAP requests require specific content-type headers. The Header Manager lets you add or override HTTP request headers like can add Accept-Encoding, Accept, Cache-Control

To add: Right-click on Thread Group and select: Add -> Config Element -> HTTP Read Manager

The below-mentioned are the values used in Http Request to perform the test
Content-type = text/xml

5. Adding Listeners to save result as CSV File

Listeners – They show the results of the test execution. They can show results in a different format such as a tree, table, graph, or log file

We are adding the Aggregate Report listener.

Aggregate Report

It is almost the same as Summary Report except Aggregate Report gives a few more parameters like, “Median”, “90% Line”, “95% Line” and “99% Line”.

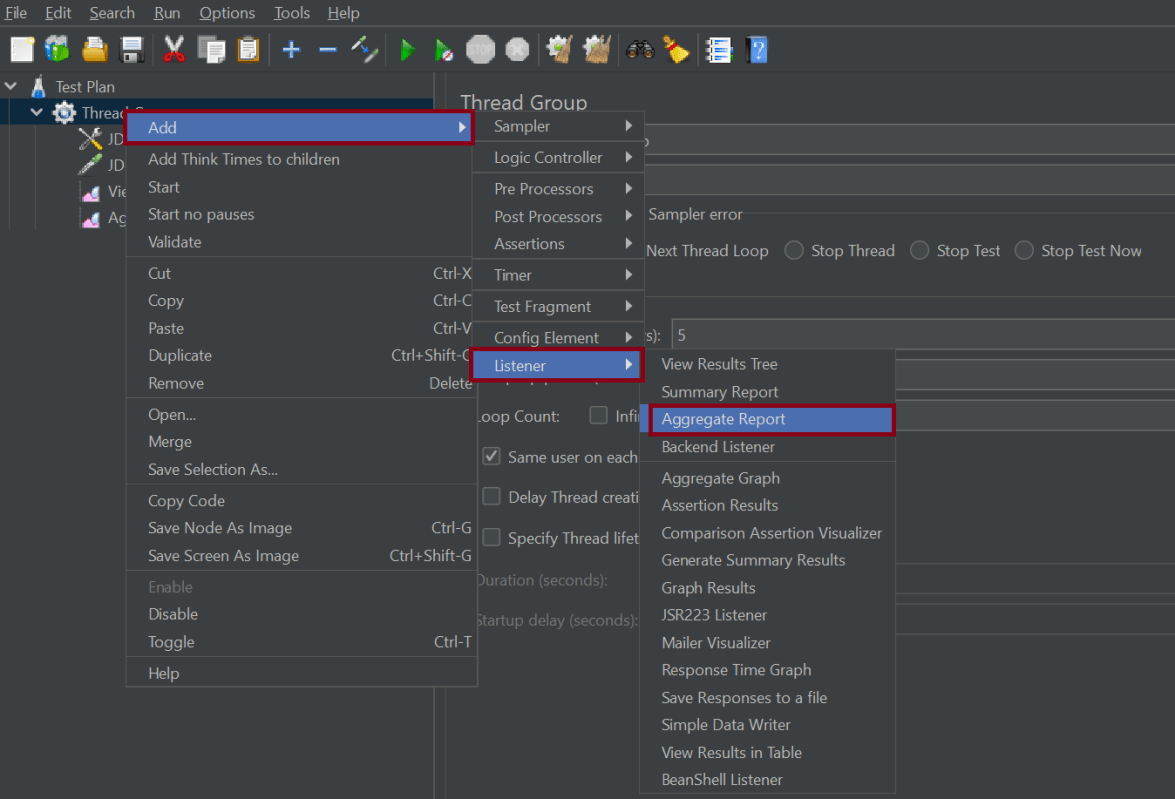
 To add: Right Click on Thread Group > Add > Listener > Aggregate Report

Configure the filename in the Filename field of the Aggregate Report i.e.: [FULLPATH]/results.csv, where [FULLPATH] is the path on the disk to the directory where you want to save the Apache

6. Save the Test Plan

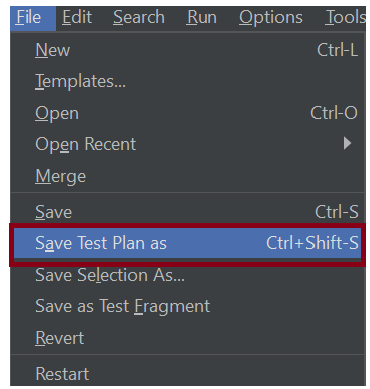
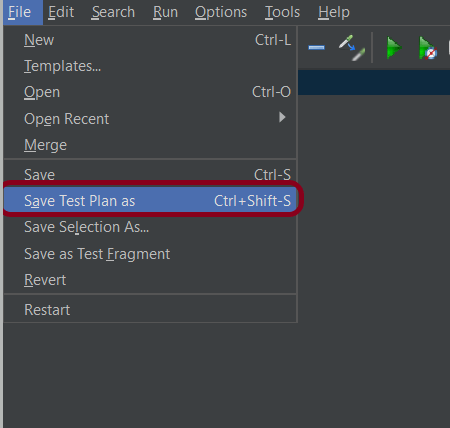
To Save: Click File and Select -> Save Test Plan as ->Give the name of the Test Plan. It will be saved in .jmx format.

7. Run the Test Plan

Click on the Green Triangle as shown at the top to run the test.

8. View the Execution Status

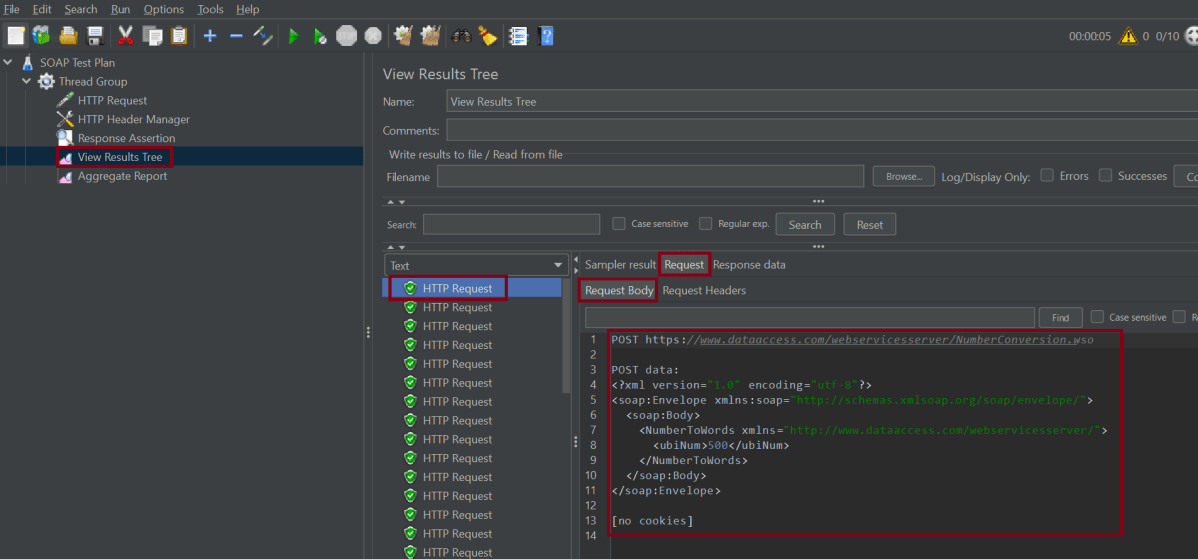
Click on View Result Tree to see the status of Run. A successful request will be of a Green color in the Text Section.

Click on Aggregate Report Result to see the aggregated status of Run.

A file with the Aggregate_Result.csv name will now be created at the path specified.

C:\Users\Vibha\Desktop\Automation\Performance_Testing\AggregateResult_${__time(yyyyMMdd-HHmmss)}.csv
C:\Users\Vibha\Desktop\Automation\Performance_Testing\ggregateResult_${__time(yyyyMMdd-HHmmss)}.xml

${__property(user.dir)}${__BeanShell(File.separator,)}PerformanceResult_${__time(yyyyMMdd-HHmmss)}.csv
${__property(user.dir)}${__BeanShell(File.separator,)}PerformanceResult_${__time(yyyyMMdd-HHmmss)}.xml

We are done! Congratulations on making it through this tutorial and hope you found it useful! Happy Learning!!

Additional Tutorials

How to send GET Requests in JMeter
JMeter Authorization with access token
How to generate JMeter HTML Report? 
Constant Throughput Timer in JMeter
How to generate Random Variables in JMeter

Step-by-Step Guide to Test SOAP Services with JMeter

Last Updated On

HOME


SOAP is a messaging protocol specification for exchanging structured information in the implementation of web services. Its purpose is to induce extensibility, neutrality, and independence. Testing SOAP (Simple Object Access Protocol) services using JMeter requires setting up a test plan. The test plan simulates requests. It also analyzes responses from the SOAP web service.

Here’s a detailed guide to help you test SOAP services using JMeter:

The sample request and response used in this tutorial are shown below:

Sample Request

<?xml version="1.0" encoding="utf-8"?>
<soap:Envelope xmlns:soap="http://schemas.xmlsoap.org/soap/envelope/">
  <soap:Body>
    <NumberToWords xmlns="http://www.dataaccess.com/webservicesserver/">
      <ubiNum>500</ubiNum>
    </NumberToWords>
  </soap:Body>
</soap:Envelope>

Sample Response

<?xml version="1.0" encoding="utf-8"?>
<soap:Envelope xmlns:soap="http://schemas.xmlsoap.org/soap/envelope/">
  <soap:Body>
    <m:NumberToWordsResponse xmlns:m="http://www.dataaccess.com/webservicesserver/">
      <m:NumberToWordsResult>five hundred </m:NumberToWordsResult>
    </m:NumberToWordsResponse>
  </soap:Body>
</soap:Envelope>

1. Create a Test Plan in JMeter


2. Add Thread Group

  • Select Test Plan on the tree
  • Add Thread Group                                                                                                                               
  • To add Thread Group: Right-click on the “Test Plan” and add a new thread group: Add -> Threads (Users) -> Thread Group

In the Thread Group control panel, enter Thread Properties as follows:

3.  Adding JMeter elements  

The JMeter element used here is HTTP Request Sampler. In the HTTP Request Control Panel, the Path field indicates which URL request you want to send

Add HTTP Request

The below-mentioned are the values used in HTTP Request to perform the test

  • Protocolhttps
  • Server Name or IPhttp://www.dataaccess.com
  • Method POST
  • Path – /webservicesserver/NumberConversion.wso

Add HTTP Head Manager

SOAP requests require specific content-type headers. The Header Manager lets you add or override HTTP request headers like can add Accept-Encoding, Accept, Cache-Control

To add: Right-click on Thread Group and select: Add -> Config Element -> HTTP Read Manager

The below-mentioned are the values used in Http Request to perform the test
Content-type = text/xml

5. Adding Listeners to Test Plan

Listeners – They show the results of the test execution. They can show results in a different format such as a tree, table, graph, or log file

We are adding the View Result Tree listener & Aggregate Report listener.

View Result Tree

View Result Tree shows the results of the user request in basic HTML format
To add: Right-click on Test Plan, Add -> Listener -> View Result Tree

Aggregate Report

It is almost the same as Summary Report except Aggregate Report gives a few more parameters like, “Median”, “90% Line”, “95% Line” and “99% Line”.

 To add: Right Click on Thread Group > Add > Listener > Aggregate Report

6. Save the Test Plan

To Save: Click File and Select -> Save Test Plan as ->Give the name of the Test Plan. It will be saved in .jmx format.

7. Run the Test Plan

Click on the Green Triangle as shown at the top to run the test.

8. View the Execution Status

Click on View Result Tree to see the status of Run. A successful request will be of a Green colour in the Text Section.

Click on Response data and Response Header to view other information about Response.

Click on Aggregate Report Result to see the aggregated status of Run.

We are done! Congratulations on making it through this tutorial and hope you found it useful! Happy Learning!!

Additional Tutorials

How to send GET Requests in JMeter
JMeter Authorization with access token
How to generate JMeter HTML Report? 
Constant Throughput Timer in JMeter
How to generate Random Variables in JMeter

Database Load Testing with JMeter: A Step-by-Step Guide

HOME

Database load testing simulates multiple users interacting with a database simultaneously, measuring performance, scalability, and reliability under heavy loads. It helps identify bottlenecks, issues, and potential errors that occur with high traffic volumes.

JMeter is a popular open-source tool for load testing databases.

2. Create a Test Plan in JMeter

3. Add Thread Group

  • Select Test Plan on the tree
  • Add Thread Group                                                                                           
    • To add Thread Group: Right click on the “Test Plan” and add a new thread group: Add -> Threads (Users) -> Thread Group

In the Thread Group control panel, enter Thread Properties as follows:

  • Number of Threads: 5 – Number of users connects to the target website
  • Loop Count: 5  – Number of time to execute testing
  • Ramp-Up Period: 1 – It tells JMeter how long to delay before starting the next user.

4. Configuring Database Connection

The JMeter element used here is HTTP Request Sampler. In HTTP Request Control Panel, the Path field indicates which URL request you want to send.

Add JDBC Connection Configuration

To add: Right-click on Thread Group and select: Add –> Config Element –> JDBC Connection Configuration

5. Adding Listeners to Test Plan

Listeners – They shows the results of the test execution. They can show results in a different format such as a tree, table, graph or log file

We are adding  View Result Tree listener & Aggregate Report

View Result Tree

View Result Tree show results of the user request in basic HTML format

To add: Right click Test Plan, Add -> Listener -> View Result Tree

The entire Test Plan will look like as shown below

6. Save the Test Plan

To Save: Click File Select -> Save Test Plan as ->Give name of the Test Plan. It will be save as .jmx format.

Sample .jmx File

7. Run the Test Plan

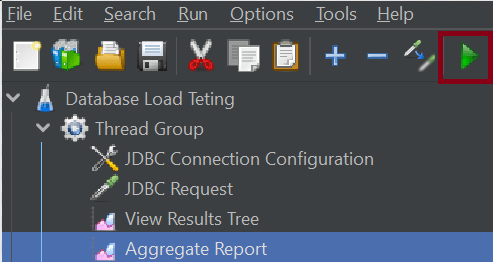
Click on Green Triangle as shown below to run the test.

8. View the Execution Status

Click on View Result Tree to see the status of Run. Successful request will be of Green color in the Text Section. The View Results Tree listener breaks down each request and response in detail, including:

The response body as well as response headers can be seen in the listener.

That’s it! Congratulations on making it through this tutorial and hope you found it useful! Happy Learning!!

JMeter Multiple Choice Answers – MCQ1

HOME

JMeter Multiple Choice Questions – MCQ1


JMeter Multiple Choice Questions – MCQ1

HOME

Answer


Answer


Answer


Answer


Answer


Answer


Answer


Answer


Answer


Answer


Answer


Answer


Answer


Answer


Answer


Answer


Answer


Answer


Answer


Answer


====================================================================

How to generate Random Variables in JMeter

Last Updated On

HOME

This tutorial tells how random variable can generate and pass as a part of a request in JMeter. Suppose, in the load test, there is a requirement to pass random or different values to a specific parameter in the requests, how this can be achieved. One of the ways is to pass different values from a .csv file that contain different values and use them in the requests. The second way is to add Random Variable in JMeter, which generates random values at every run for requests. 

Table of Contents

What is Random Variable in JMeter?

The random variable config element is used to generate random numeric values within a range of specified minimum and maximum values.


Variable name: The name we are going to use to invoke the variable. “ReqCacheKey” in this example.

Output Format: The format for the variable. You can set the desired length of the number. I have set 0000000000 in order to work with a five-digit number. You can also use USER_000.

Minimum and Maximum: The range we want to set for the variable.

Seed: The seed for the random number generator. A seed is the first input that the number generation function receives to start the random generation. Here, it is ${__time()}. This will randomly generate the value like 1256078934, 9863457201

Per Thread: Is important to consider this option. If you set it as True, the threads will share the value. This means that there will be threads with the same value. If you require the variable to be different each time, this could cause problems for us. If you want to always generate a different value, you have to set it as False.

Create a Test Plan in JMeter

Add Thread Group

Select Test Plan on the tree

Add Thread Group                     

To add Thread Group: Right click on the “Test Plan” and add a new thread group: Add -> Threads (Users) -> Thread Group

In the Thread Group control panel, enter Thread Properties as follows: 

Number of Threads: 1 – Number of users connects to the target website
Loop Count: Infinite  – Number of times to execute testing
Ramp-Up Period:
Duration: 5 sec

Adding HTTP Request   

The JMeter element used here is HTTP Request Sampler. In HTTP Request Control Panel, the Path field indicates which URL request you want to send

Add HTTP Request Sampler

To add: Right-click on Thread Group and select: Add -> Sampler -> HTTP Request

Below-mentioned are the values used in HTTP Request to perform the test.

Name – HTTP Request 
Server Name or IP – localhost
Port – 8010
Method – POST
Path – /demo/helloworld

Add a Random Variable

 To add: Right-click on Thread Group and select: Add -> Config Element-> Random Variable.

The sample Request is shown below. cacheKey variable is parameterized. ReqCacheKey in Random Variable will generate the random values, which will be passed to the parameter cacheKey present in the request body

Seed is ${__time()}. This generates the value randomly, like 1256078934, 9863457201. If I keep Seed blank, then when the tests run multiple times, it has the same set of random values (repetitive values), we don’t want the same repetitive values, so seed is not blank

Adding Listeners to the Test Plan

Listeners

They show the results of the test execution. They can show results in a different format such as a tree, table, graph, or log file

We are adding the View Result Tree listener

View Result Tree – View Result Tree shows the results of the user request in basic HTML format

To add: Right click Test Plan, Add -> Listener -> View Result Tree

Save the Test Plan

To Save: Click File Select -> Save Test Plan as ->Give the name of the Test Plan. It will be saved as .jmx format

Run the Test Plan

Click on Green Triangle as shown at the top to run the test

View the Execution Status

Click on View Result Tree to see the status of Run. A successful request will be of a Green colour in the Text Section

In the below image, we can see that the cacheKey value is 1917449705 which is generated by Random Variable

Congratulations on making it through this tutorial and hope you found it useful! Happy Learning!! Cheers!!

Additional Tutorials

 How to send POST requests in JMeter
JMeter Authorization with access token
 How to run JMeter tests from the command line 
Constant Throughput Timer in JMeter
How to create Web Test Plan for JMeter? 
How to run JMeter tests from the command line

How to send POST requests in JMeter

Last Updated On

HOME


We can perform GET as well as POST operations in JMeter. In this tutorial, we will only explain how we send POST HTTP requests in JMeter. In the previous tutorial, I explained how we can send GET request in JMeter.

Table of Contents

  1. Create a Test Plan in JMeter
    1. Add Thread Group
    2. Adding JMeter elements  
    3. Adding Listeners to Test Plan
    4. Save the Test Plan
    5. Run the Test Plan
    6. View the Execution Status

The sample request and response used in this tutorial are shown below:

Sample Request

{
    "name": "Test",
    "job": "JMeter"
}

Sample Response

{
  "name":"Test",
  "job":"JMeter",
  "id":"955",
  "createdAt":"2023-07-03T15:46:18.038Z"
}

Create a Test Plan in JMeter


Step 1 –  Add Thread Group

  • Select Test Plan on the tree
  • Add Thread Group                                                                                                                               To add Thread Group: Right-click on the “Test Plan” and add a new thread group: Add -> Threads (Users) -> Thread Group

In the Thread Group control panel, enter Thread Properties as follows: We will take an example of row no 5

Number of Threads: 5 – Number of users connects to the target website
Loop Count: 5  – Number of times to execute testing
Ramp-Up Period: 5 – It tells JMeter how long to delay before starting the next user. For example, if we have 5 users and a 5 -second Ramp-Up period, then the delay between starting users would be 1 second (5 seconds /5 users).

Step 2 –  Adding JMeter elements  

The JMeter element used here is HTTP Request Sampler. In the HTTP Request Control Panel, the Path field indicates which URL request you want to send


2.1 Add HTTP Request Sampler
To add: Right-click on Thread Group and select: Add -> Sampler -> HTTP Request

The below-mentioned are the values used in HTTP Request to perform the test

  • Name – HTTP POST Request Demo
  • Server Name or IP – reqres.in
  • Port
  • Method – POST
  • Path – /api/users

2.2 Add HTTP Head Manager

The Header Manager lets you add or override HTTP request headers like can add Accept-Encoding, Accept, Cache-Control

To add: Right-click on Thread Group and select: Add -> Config Element -> HTTP Read Manager

The below-mentioned are the values used in Http Request to perform the test
Content-type = application/json
accept – application/json

Step 3 – Adding Listeners to Test Plan

Listeners – They show the results of the test execution. They can show results in a different format such as a tree, table, graph, or log file
We are adding the View Result Tree listener

View Result Tree – View Result Tree shows the results of the user request in basic HTML format
To add: Right-click on Test Plan, Add -> Listener -> View Result Tree

Aggregate Report

It is almost the same as Summary Report except Aggregate Report gives a few more parameters like, “Median”, “90% Line”, “95% Line” and “99% Line”.

 To add: Right Click on Thread Group > Add > Listener > Aggregate Report

Step 4 – Save the Test Plan

To Save: Click File Select -> Save Test Plan as ->Give the name of the Test Plan. It will be saved in .jmx format.

Step 5  – Run the Test Plan

Click on the Green Triangle as shown at the top to run the test.

Step 6 – View the Execution Status

Click on View Result Tree to see the status of Run. A successful request will be of a Green colour in the Text Section.

Click on Response data and Response Header to view other information about Response.

Click on Aggregate Report Result to see the aggregated status of Run.

We are done! Congratulations on making it through this tutorial and hope you found it useful! Happy Learning!!

Additional Tutorials

How to send GET Requests in JMeter
JMeter Authorization with access token
How to generate JMeter HTML Report? 
Constant Throughput Timer in JMeter
How to generate Random Variables in JMeter

JMeter Authorization with access token

Last Updated on

HOME

Authorization with a dynamic access token is used to pass dynamic response content to subsequent requests. This is used to validate API authorization.

In this post, we will discuss fetching an access token (dynamic response) with the help of JSON Extractor. We will also show how to pass it as a parameter in the subsequent request using BeanShell Assertion.

Table of Contents:

To achieve authorization with access token, we need to create 2 Thread Groups:

Thread Group 1 – To generate Access Token  
Thread Group 2 – To pass Access Token to Request 

Step 1 – Add Thread Group 1: Thread Group – Authorization Token Generation

1. Add Thread Group

We should provide the name of the Thread Group. In this case, this thread group is used to generate the token, so named Token Generation. We want to generate only 1 token, so the Number of Threads, Ramp-up period, and Loop Count are 1 only.

2. Add HTTP Request Sampler

In the HTTP Request Control Panel, the Path field indicates which URL request you want to send

 To add: Right-click on Thread Group and select: Add -> Sampler -> HTTP Request

Add valid credentials in the parameters section.

3. Add HTTP Header Manager 

The Header Manager lets you add or override HTTP request headers like can add Accept-Encoding, Accept, Cache-Control

To add: Right-click on Thread Group and select: Add -> Config Element -> HTTP Read Manager

Add Authorization as Headers in Header Manager 

4. Add JSON Extractor

To extract the authentication token from the request, we are going to use JMeter JSON Extractor. The process of extracting a variable from a response works as mentioned below:

First, the server sends back a response. Then a post-processor, like the JSON Extractor, executes. It extracts part of the response and puts it into a variable like ${token}.

To add: Right-click on Thread Group and select: Add -> Post Processors -> JSON Extractor

The JSON extractor requires us to follow a few steps, so we can process the JSON correctly.

1) Name – JSON Extractor
2) Apply to – we will use the defaulted Main Sample Only. The option is: The main sample only – the assertion only applies to the main sample
3) Name of created variables – BEARER
4) JSON Path Expressions – access_token

5. Add BeanShell Assertion 

An advanced assertion with full access to JMeter API. Java conditional logic can be used to set the assertion result.

To add: Right-click on Thread Group and select: Add -> Assertions -> BeanShell Assertions

Add the below-mentioned script in the Script section of BeanShell Assertion

${__setProperty(BEARER, ${BEARER})};

Step 2 – Add Thread Group 2: Thread Group – Main Request

1. Add Thread Group

Provide a name to this Thread Group. I have also provided the number of threads, ramp-up, and duration in the thread group as shown in the image

We can parameterize the values of the number of threads. We can also do this for the ramp-up period and duration. This is done using a JMeter property called ___P. You can ask why we are using the property function in JMeter. It is because this makes the JMeter script configurable. We can pass any value through the command line without making any changes in the script.

___P – This is a simplified property function that is intended for use with properties defined on the command line. 

If no default value is supplied, it is assumed to be 1. The value of 1 was chosen because it is valid for common test variables such as loops, thread count, ramp-up, etc.

${__P(group1.threads)} – return the value of group1.threads

${__P(THREADS,1)} – This THREADS value will be passed through command line. If no value is passed, by default, it will choose 1.

Similarly, ramp-up and duration are parameterized.

${__P(THREADS,1)}
${__P(RAMPUP,1)}
${__P(DURATION,1)}

2. Add HTTP Request Sampler

Below-mentioned are the values used in HTTP Request to perform the test

Add a valid request body in the Body Data section (if the request is POST).

3. Add HTTP Header Manager

We have previously extracted the token from the Token Generation request. Now, it’s time to reuse it in the header section of HTTP Header Manager.

Below are the values used in the HTTP Request to perform the test.

Authorization = Bearer ${__property(BEARER)}

Step 3 – Adding Listeners to the Test Plan

Listeners – They show the results of the test execution. They can show results in a different format such as a tree, table, graph, or log file

We have added listeners – View Result Tree 

View Result Tree – View Result Tree shows the results of the user request in basic HTML format

To add: Right-click Test Plan, Add -> Listener -> View Result Tree

Step 4 – Save the Test Plan

To Save: Click File Select -> Save Test Plan as ->Give the name of the Test Plan. It will be saved as .jmx format.

Step 5  – Run the Test Plan

Click on Green Triangle as shown at the top to run the test.

Step 6 – View the Execution Status

Click on View Result Tree to see the status of Run. A successful request will be of a Green colour in the Text Section

Here, we can see that the Token Generation request is successfully processed.

The below image shows that the Main Request is successfully executed too.

    Congratulation!! We can add an authorization token generated by a request add it to another request and process the request using JMeter. 
    How to download and install Apache JMeter
    How to send GET Requests in JMeter
    How to send POST requests in JMeter
    Install Apache JMeter in Ubuntu
    Constant Throughput Timer in JMeter