Authorization with a dynamic access token is used to pass dynamic response content to subsequent requests. This is used to validate API authorization.
In this post, we will discuss fetching an access token (dynamic response) with the help of JSON Extractor. We will also show how to pass it as a parameter in the subsequent request using BeanShell Assertion.
Table of Contents:
- Prerequisite
- Implementation Steps
To achieve authorization with access token, we need to create 2 Thread Groups:
Thread Group 1 – To generate Access Token
Thread Group 2 – To pass Access Token to Request

Prerequisite:
Install JMeter on your system.
Implementation Steps:
Step 1 – Add Thread Group 1: Thread Group – Authorization Token Generation
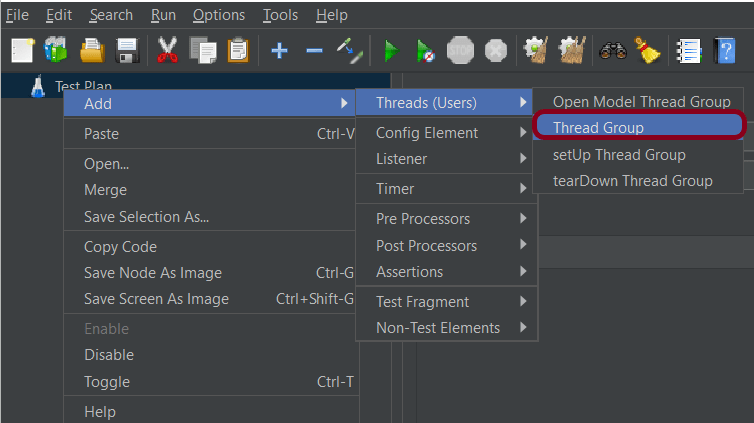
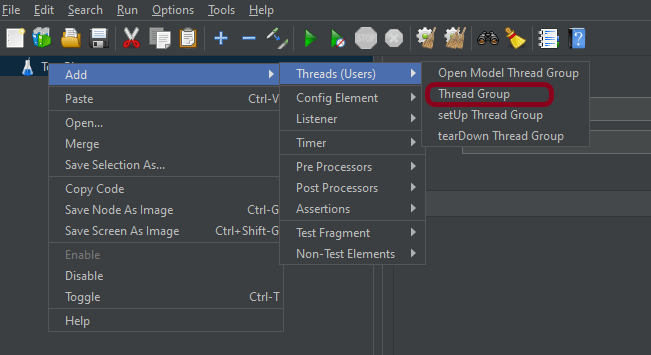
1. Add Thread Group
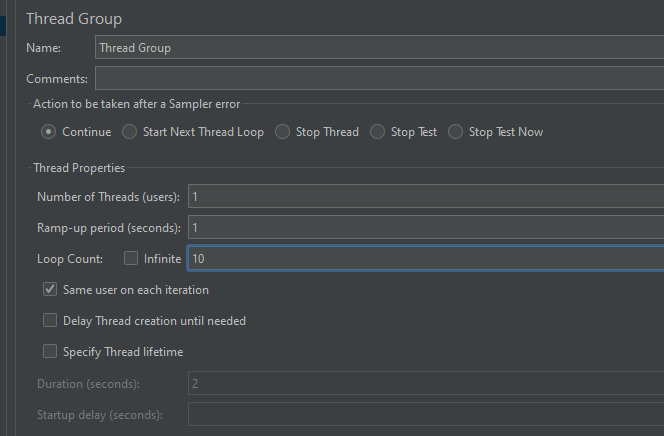
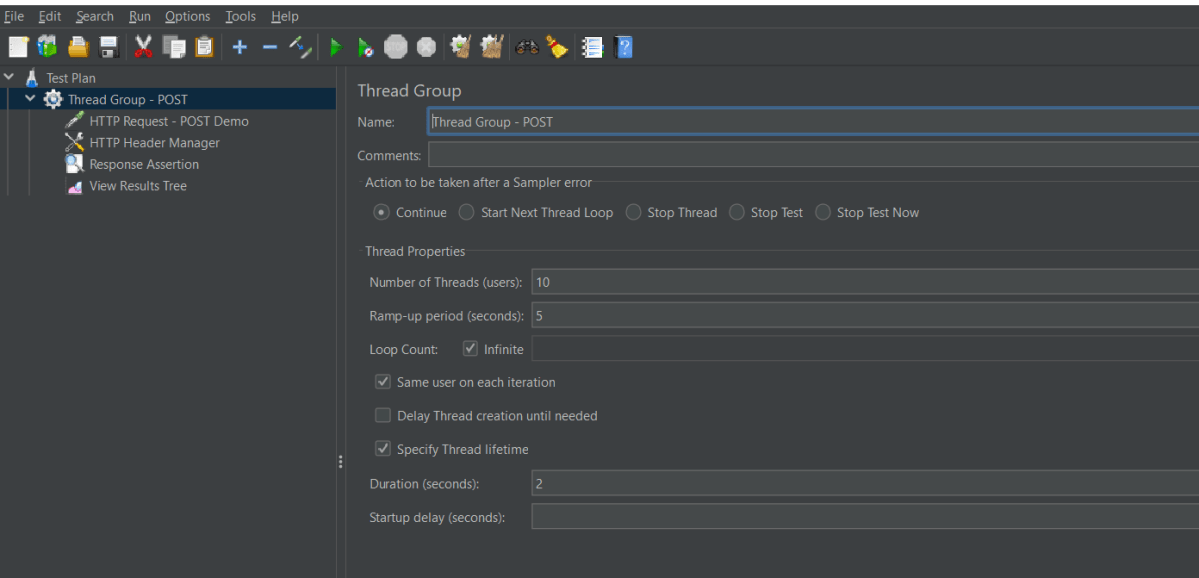
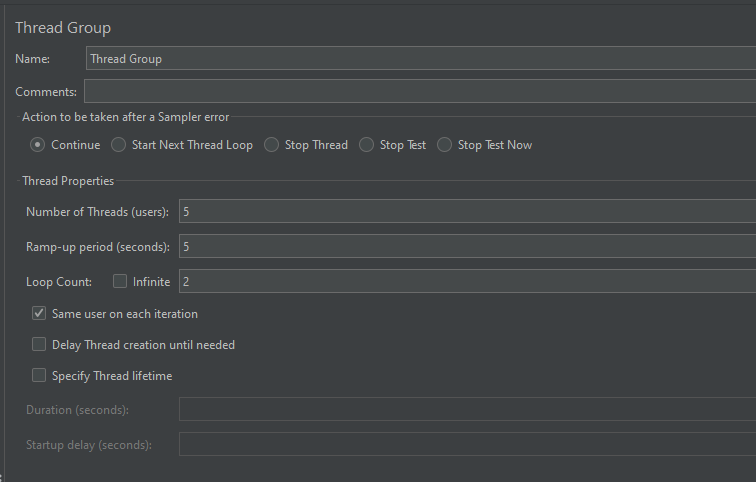
We should provide the name of the Thread Group. In this case, this thread group is used to generate the token, so named Token Generation. We want to generate only 1 token, so the Number of Threads, Ramp-up period, and Loop Count are 1 only.

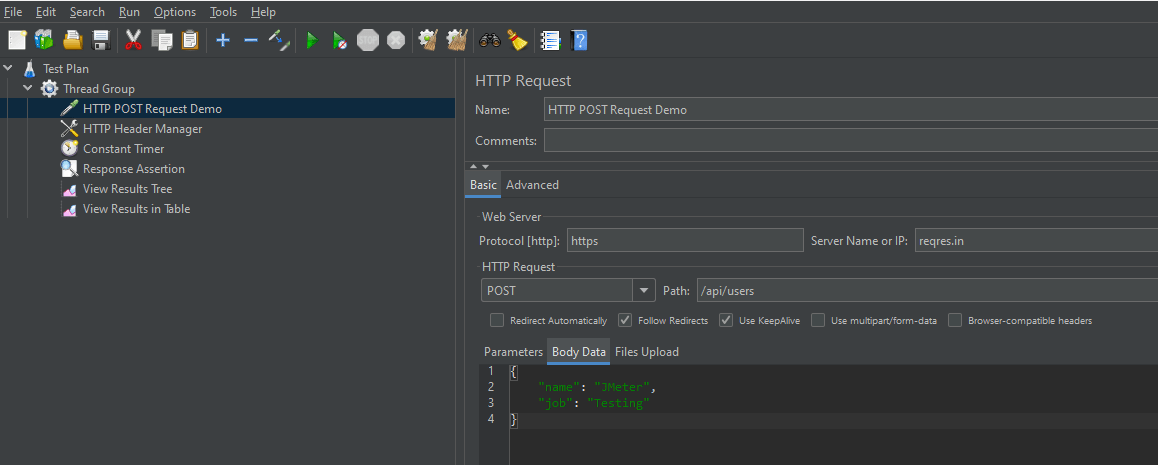
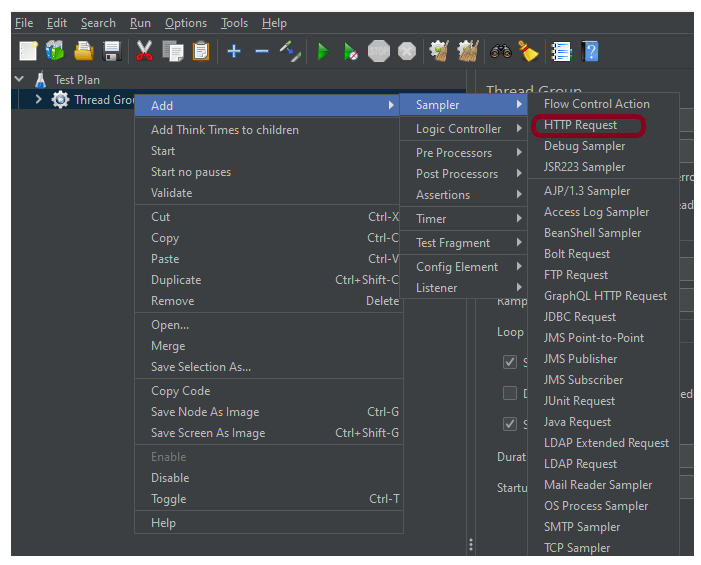
2. Add HTTP Request Sampler
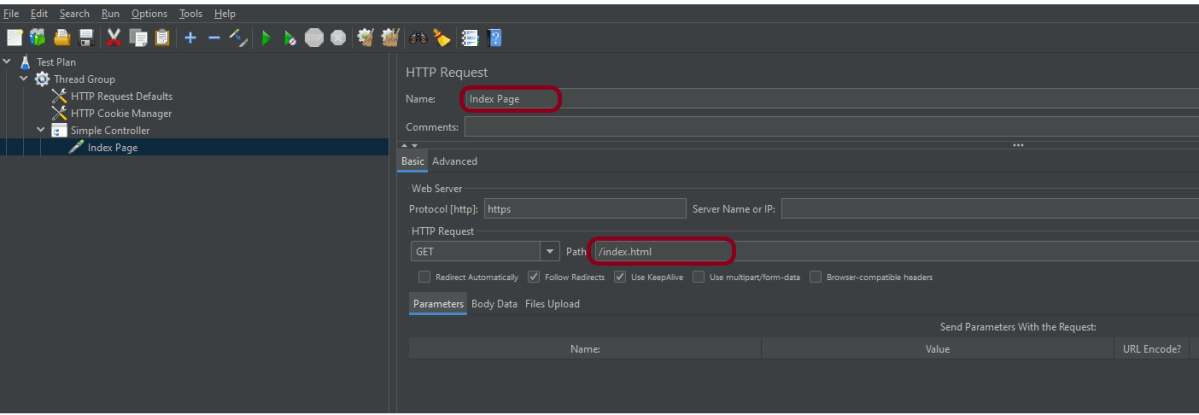
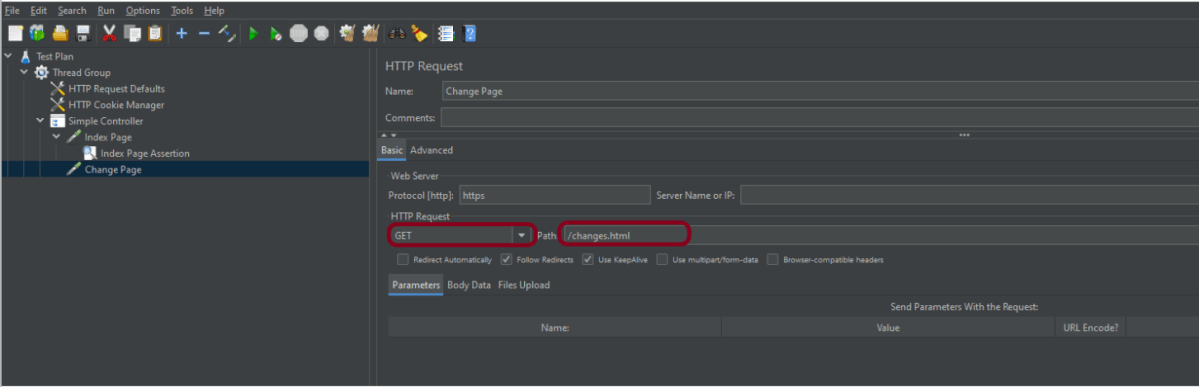
In the HTTP Request Control Panel, the Path field indicates which URL request you want to send
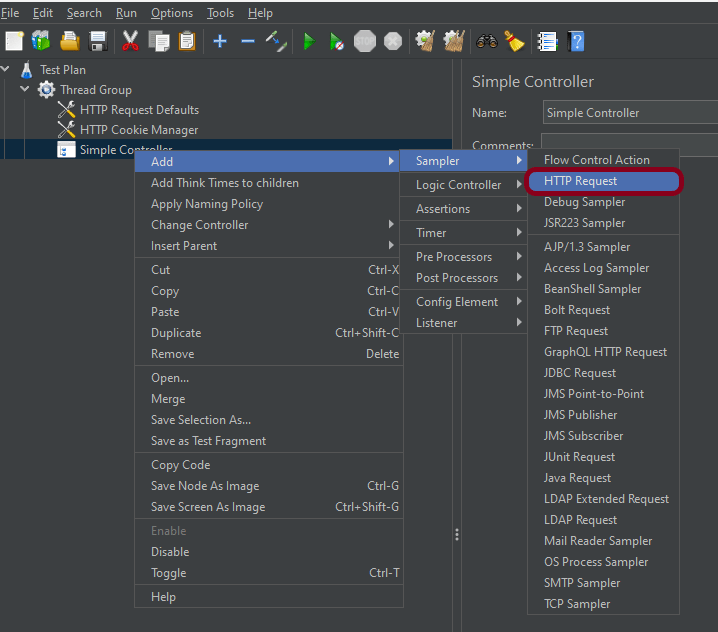
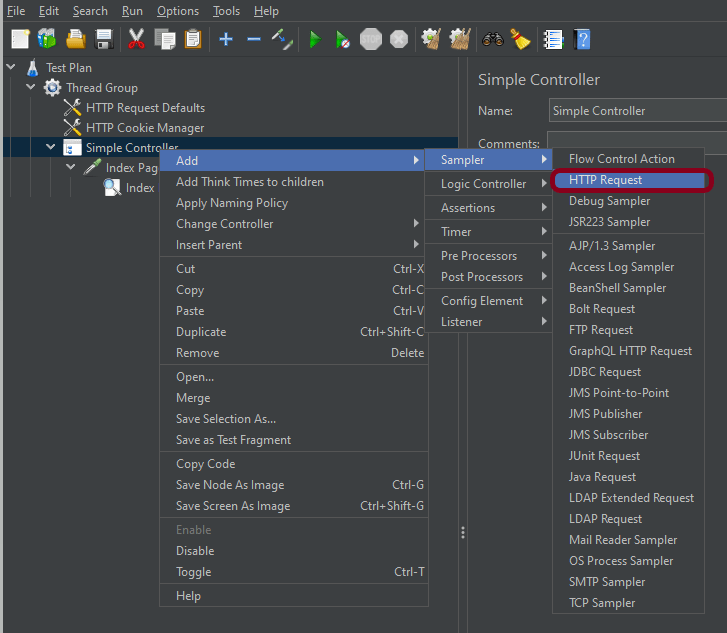
To add: Right-click on Thread Group and select: Add -> Sampler -> HTTP Request
Add valid credentials in the parameters section.

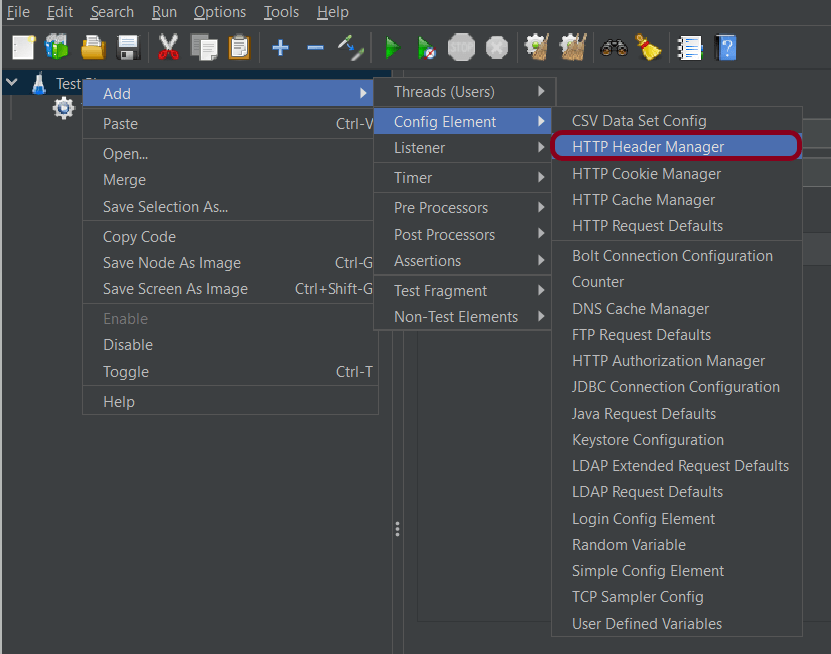
3. Add HTTP Header Manager
The Header Manager lets you add or override HTTP request headers like can add Accept-Encoding, Accept, Cache-Control
To add: Right-click on Thread Group and select: Add -> Config Element -> HTTP Read Manager

Add Authorization as Headers in Header Manager

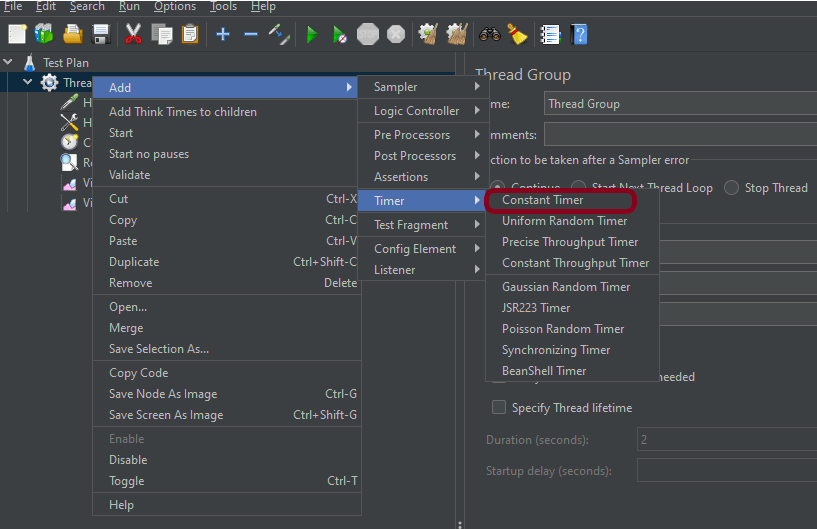
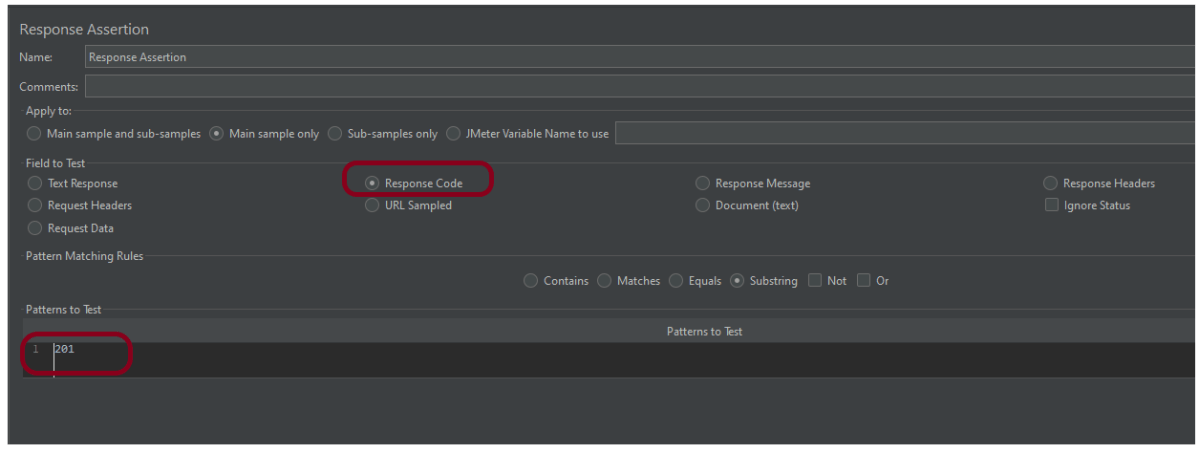
4. Add JSON Extractor
To extract the authentication token from the request, we are going to use JMeter JSON Extractor. The process of extracting a variable from a response works as mentioned below:
First, the server sends back a response. Then a post-processor, like the JSON Extractor, executes. It extracts part of the response and puts it into a variable like ${token}.
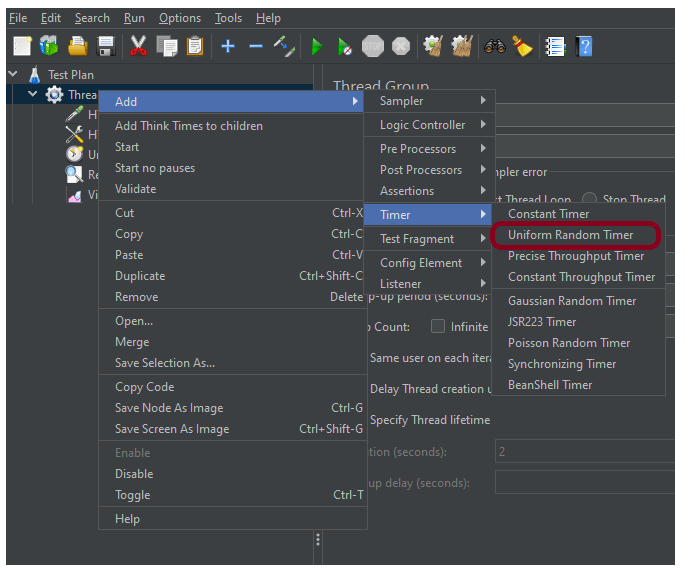
To add: Right-click on Thread Group and select: Add -> Post Processors -> JSON Extractor

The JSON extractor requires us to follow a few steps, so we can process the JSON correctly.
1) Name – JSON Extractor
2) Apply to – we will use the defaulted Main Sample Only. The option is: The main sample only – the assertion only applies to the main sample
3) Name of created variables – BEARER
4) JSON Path Expressions – access_token

5. Add BeanShell Assertion
An advanced assertion with full access to JMeter API. Java conditional logic can be used to set the assertion result.
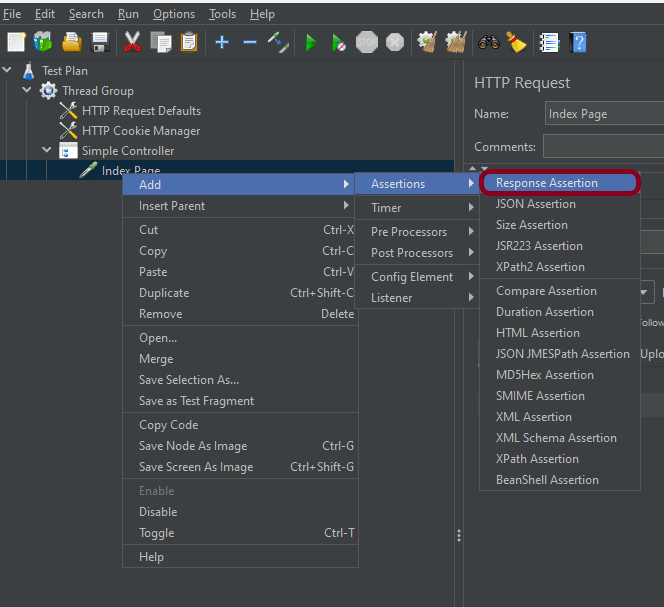
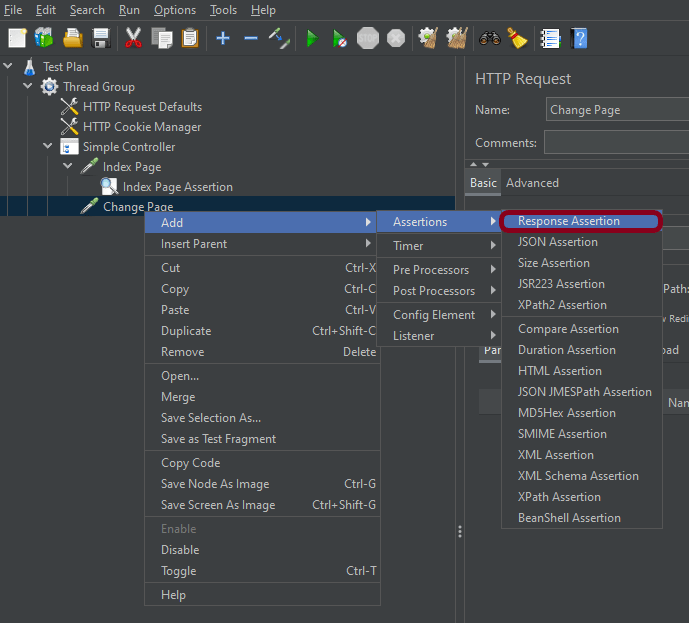
To add: Right-click on Thread Group and select: Add -> Assertions -> BeanShell Assertions

Add the below-mentioned script in the Script section of BeanShell Assertion
${__setProperty(BEARER, ${BEARER})};

Step 2 – Add Thread Group 2: Thread Group – Main Request
1. Add Thread Group
Provide a name to this Thread Group. I have also provided the number of threads, ramp-up, and duration in the thread group as shown in the image

We can parameterize the values of the number of threads. We can also do this for the ramp-up period and duration. This is done using a JMeter property called ___P. You can ask why we are using the property function in JMeter. It is because this makes the JMeter script configurable. We can pass any value through the command line without making any changes in the script.
___P – This is a simplified property function that is intended for use with properties defined on the command line.
If no default value is supplied, it is assumed to be 1. The value of 1 was chosen because it is valid for common test variables such as loops, thread count, ramp-up, etc.
${__P(group1.threads)} – return the value of group1.threads
${__P(THREADS,1)} – This THREADS value will be passed through command line. If no value is passed, by default, it will choose 1.
Similarly, ramp-up and duration are parameterized.
${__P(THREADS,1)}
${__P(RAMPUP,1)}
${__P(DURATION,1)}
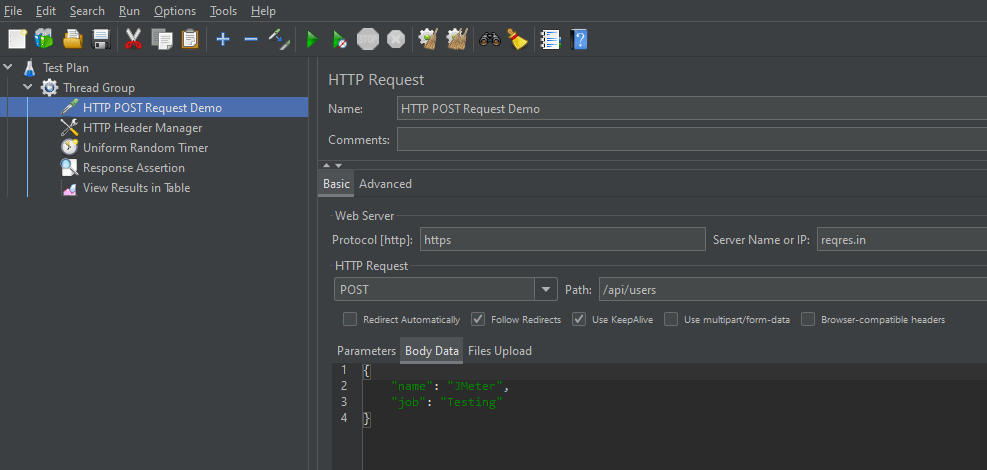
2. Add HTTP Request Sampler
Below-mentioned are the values used in HTTP Request to perform the test
Add a valid request body in the Body Data section (if the request is POST).

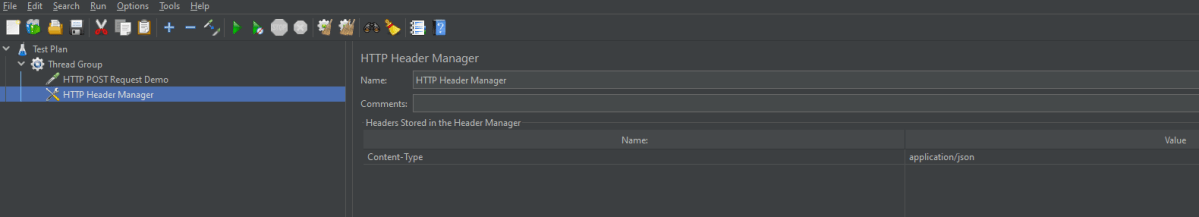
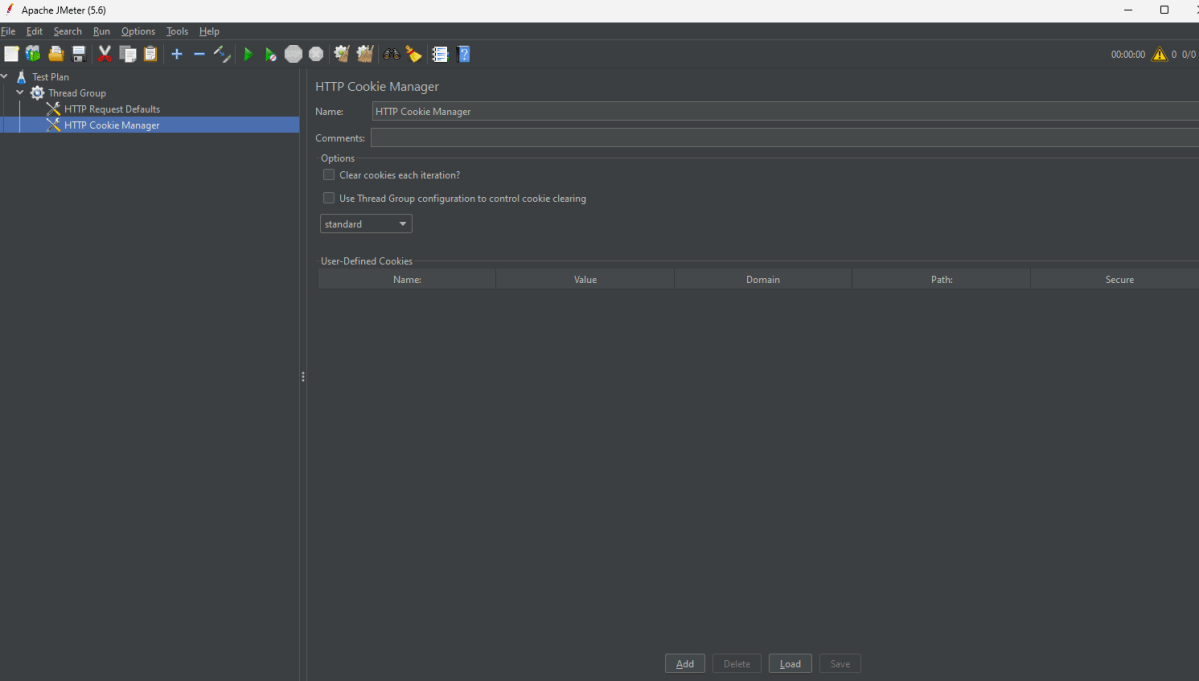
3. Add HTTP Header Manager
We have previously extracted the token from the Token Generation request. Now, it’s time to reuse it in the header section of HTTP Header Manager.
Below are the values used in the HTTP Request to perform the test.
Authorization = Bearer ${__property(BEARER)}

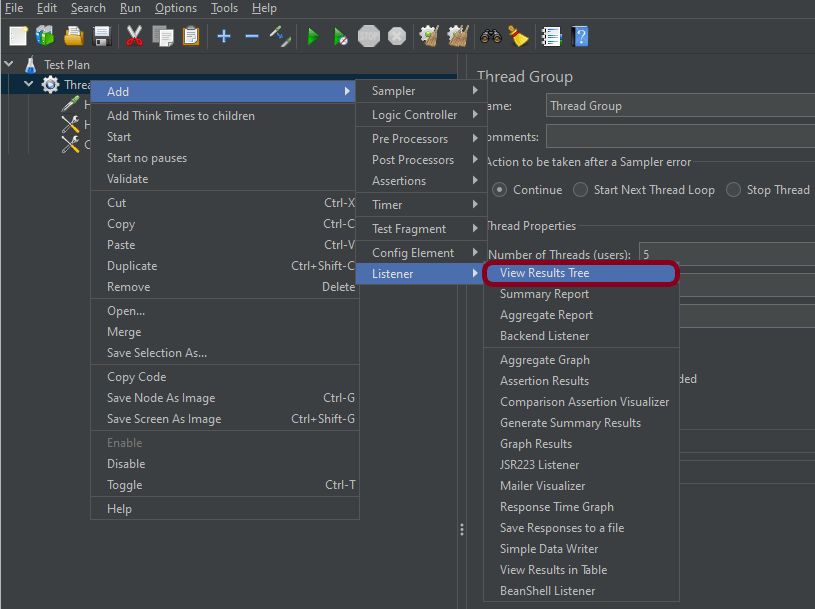
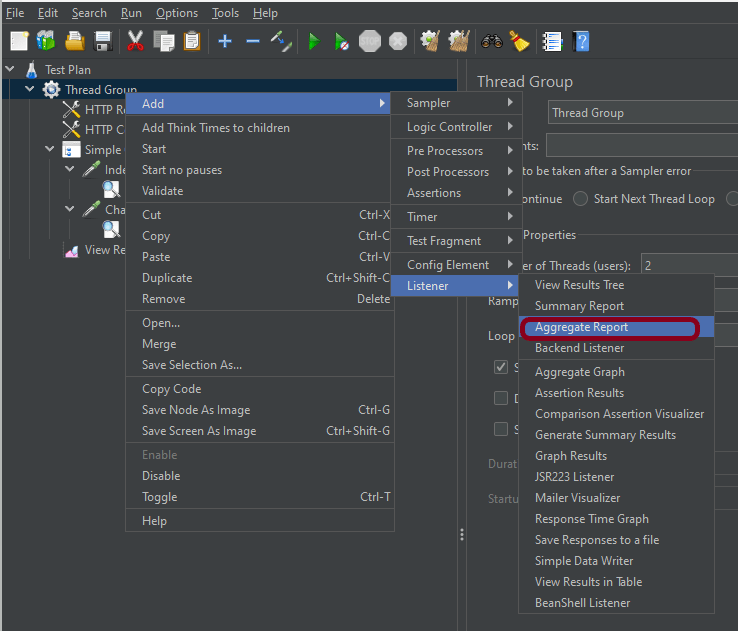
Step 3 – Adding Listeners to the Test Plan
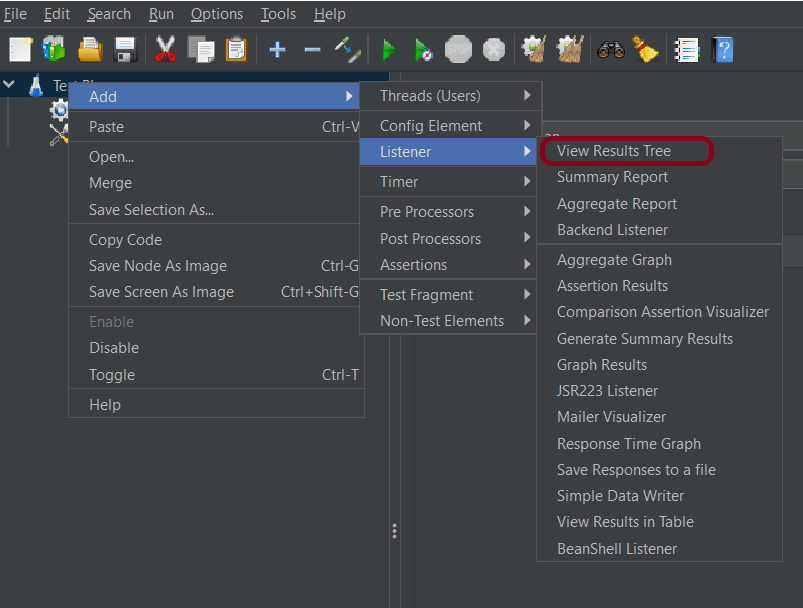
Listeners – They show the results of the test execution. They can show results in a different format such as a tree, table, graph, or log file
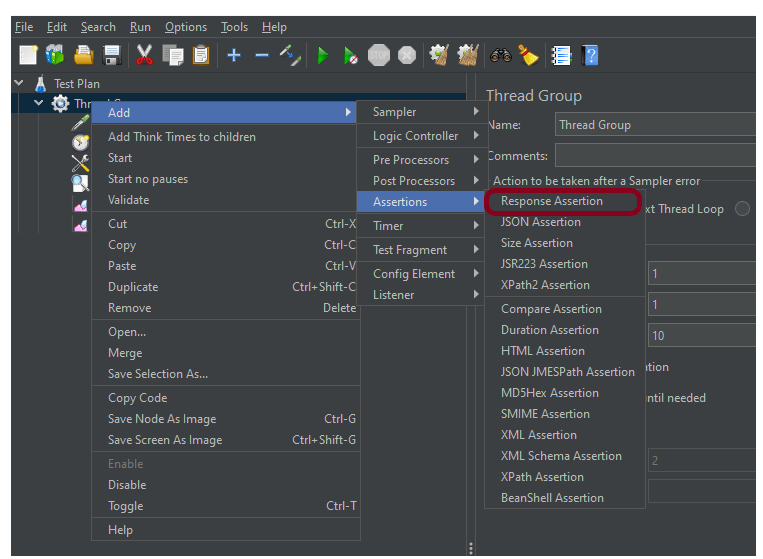
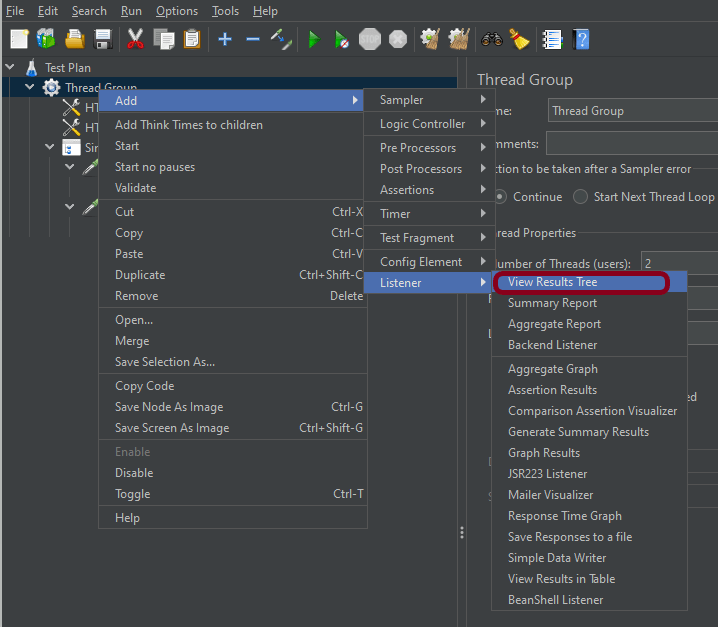
We have added listeners – View Result Tree
View Result Tree – View Result Tree shows the results of the user request in basic HTML format
To add: Right-click Test Plan, Add -> Listener -> View Result Tree

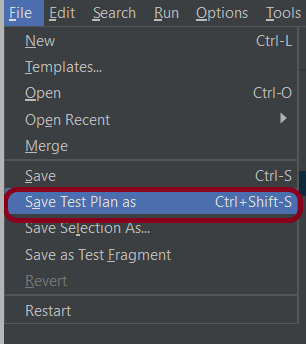
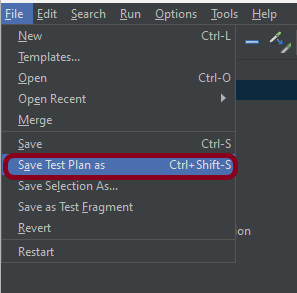
Step 4 – Save the Test Plan
To Save: Click File Select -> Save Test Plan as ->Give the name of the Test Plan. It will be saved as .jmx format.

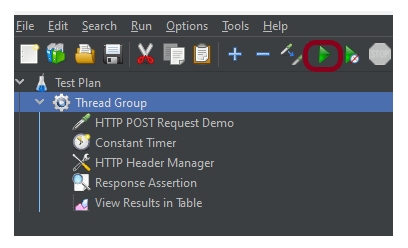
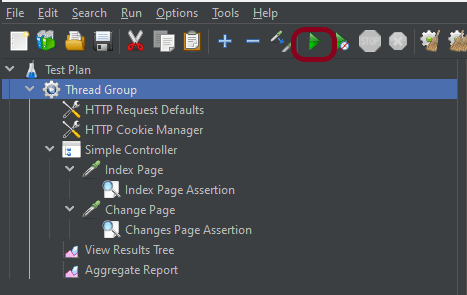
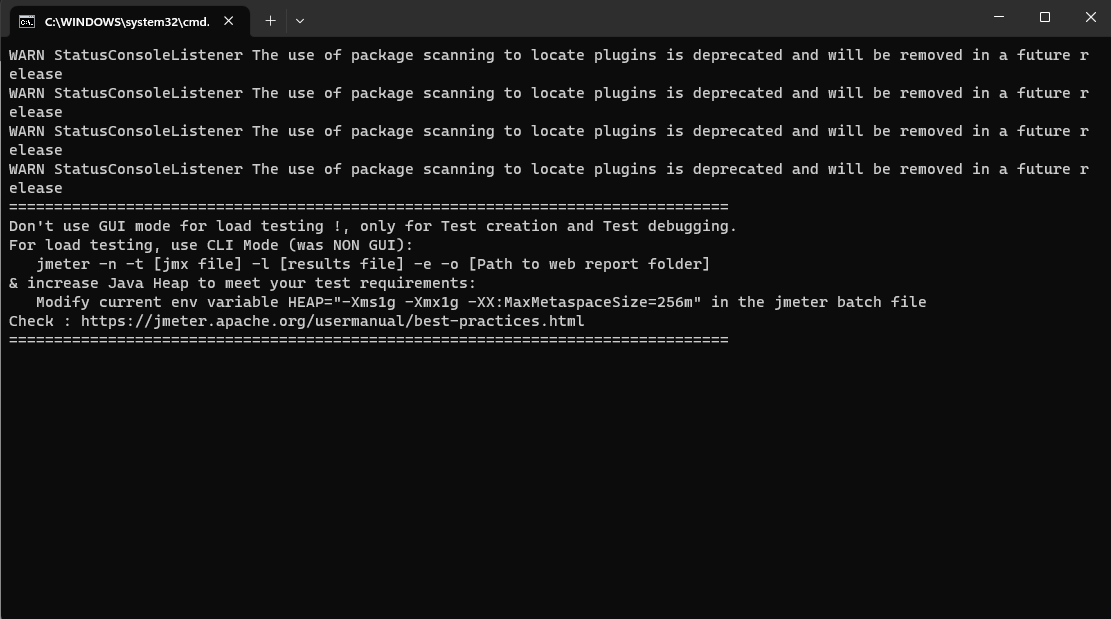
Step 5 – Run the Test Plan
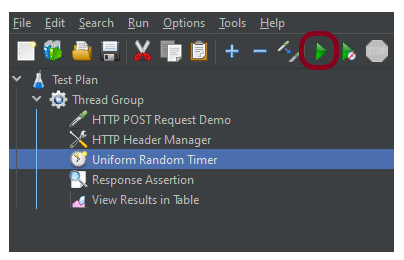
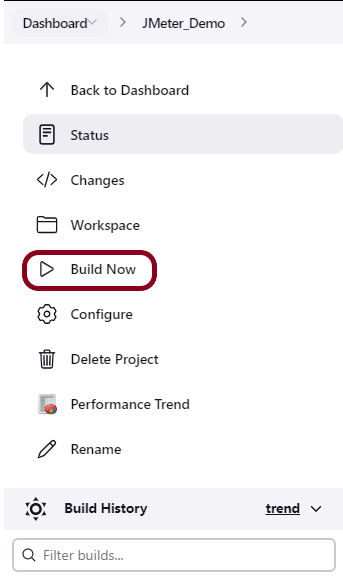
Click on Green Triangle as shown at the top to run the test.
Step 6 – View the Execution Status
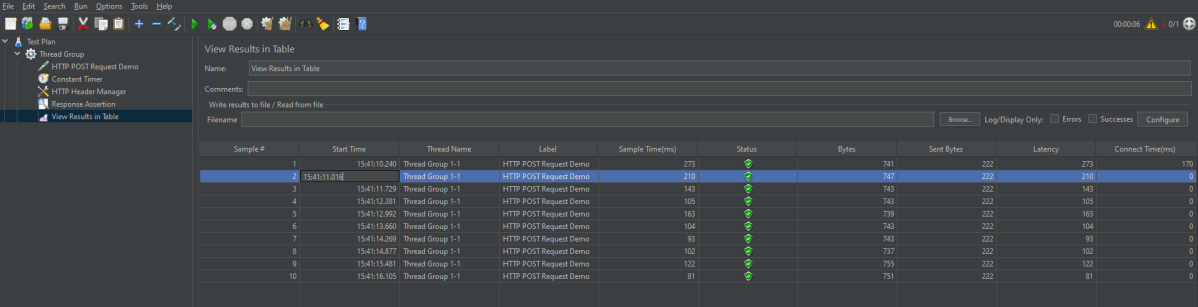
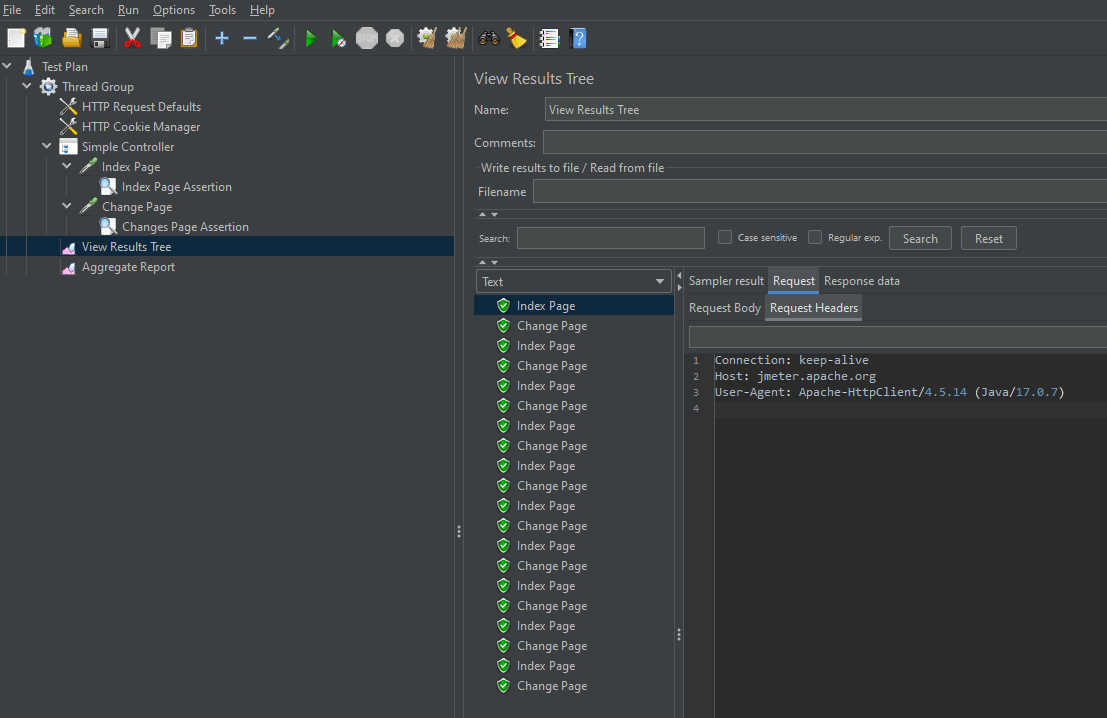
Click on View Result Tree to see the status of Run. A successful request will be of a Green colour in the Text Section
Here, we can see that the Token Generation request is successfully processed.

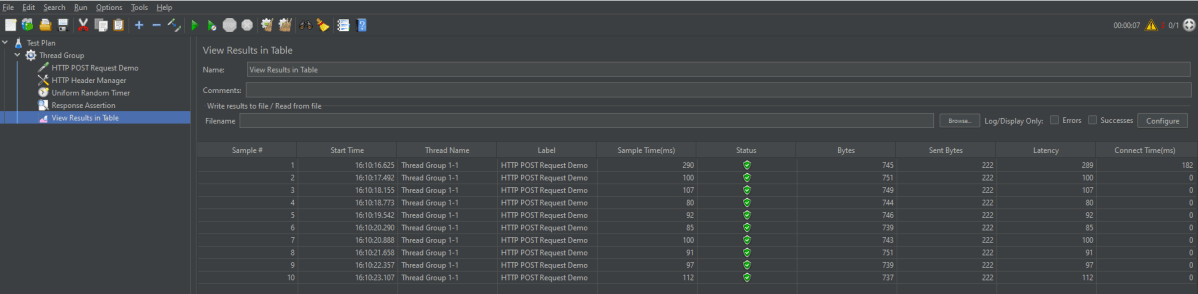
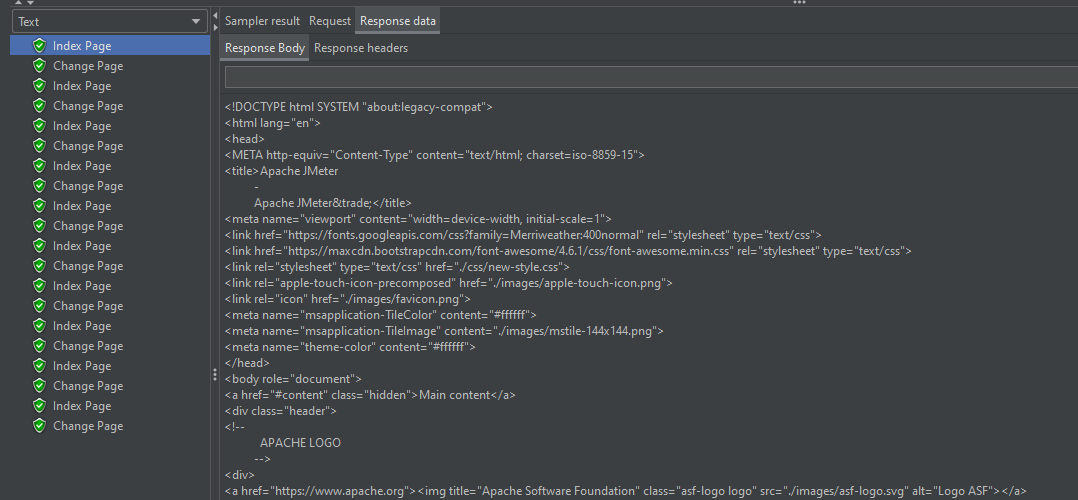
The below image shows that the Main Request is successfully executed too.

Troubleshooting
Correct Authorization Setup
In JMeter, typically, we will use an HTTP Header Manager to include your access token in requests. Make sure the token is formatted correctly: `Authorization: Bearer `.
Understand the Authorization Type
Make sure correct type of authorization is required (e.g., Bearer Token) and how the access token should be included in requests (usually in the headers).
Network and Endpoint Checks
Check for firewall rules or network issues that might be blocking access.
Congratulation!! We can add an authorization token generated by a request add it to another request and process the request using JMeter.
Additional Tutorials


