Last Updated On
In this tutorial, we will discuss the Constant Timer in JMeter and its use in Load Testing.
Table of Contents
What is Constant Timer?
Constant Timer is used to delay the next request by a constant time which you can configure by adding the value of constant delay time.
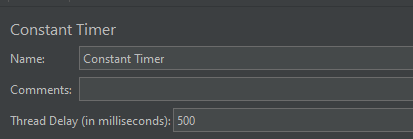
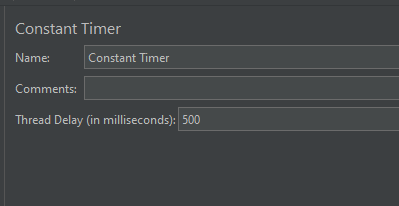
Constant Timer has the following input fields:
- Name: To provide the name of the timer. This is a non-mandatory field.
- Comments: To provide arbitrary comments (if any). This is a non-mandatory field.
- Thread Delay (in milliseconds): The pause time in milliseconds. Thread(s) will hold the execution of the sampler/request for the defined time and once the delay time is over then the sampler will be executed. This is a mandatory field.
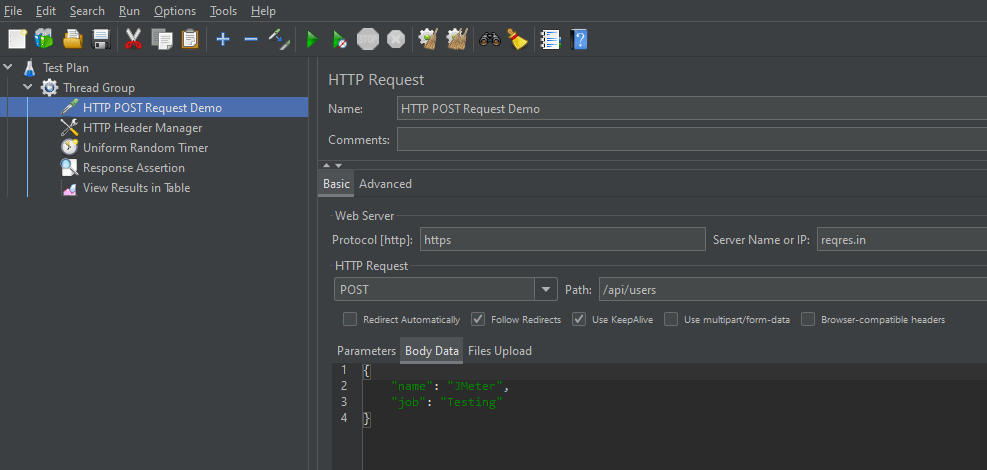
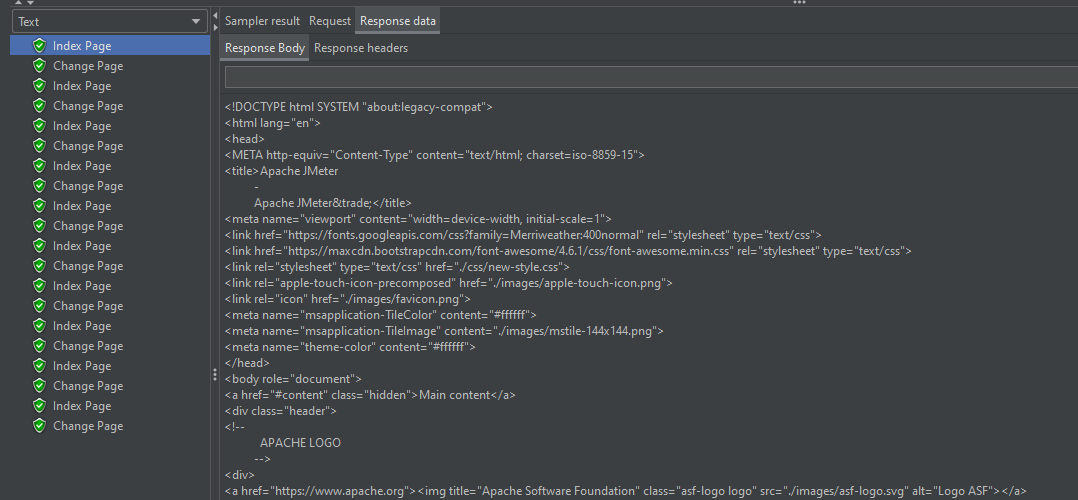
The sample request and response used in this tutorial is shown below:
Sample Request
{
    "name": "JMeter",
    "job": "Testing"
}
Sample Response
{
  "name":"JMeter",
  "job":"Testing",
  "id":"809",
  "createdAt":"2023-07-27T18:46:18.038Z"
}
Create a Test Plan in JMeter
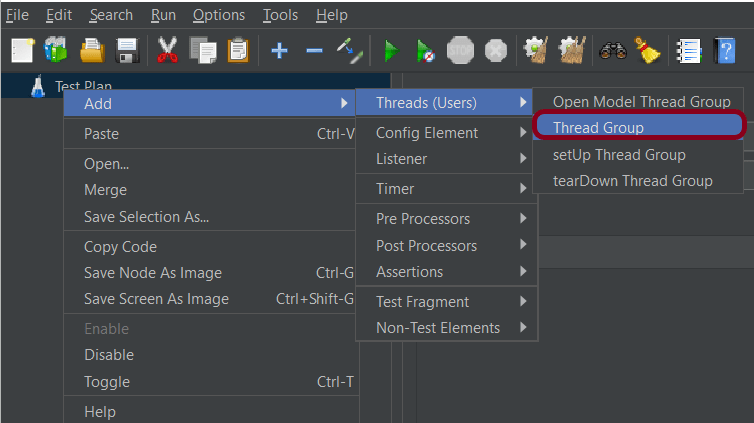
Step 1 – Add Thread Group
- Select Test Plan on the tree
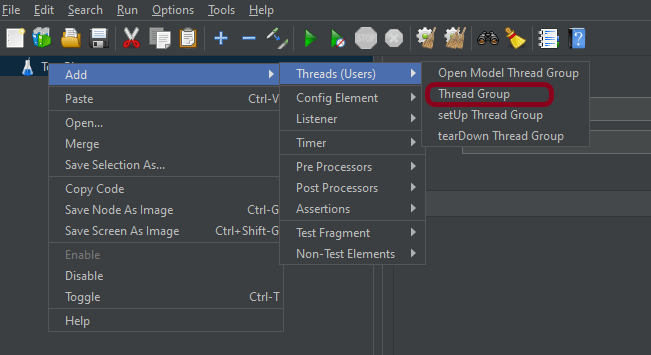
- Add Thread Group To add Thread Group: Right-click on the “Test Plan” and add a new thread group: Add -> Threads (Users) -> Thread Group

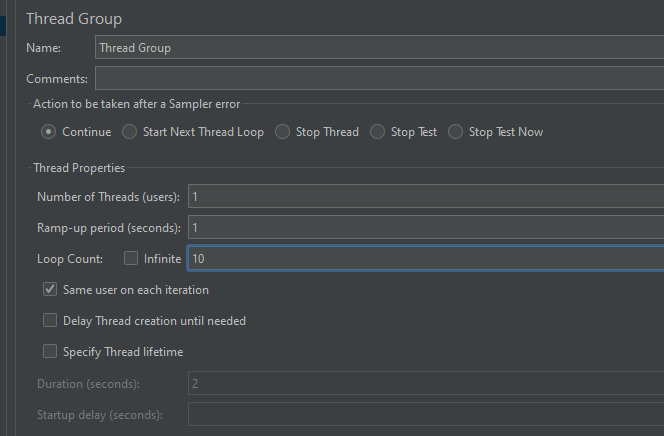
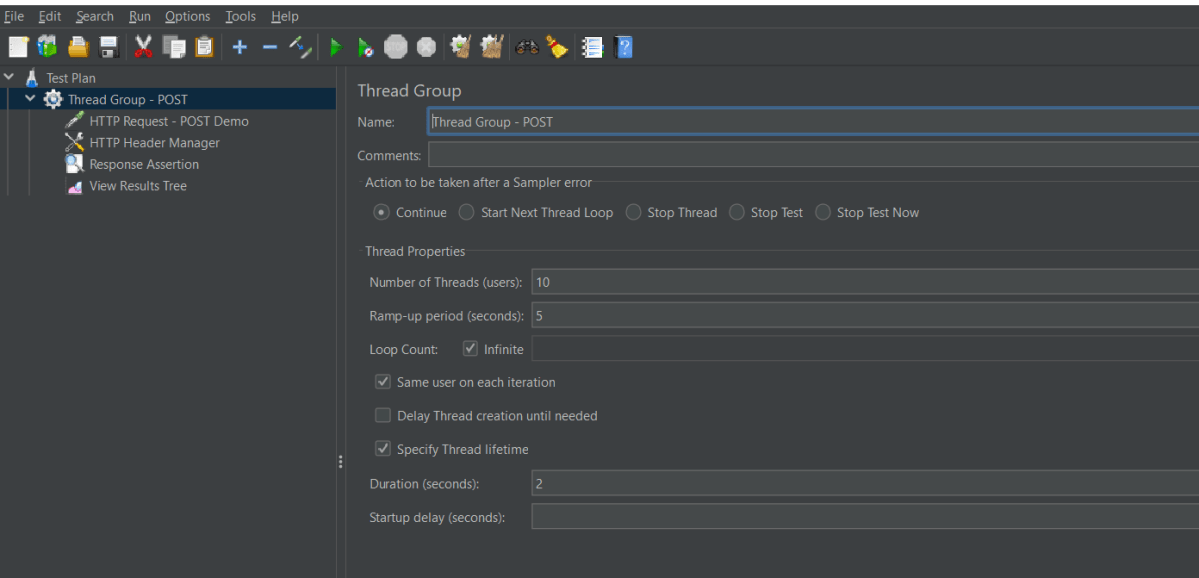
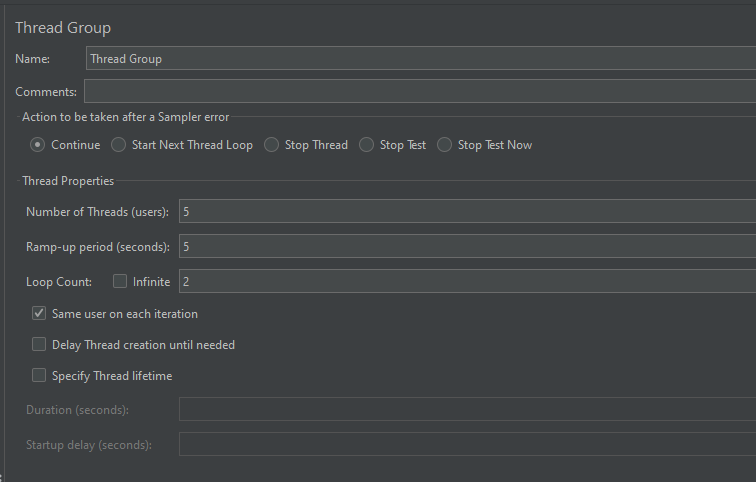
In the Thread Group control panel, enter Thread Properties as follows: We will take an example of row no 5
Number of Threads: 1 – Number of users connects to the target website
Loop Count: 10 – Number of times to execute testing
Ramp-Up Period: 1 – It tells JMeter how long to delay before starting the next user. For example, if we have 5 users and a 5 -second Ramp-Up period, then the delay between starting users would be 1 second (5 seconds /5 users).
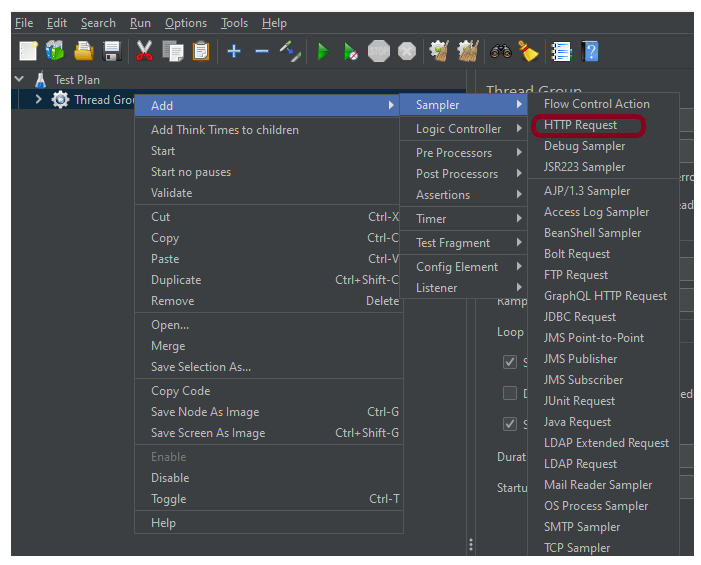
Step 2 – Add HTTP Request Sampler
The JMeter element used here is HTTP Request Sampler. In HTTP Request Control Panel, the Path field indicates which URL request you want to send
Add HTTP Request Sampler
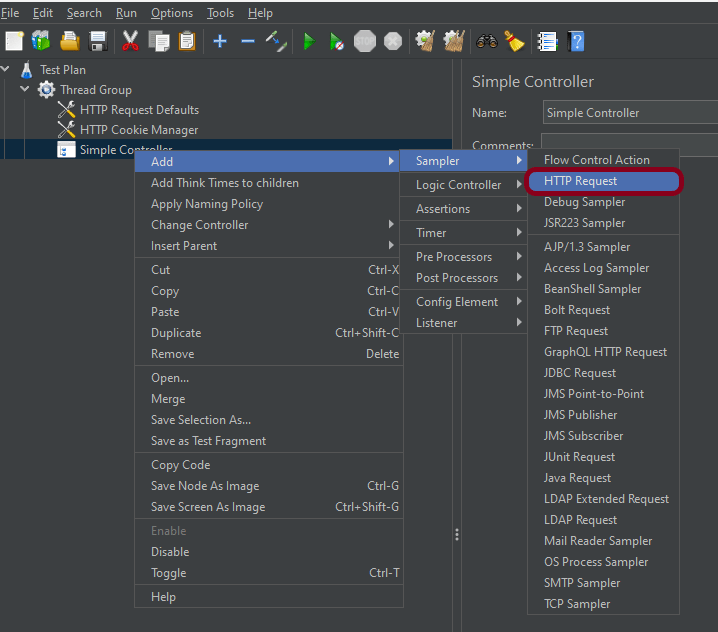
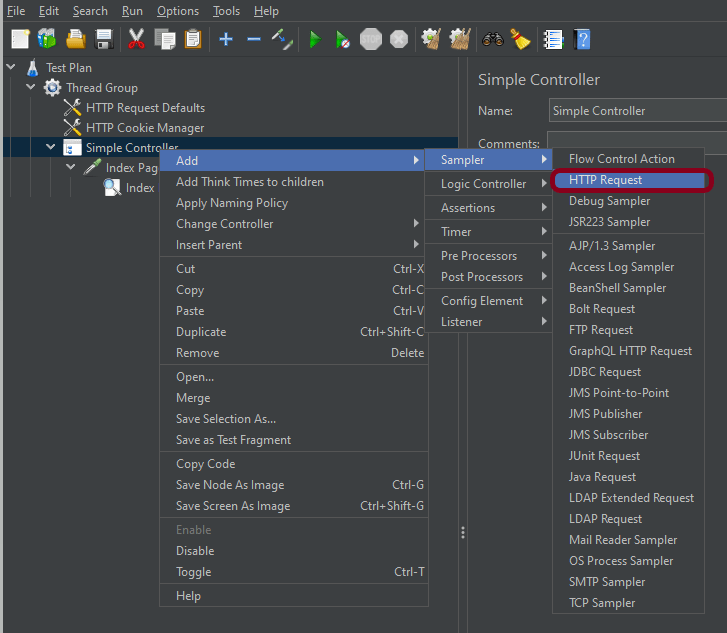
To add: Right-click on Thread Group and select: Add -> Sampler -> HTTP Request

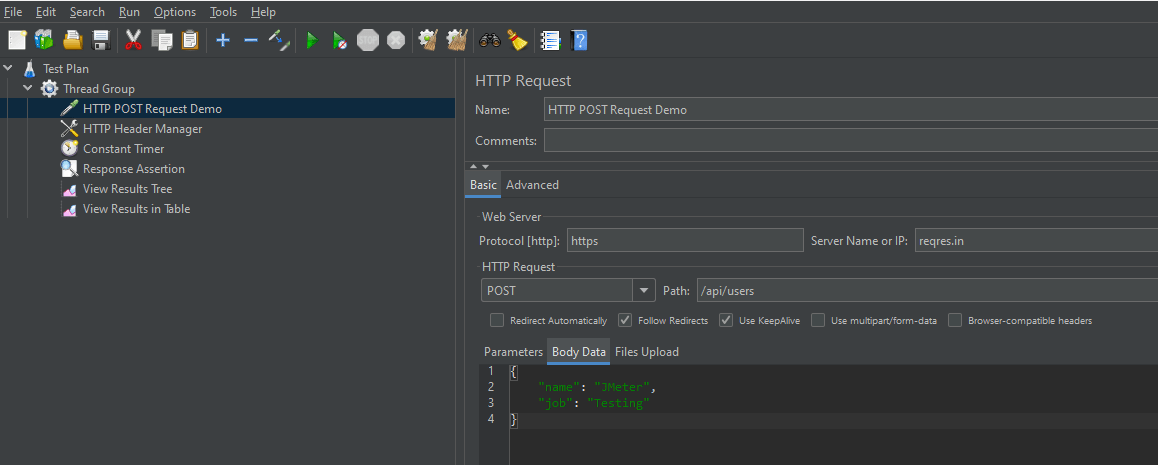
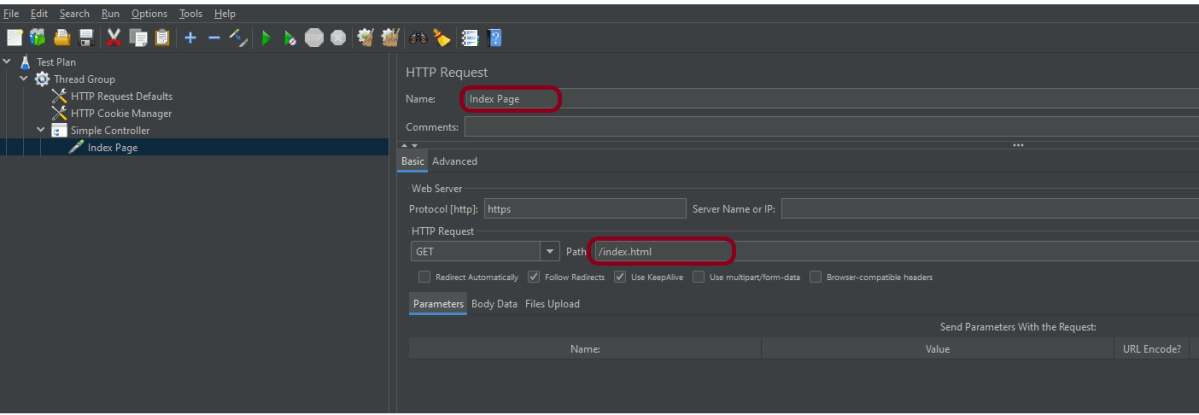
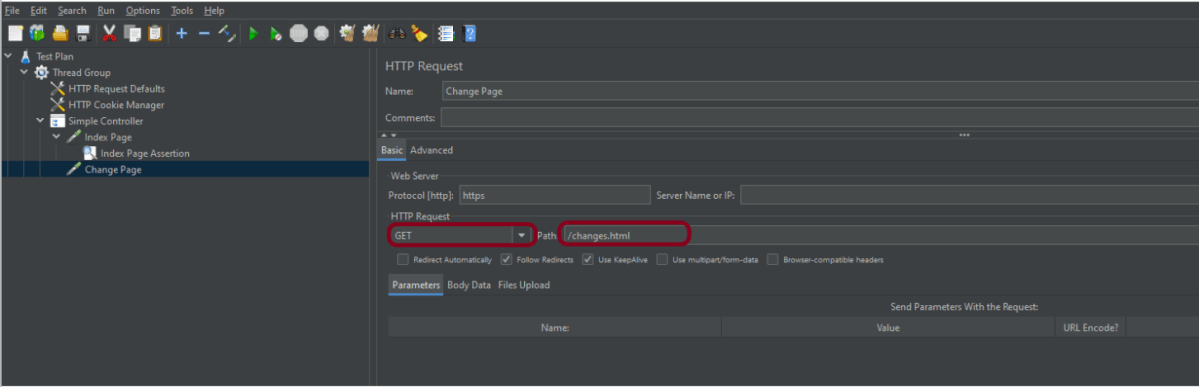
The below-mentioned are the values used in HTTP Request to perform the test
- Name – HTTP POST Request Demo
- Server Name or IP – reqres.in
- Protocol – https
- Method – POST
- Path – /api/users
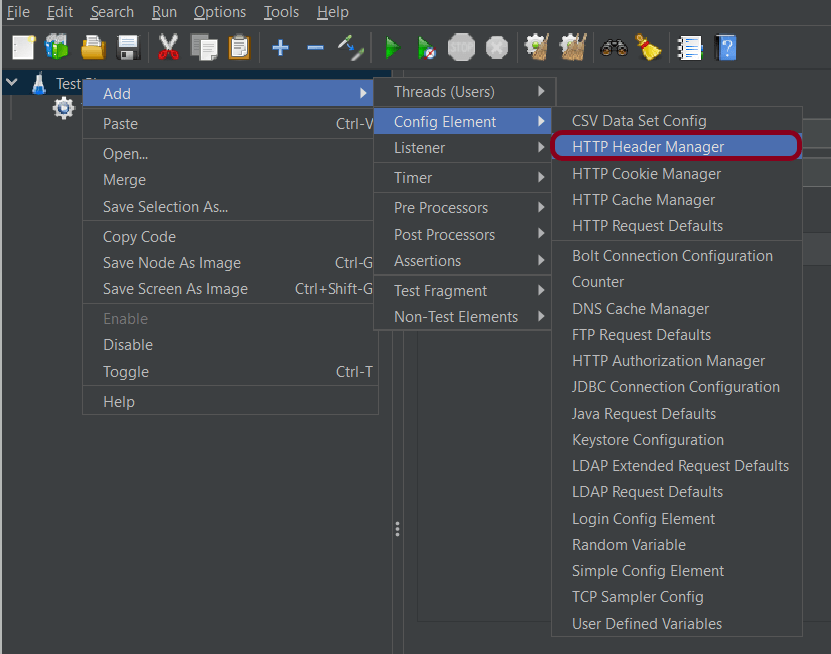
Step 3 – Add HTTP Head Manager
The Header Manager lets you add or override HTTP request headers like can add Accept-Encoding, Accept, Cache-Control
To add: Right-click on Thread Group and select: Add -> Config Element -> HTTP Read Manager
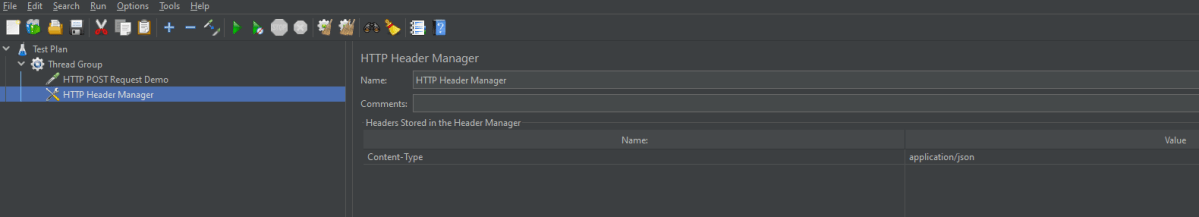
The below-mentioned are the values used in Http Request to perform the test
Content-type = application/json

Below is the image once HTTP Header Manager is added to the Test Plan.

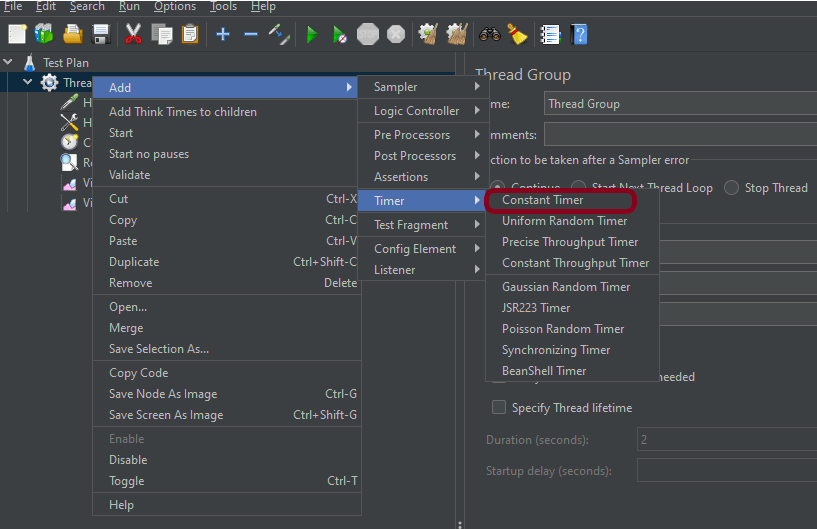
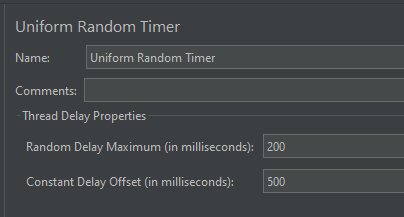
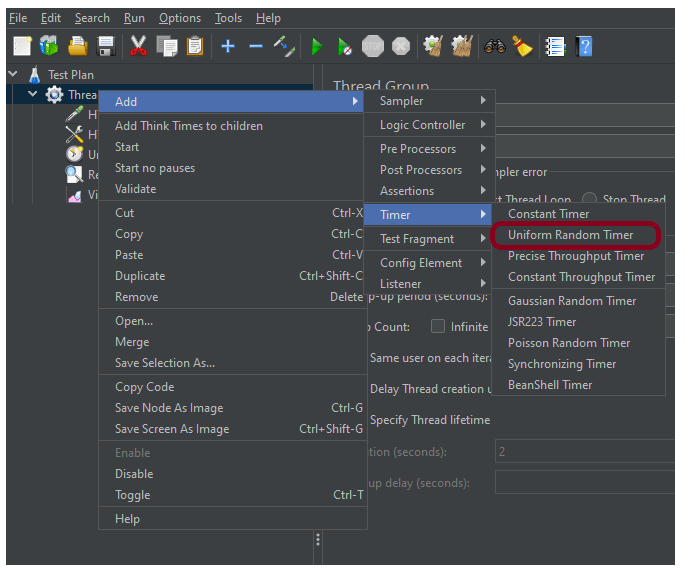
Step 4 – Add a Constant Timer
I want to have each thread pause for the same amount of time (500ms) between requests. So, configure Constant Timer.
To add: Right-click on Thread Group and select: Add -> Timer -> Constant Timer
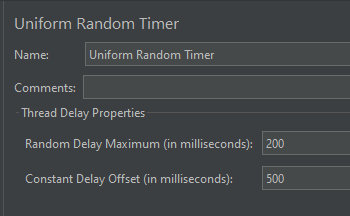
Configuring Thread Delay of 500 milliseconds
Step 5 – Adding Response Assertion to Test Plan
The response assertion control panel lets you add pattern strings to be compared against various fields of the request or response.
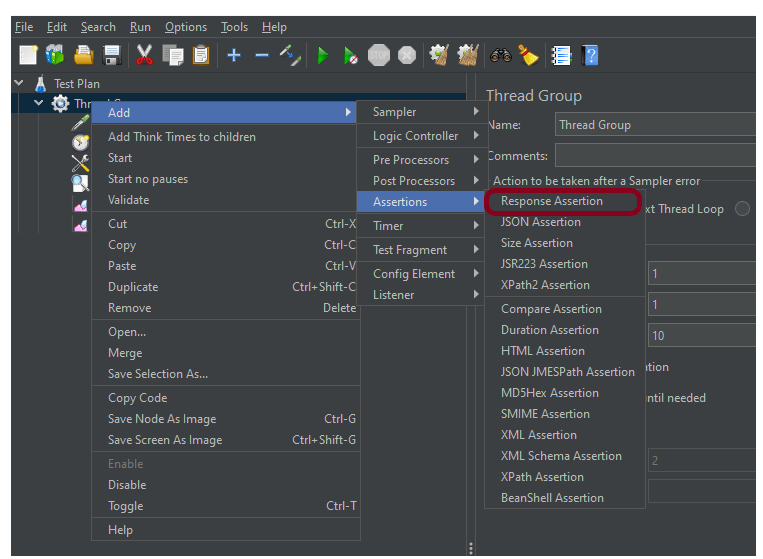
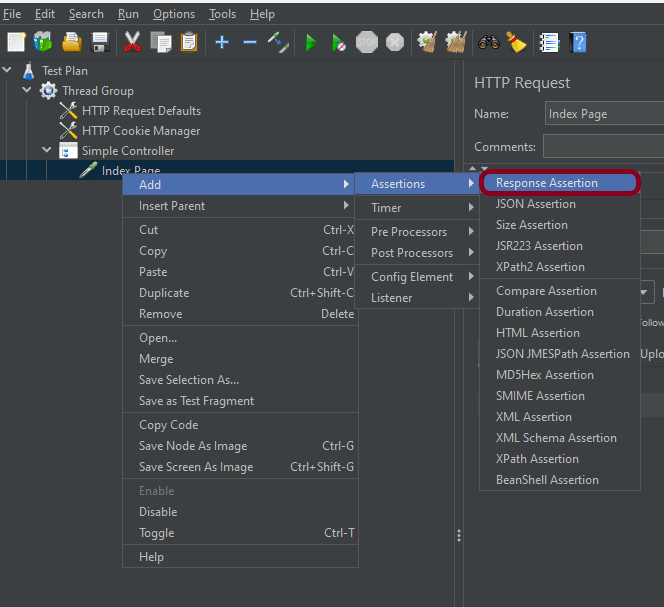
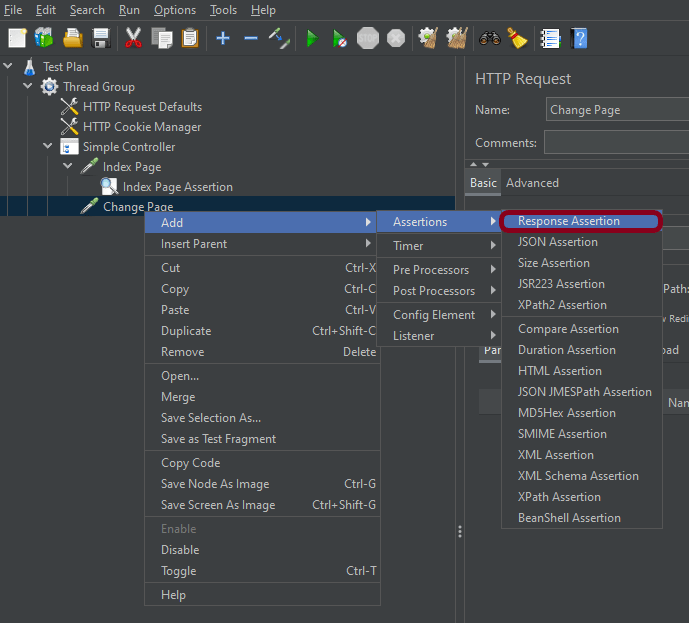
To add: Right-click on HTTP Request and select: Add -> Assertions-> Response Assertions
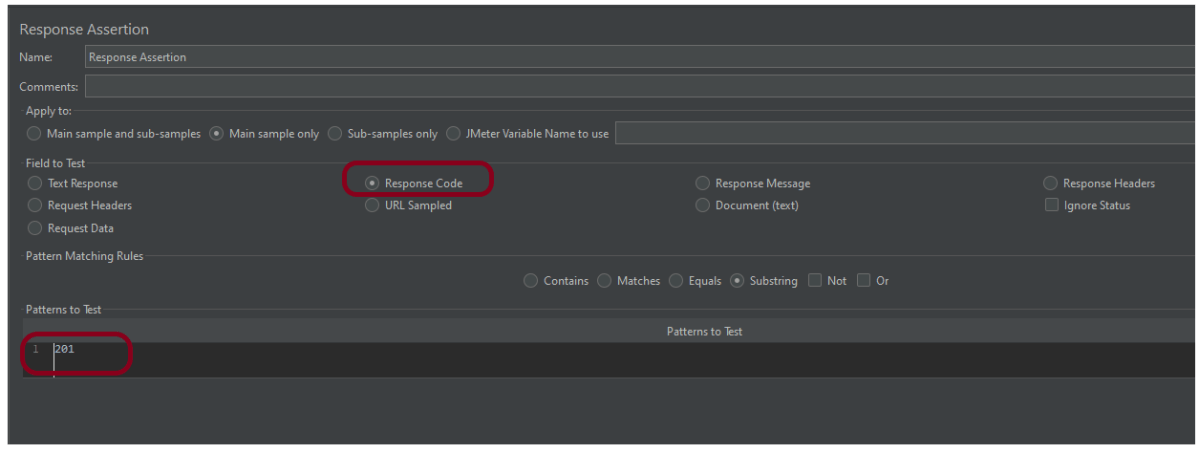
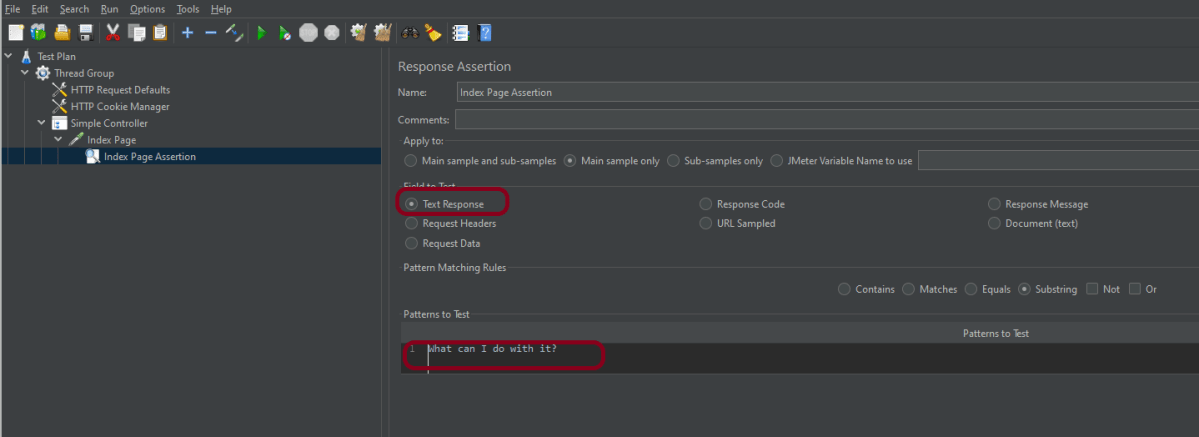
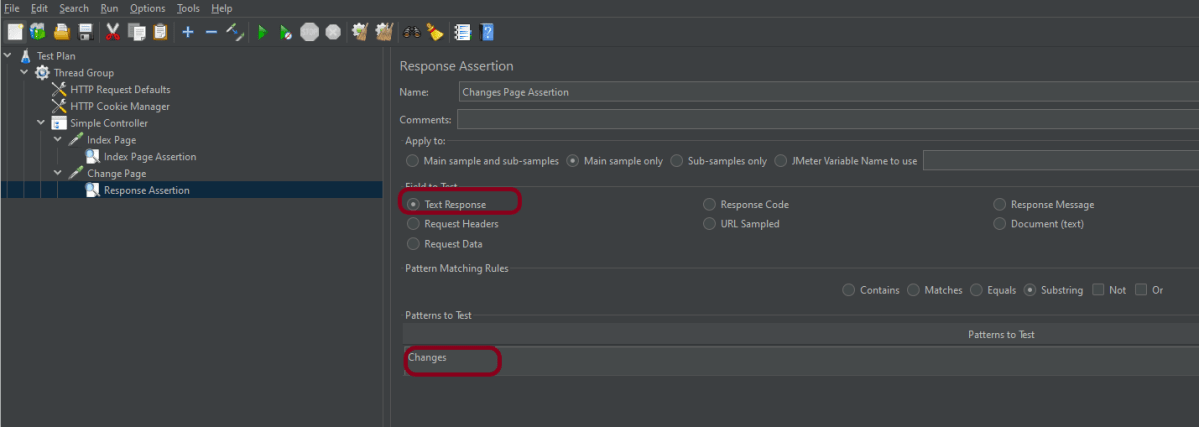
Here, I have selected the below options:-
Apply to: Main Sample only
Field to Test: Response Code
Pattern Matching Rules: Substring
Pattern To Test: 201
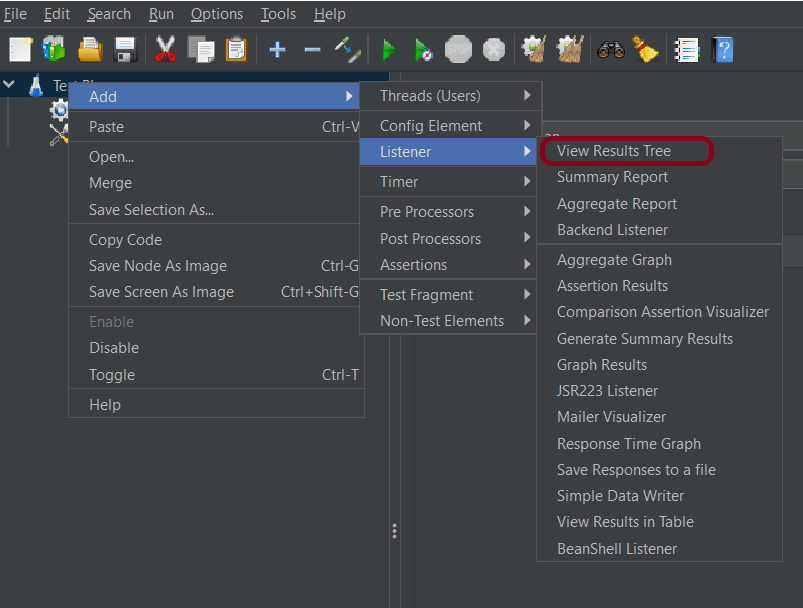
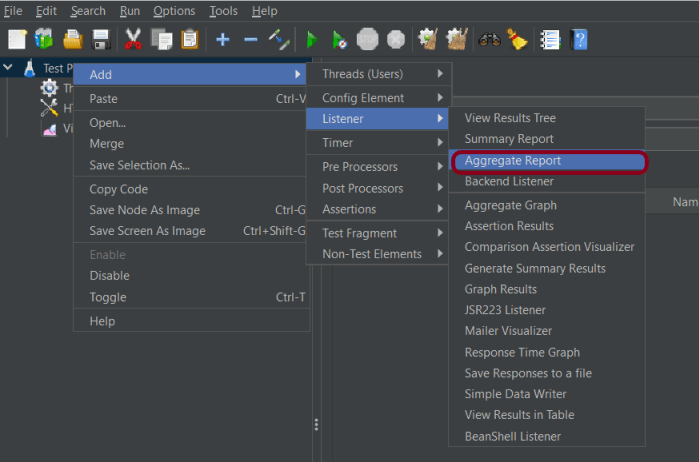
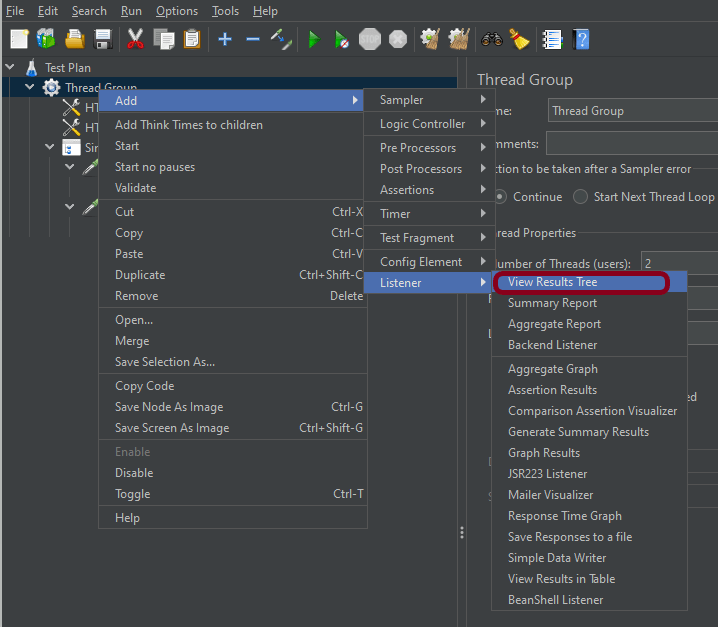
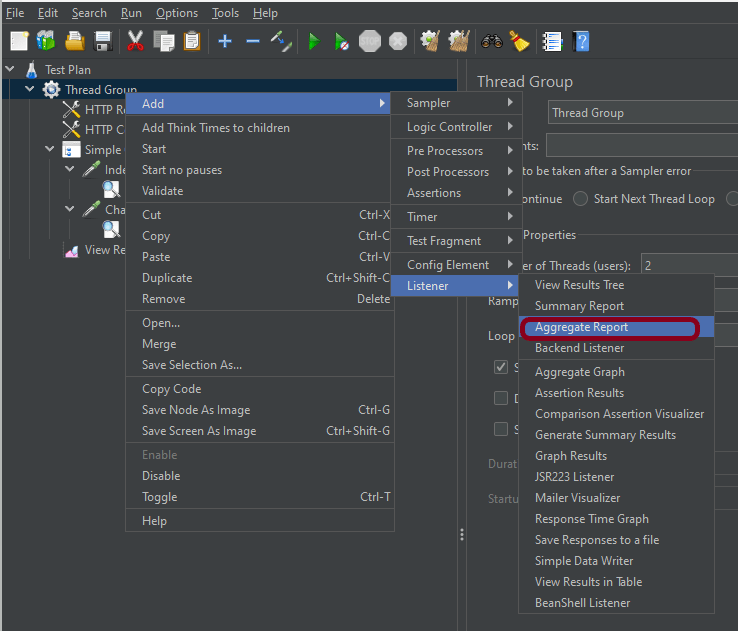
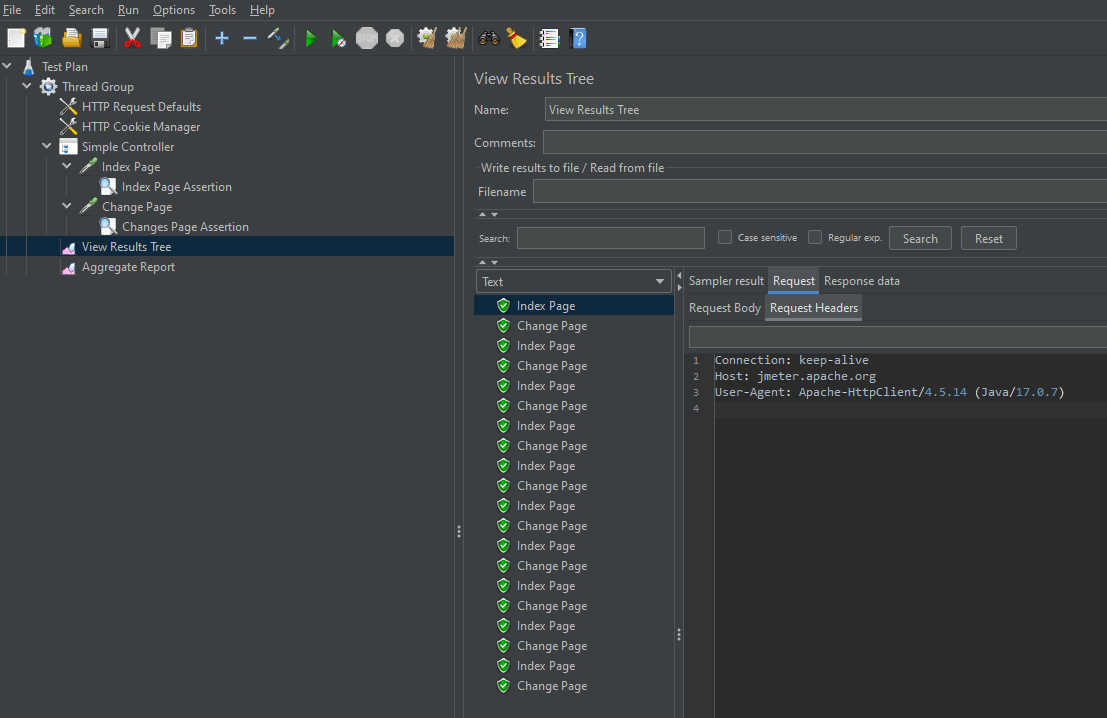
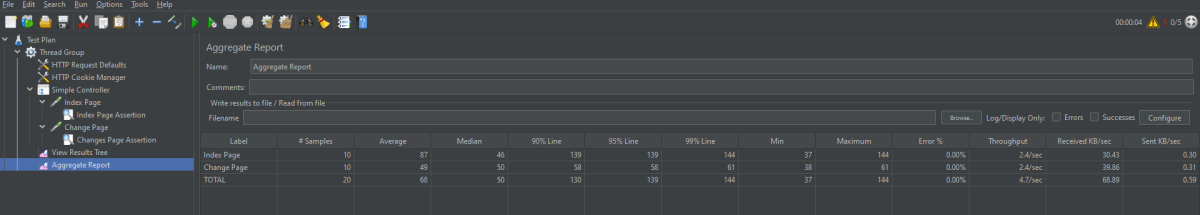
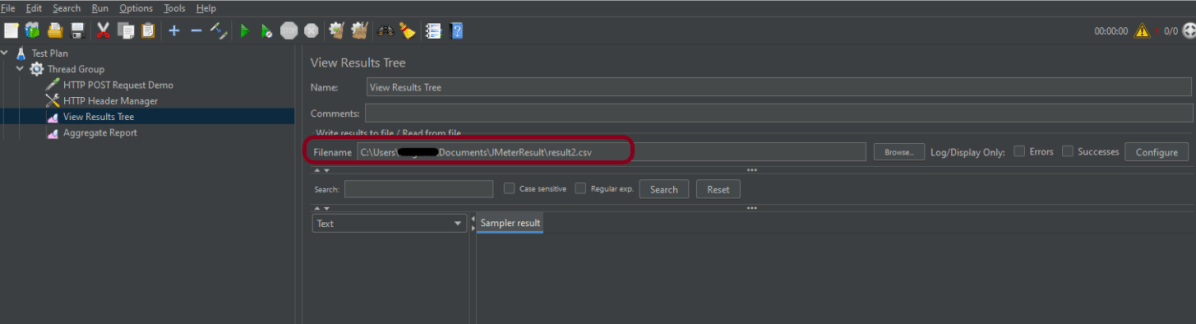
Step 6 – Adding Listeners to Test Plan
Listeners – They show the results of the test execution. They can show results in a different format such as a tree, table, graph, or log file
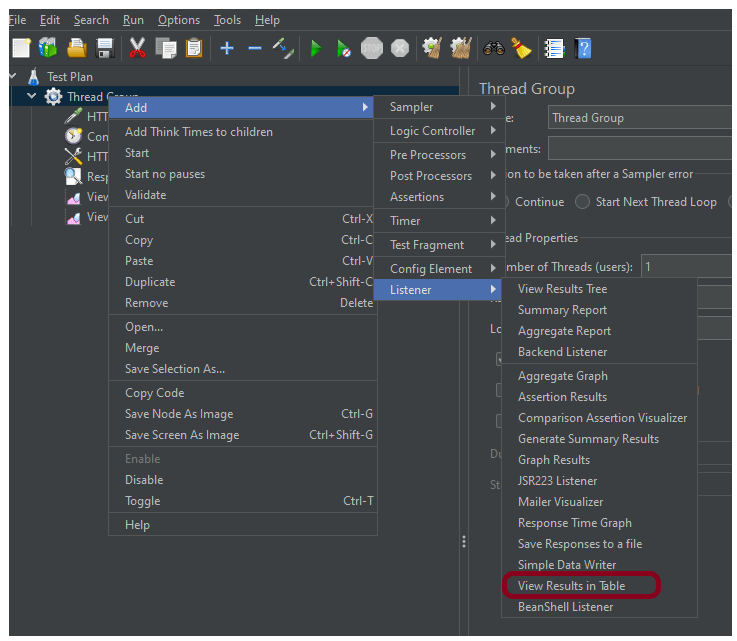
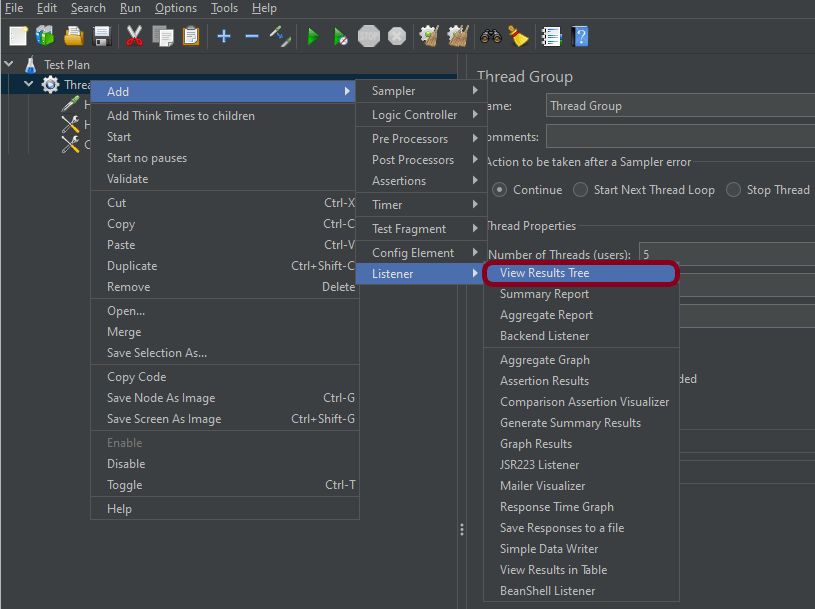
We are adding the View Result in Table
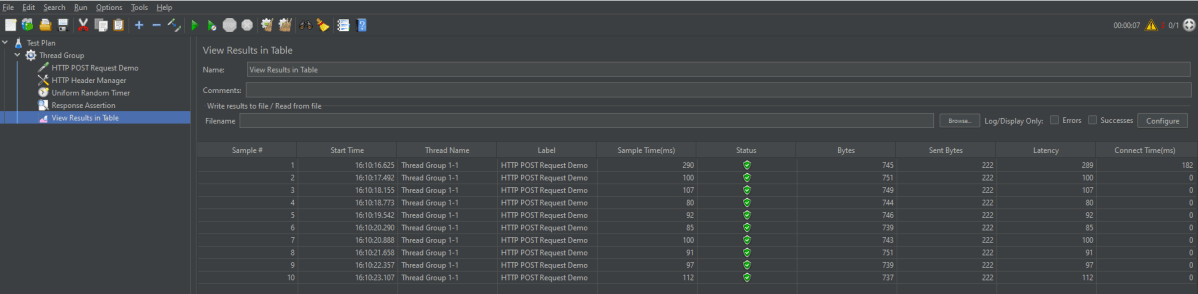
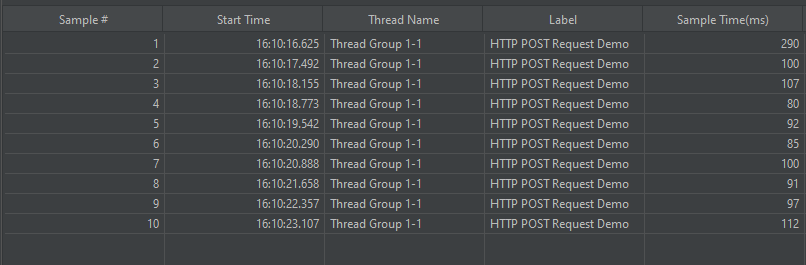
View Result in Table – The View Result in Table listener displays information about each sample in the form of a table.
To add: Right-click on Test Plan, Add -> Listener -> View Result in Table
Note – Don’t use “View Results Tree” or “View Results in Table” listeners during the load test, use them only during the scripting phase to debug your scripts.
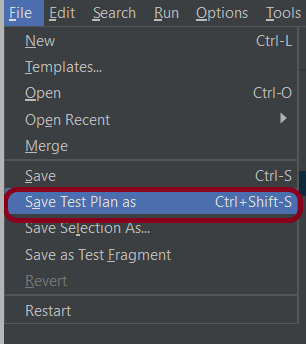
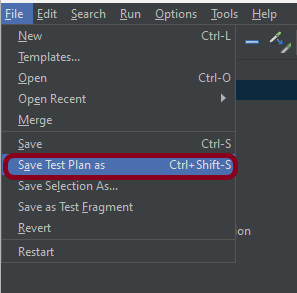
Step 7 – Save the Test Plan
To Save: Click File Select -> Save Test Plan as ->Give the name of the Test Plan. It will be saved in .jmx format.

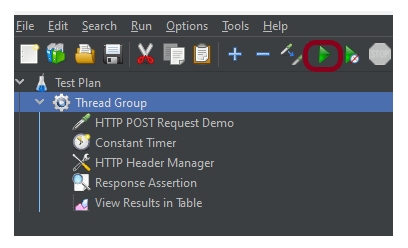
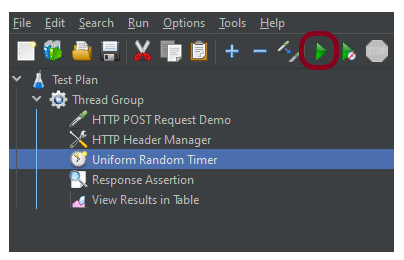
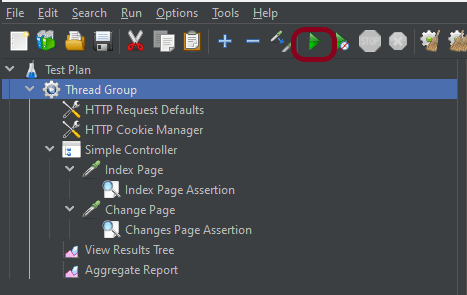
Step 8 – Run the Test Plan
Click on the Green Triangle as shown at the top to run the test.
Step 9 – View the Execution Status
Click on View Result in Table to see the status of Run. A successful request will be of a Green colour in the Text Section.
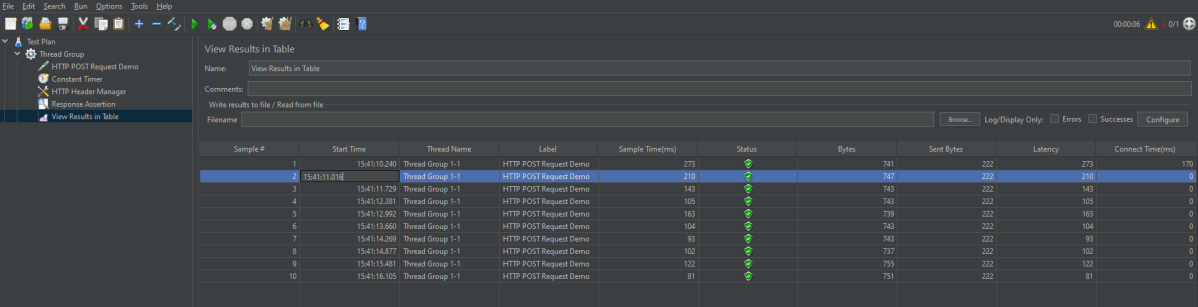
For example, in the above figure, let’s analyse Sample 2.
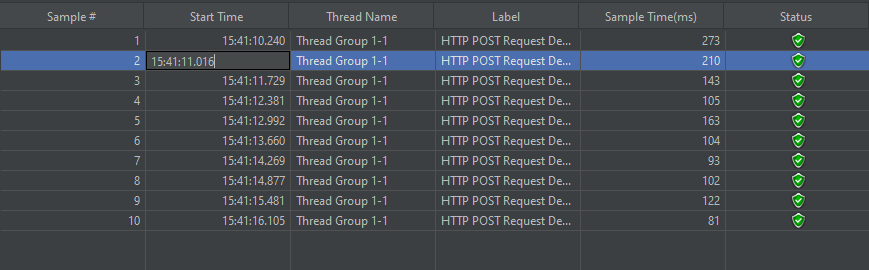
- Start time is 15:41:10.240
- Sample Time of Sample 1 is 273 ms
- Constant Timer: 500 ms (as configured)
- End Time of this sample is = 15:41:10.240 + 273 + 500 = 15:41:11.013
So Sample 2 should start at the time is 15:41:11.014 (As shown in the above figure – approximately started at 16).
We are done! Congratulations on making it through this tutorial and hope you found it useful! Happy Learning!!
Additional Tutorials


