The API chaining method is to create a sequence of API calls where the output of one API request is used as the input for the next. The technique is an automated and efficient way of executing a Multistep Process.
We will learn to get a response from one API and pass it as a request parameter in another API.
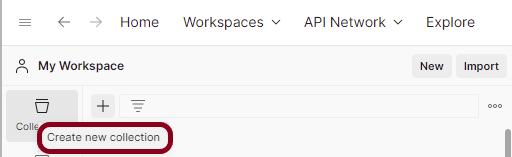
How to create a Collection?
Step 1: Create a Collection, click on Collections, and then click on the “+” plus button.
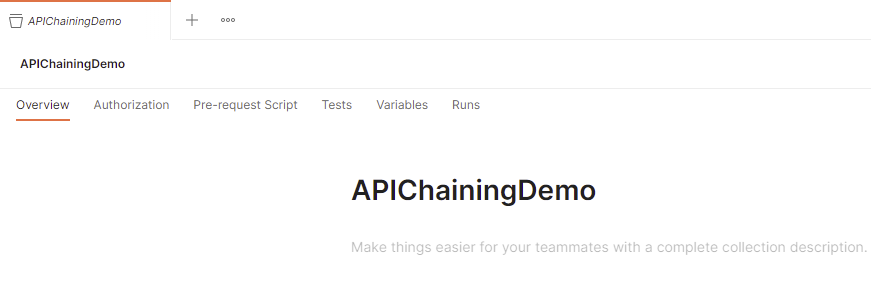
Step 2: Provide a name to the collection – “APIChainingDemo”.
Add 2 requests in the Postman
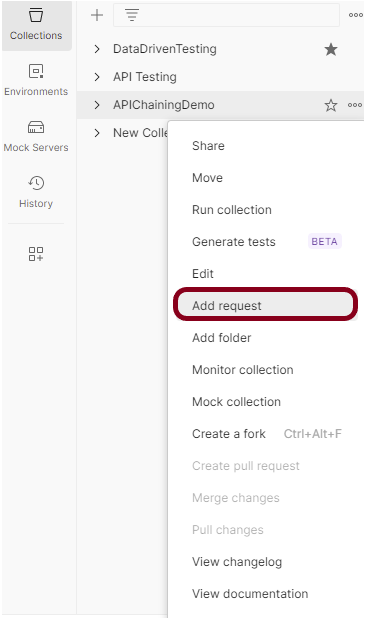
Step 1: To add new requests to the collection, click on Collection and click Add requests (please note it’s also possible to create a request first and then add it to the collection, as well as move-in requests from one collection to another).
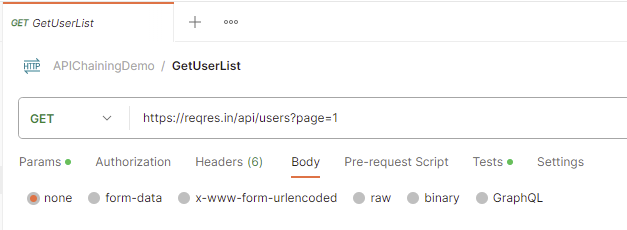
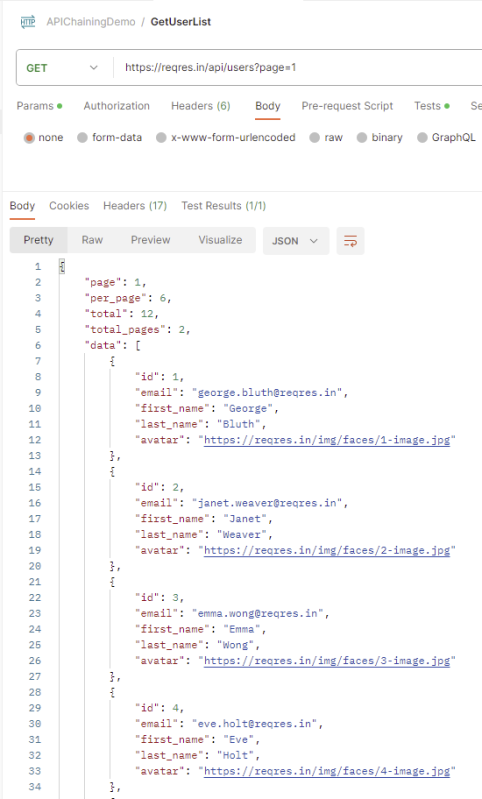
Request 1
https://reqres.in/api/users?page=1
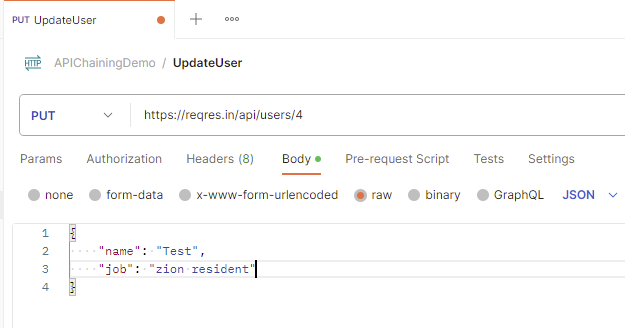
Request 2
https://reqres.in/api/users/4
Request Body
{
    "name": "Test",
    "job": "zion resident"
}
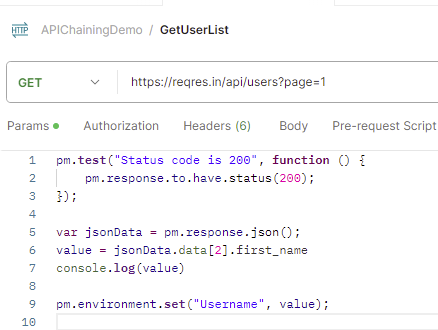
Below is the image of the first request in the collection.
The output of the first response is
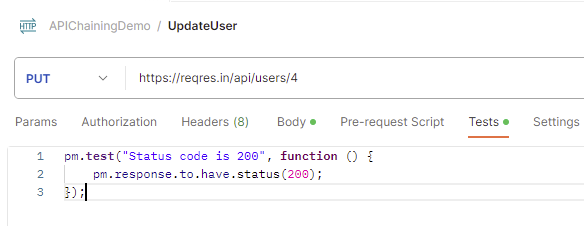
Below is the image of the second request in the collection.
Use Environment variables to parameterize the value to be referred
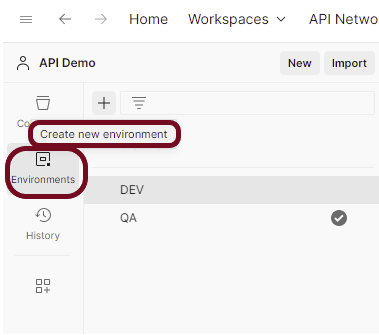
Select Environmentson the left and select +.
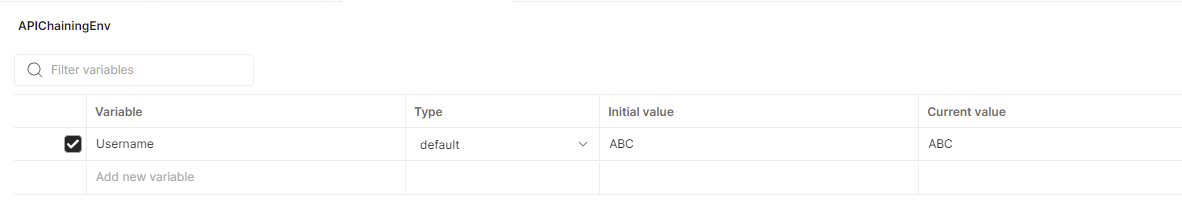
Enter a name for your environment, and initialize it with any variables you need. You can also specify variables for the environment later.
In the Keyfield, enter the name of the environment variable that will be used in the Postman Collection. In the Valuefield, enter the value that will replace the variable when the call is made. For example:
Add scripts to fetch the value from the response of the first API.
Go to the Test tab of the first request and add the script to get the value of first_name.
The first test will check if the status code for the first response is 200.
The second test will fetch the value of the 3rd first_name from the response.
The third test will assign the value fetched in the previous script to the “Username” variable.
pm.test("Status code is 200", function () {
    pm.response.to.have.status(200);
});

var jsonData = pm.response.json();
value = jsonData.data[2].first_name
console.log(value)

pm.environment.set("Username", value);
Go to the Test tab of the second request and add the script to verify the status code.
pm.test("Status code is 200", function () {
    pm.response.to.have.status(200);
});
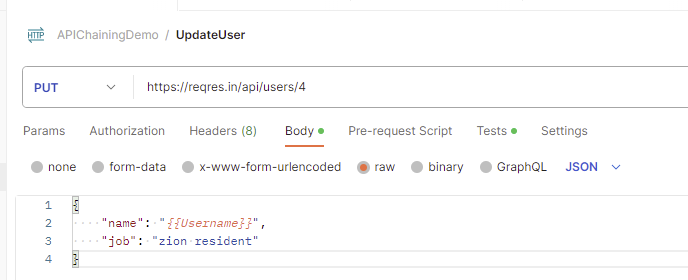
Update the fetched values in the env variables
Go to the new request and select the environment created just now. In this case, I have selected “APIChainingEnv” environment. Replace the hard code value of first_name with {{Username}}.
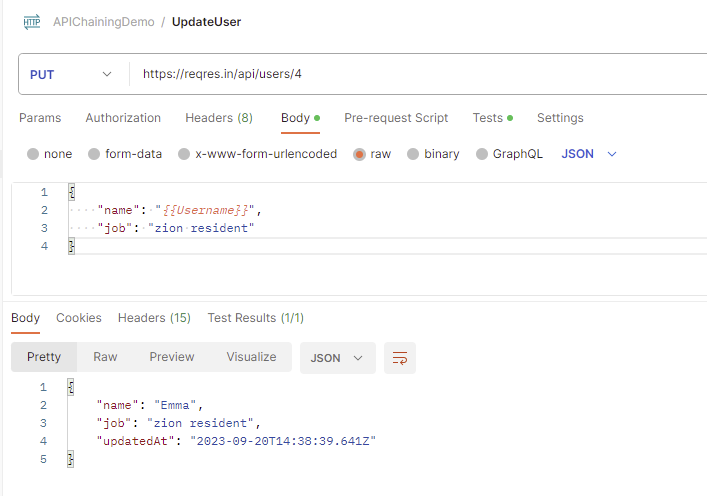
Run the second request
The first request will fetch the first_name value and pass it to the name in the second request. We can see that “Emma” name is fetched from the first request and passed to the second request.
Congratulations. This tutorial has explained the steps to perform API Chaining in the Postman. Happy Learning!!
The previous tutorial explained the generation of Allure Report with Cucumber5, Selenium and JUnit4 in a Maven project. In this tutorial, I will explain the steps to create an Allure Report with Cucumber7, Selenium, and JUnit5 in a Maven project.
Step 2 – Create Step Definition, feature file, and Test Runner Classes
Create Locator and Action classes and Step Definition corresponding to the feature file and Test Runner Class
There is another tutorial that explains the project structure as well as the feature file and corresponding Step Definitions, please refer to this tutorial – Integration of Cucumber7 with Selenium and JUnit5.
Step 3 – Execute the Tests
Use the below command to run the tests
mvn clean test
The output of the above program is
Step 4 – Generate the Allure Report
Once the test execution is finished, a folder named allure-results will be generated in thetarget folder.
To generate the Allure Report, first, go to the target folder.
cd target
Now, use the below command to generate the Allure Report
allure serve
This will generate the beautiful Allure Test Report as shown below.
Allure Report Dashboard
The overview page hosts several default widgets representing the basic characteristics of your project and test environment.
Statistics – overall report statistics.
Launches – if this report represents several test launches, statistics per launch will be shown here.
Behaviours – information on results aggregated according to stories and features.
Executors – information on test executors that were used to run the tests.
History Trend – if tests accumulate some historical data, its trend will be calculated and shown on the graph.
Environment – information on the test environment.
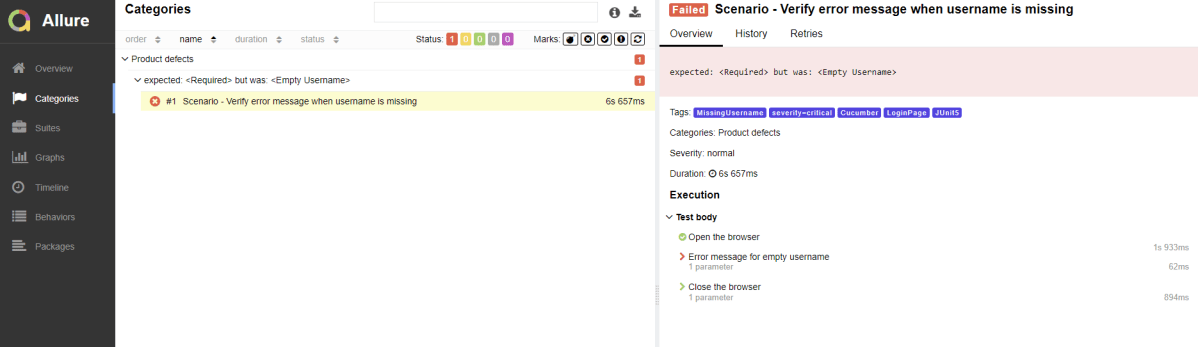
Categories in Allure Report
The categories tab gives you a way to create custom defect classifications to apply for test results. There are two categories of defects – Product Defects (failed tests) and Test Defects (broken tests).
Suites in Allure Report
On the Suites tab a standard structural representation of executed tests, grouped by suites and classes can be found.
Graphs in Allure Report
Graphs allow you to see different statistics collected from the test data: status breakdown or severity and duration diagrams.
Timeline in Allure Report
The timeline tab visualizes retrospective test execution, allure adaptors collect precise timings of tests, and here on this tab, they are arranged accordingly to their sequential or parallel timing structure.
Behaviors of Allure Report
This tab groups test results according to Epic, Feature, Story, Test Severity, Test Description, Test Steps, and so on.
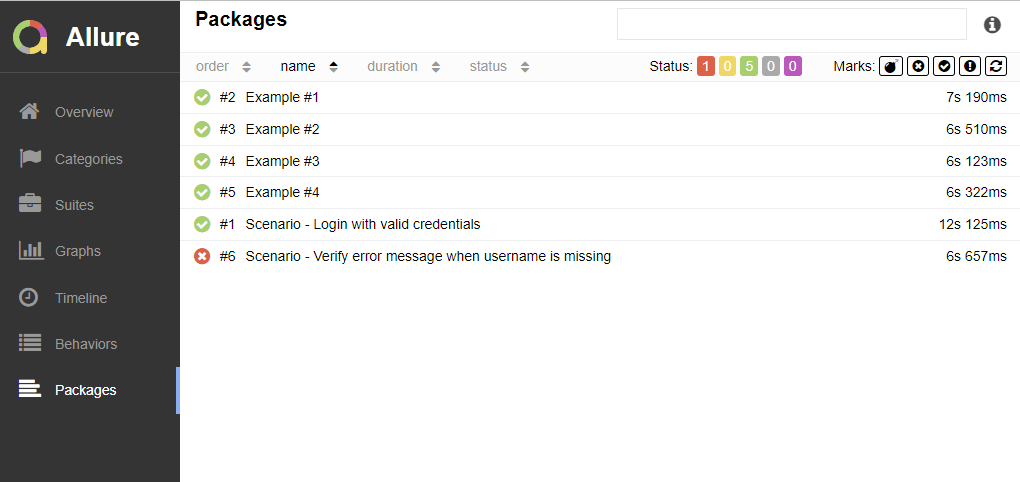
Packages in Allure Report
The packages tab represents a tree-like layout of test results, grouped by different packages.
Congratulations on making it through this tutorial and hope you found it useful! Happy Learning!! Cheers!!
Let’s first have a look at the Jenkins task scheduling setup. You don’t need to be familiar with Linux’s command line environment to understand it, but it resembles the cron syntax quite a bit.
Five fields that are separated by whitespace make up a scheduling item. By adding more than one entry, you can schedule a job for more than one time.
Minute
Hour
Day of Month
Month
Day of week
MINUTE (0-59), HOUR (0-23), DAY (1-31), MONTH (1-12), DAY OF THE WEEK (0-6)
Each field can contain an exact value or use a set of special expressions:
The asterisk * indicates all valid values. So, a job that runs every day has a * in the third field.
A dash separates ranges of values. For example, a job that runs every hour from 9:00 a.m. to 5:00 p.m. would have 9-17 in the second field.
Intervals are specified with a slash /. A job that runs every 15 minutes has H/15 in the first field. Note that the H in the first field has a special meaning. If you wanted a job to run every 15 minutes, you could configure it as 0/15, which would make it run at the start of every hour. However, if you configure too many jobs this way, you can overload your Jenkins controller. Ultimately, the H tells Jenkins to pick a minute based on a hash of the job name.
Finally, you can specify multiple values with a comma. So, a job that runs Monday, Wednesday, and Friday would have 1,3,5 in the fifth field.
Here are the several special predefined values that can be used to substitute the expressions in Jenkins cron.
Entry
Description
Description
@yearly
Run at any time during the year
H H H H *
@annually
Run at any time during the year
H H H H *
@monthly
Run at any time during the month
H H H * *
@weekly
Run at any time during the week
H H * * H
@daily
Run at any time during the day
H H * * *
@hourly
Run at any time during the hour
H * * * *
Here are the most common examples of cron job schedules that can be found in almost any crontab on Linux (use H in the examples below to spread the load evenly in Jenkins):
Schedule
Job
* * * * *
Run cron job every minute
H/5 * * * *
Run cron job every 5 minutes
H/30 * * * *
Run cron job every 30 minutes
0 * * * *
Run cron job every hour
0 H/3 * * *
Run cron job every 3 hours
0 13 * * *
Run cron job every day at 1pm
30 2 * * *
Run cron job every day at 2:30 am
0 0 * * *
Run cron job every day at midnight
0 0 * * 0
Run cron job every Sunday
0 0 * * 1
Run cron job every Monday
0 0 1 * *
Run cron job every first day of every month
0 0 1 1 *
Run cron job every first of January every year
Add a Schedule to a Jenkins Job
Step 1: Create a new project using the Maven project plugin
In the General section, enter the project description in the Description box.
Step 2: Go to the Build section of the new job
In the Root POM textbox, enter the full path to pom.xml
In the Goals and options section, enter “clean test”
Click on the Applyand Save buttons.
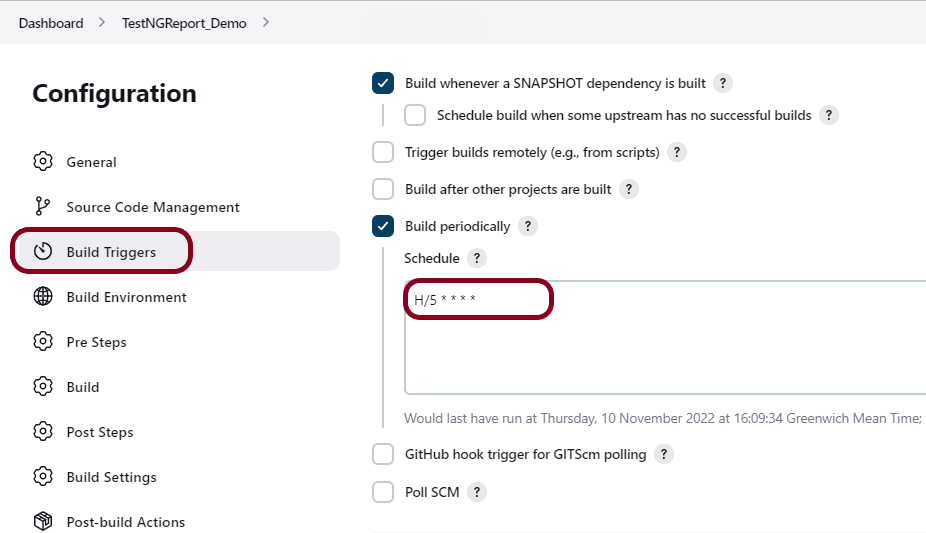
Step 3: Go to the Build Triggers
Select the Build periodically option and mention the schedule.
This will open the scheduling text area.
H/5 * * * *
This schedule means that the job will run every 5 minutes.
Click on the Apply and Save buttons.
Step 4: Verify the Build History
Here is a screenshot of a couple of builds on our system. The timestamps show that you’ve scheduled a job to run every five minutes.
Below is the Build History.
In this post, we covered Jenkin’s job scheduling abilities, and we covered how to configure jobs for different intervals.
In this tutorial, I’ll create a Framework for the testing of web applications using Selenium Webdriver with TestNG.
We integrate Selenium with TestNG because Selenium does not have any inbuilt reporting feature. TestNG generates detailed HTML reports of test executions. It is easy to manage dependencies between test methods in TestNG which is quite difficult in Selenium.
Selenium needs Java to be installed on the system to run the tests. Click here to learn How to install Java.
Step 2 – Download and setup Eclipse IDE on the system
The Eclipse IDE (integrated development environment) provides strong support for Java developers, which is needed to write Java code. Click here to learn How to install Eclipse.
Step 3 – Setup Maven
To build a test framework, we need to add a number of dependencies to the project. It is a very tedious and cumbersome process to add each dependency manually. So, to overcome this problem, we use a build management tool. Maven is a build management tool that is used to define project structure, dependencies, build, and test management. Click here to learn How to install Maven.
After the addition of dependencies in pom.xml, the Maven Dependencies folder will be updated automatically with all the JAR file related to the dependencies.
Step 6 – Create a Test file under src/test/java
@BeforeMethod – This annotated method will be run before each test method i.e say there are three test methods (i.e test cases), then @BeforeMethod annotated method will be called thrice before each test method.
@AfterMethod– methods under this annotation will be executed after each Test method.
@Test – The annotated method is part of a test case.
Description– You can describe your test case under the description, stating what it does.
description = "This test validates title of login functionality"
Priority– You can prioritize the order of your test methods by defining a priority. Based on the defined priority, the test shall execute in that order.
priority = 0
Below is an example of Selenium Tests with TestNG.
BaseTests
import org.openqa.selenium.WebDriver;
import org.openqa.selenium.chrome.ChromeDriver;
import org.openqa.selenium.chrome.ChromeOptions;
import org.testng.annotations.AfterMethod;
import org.testng.annotations.BeforeMethod;

import java.time.Duration;

public class BaseTests {

    public static WebDriver driver;
    public final static int TIMEOUT = 10;

    @BeforeMethod
    public void setup() {

        ChromeOptions options = new ChromeOptions();
        options.addArguments("--remote-allow-origins=*");
        options.addArguments("--no-sandbox");
        options.addArguments("--disable-dev-shm-usage");
        options.addArguments("--headless");
        driver = new ChromeDriver(options);
        driver.manage().window().maximize();
        driver.get("https://opensource-demo.orangehrmlive.com/");
        driver.manage().timeouts().implicitlyWait(Duration.ofSeconds(TIMEOUT));

    }

    @AfterMethod
    public void tearDown() {
        driver.quit();
    }

}
LoginTests
import org.testng.Assert;
import org.testng.annotations.Test;

public class LoginPageTests extends BaseTests{

    @Test
    public void invalidCredentials() {

	    LoginPage objLoginPage = new LoginPage(driver);
    	objLoginPage.login("admin$$", "admin123");

    	// Verify Error Message
    	 Assert.assertEquals("Invalid credentials",objLoginPage.getErrorMessage());

    }

    @Test
    public void validLogin() {

	    LoginPage objLoginPage = new LoginPage(driver);
    	objLoginPage.login("Admin", "admin123");

    	HomePage objHomePage = new HomePage(driver);

    	// Verify Home Page
    	Assert.assertEquals("Dashboard",objHomePage.getHomePageText());

    }

}
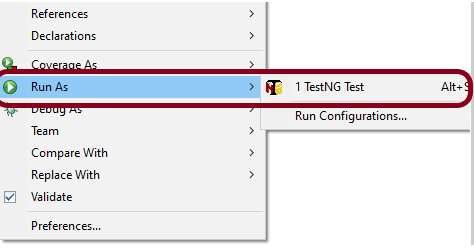
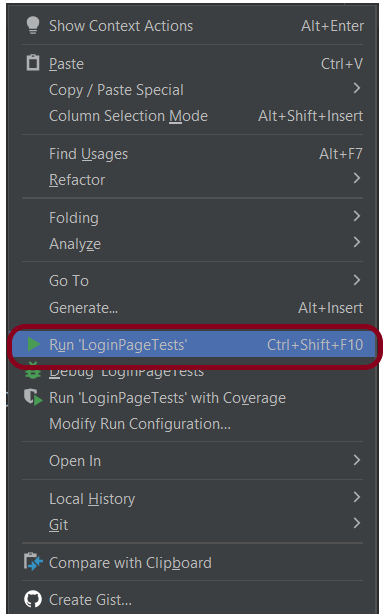
Step 7 – Test Execution through TestNG
Go to the Runner class and right-click Run As TestNG Test. The tests will run as TestNG tests (in Eclipse).
Intellij
Step 8 – Run the tests from TestNG.xml
Create a TestNG.xml as shown below and run the tests as TestNG.
<?xml version = "1.0"encoding = "UTF-8"?>
<!DOCTYPE suite SYSTEM "http://testng.org/testng-1.0.dtd">
<suite name = "Suite1">
  <test name = "TestNG Demo">
    <classes>
          <class name = "com.example.Selenium_TestNGDemo.TestNG_Demo"/>
     </classes>
   </test>
</suite>
Step 9 – TestNG Report Generation
TestNG generates various types of reports under test-output folder like emailable-report.html, index.html, testng-results.xml.
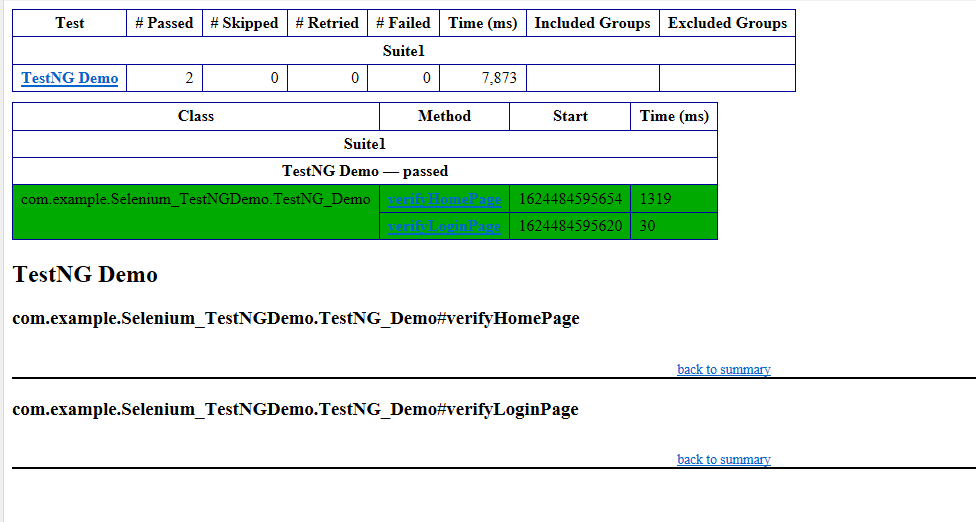
We are interested in the “emailable-report.html” report. Open “emailable-report.html“, as this is an HTML report, and open it with the browser. The below image shows emailable-report.html.
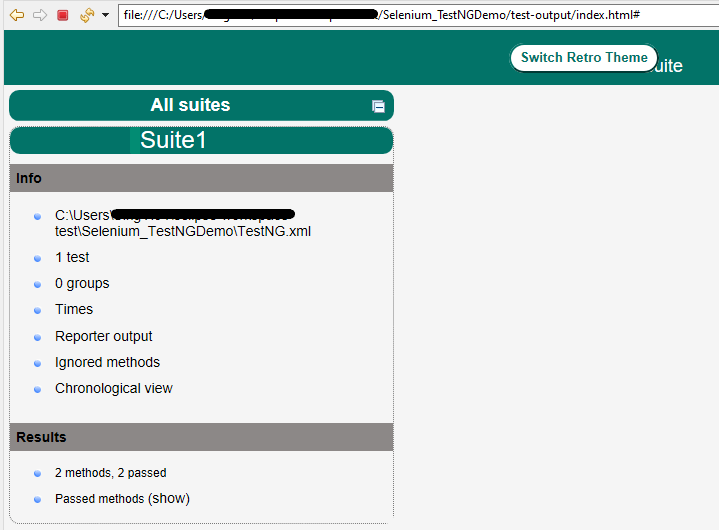
TestNG also produces an “index.html” report, and it resides under the test-output folder. The below image shows the index.html report. This is the latest theme of the report.
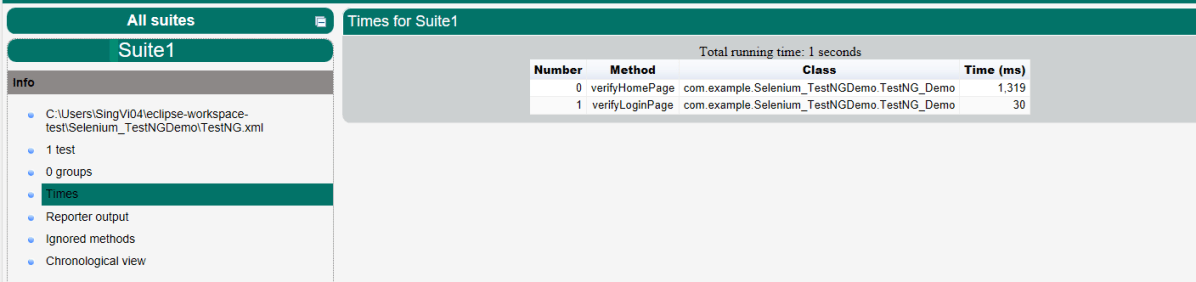
The links present on the left side are clickable. I have clicked the Times link, and you can see the details on the right side.
That’s it! Congratulations on making it through this tutorial and hope you found it useful! Happy Learning!!
Postman contains a full-featured testing sandbox that enables you to write and execute JavaScript-based tests for your API. You can then integrate Postman with your CI/CD build system using Newman, the command-line collection runner for Postman. In this tutorial, we are going to learn how we can create a Newman Report in Jenkins.
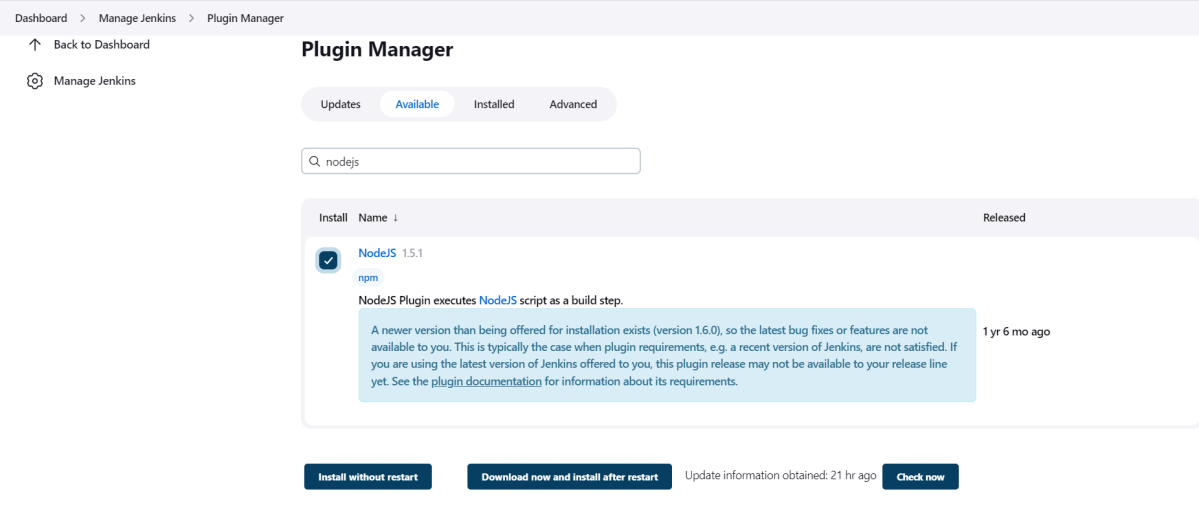
To generate a Performance Report in Jenkins, we need to download NodeJS Plugin. Please refer to this tutorial to install the plugin – How to install Plugins in Jenkins.
Go to Manage Jenkins > Manage Plugins and install the NodeJS plugin.
Step 2: Global Tool Configuration for NodeJS
Go to Manage Jenkins > Global Tool Configuration and under NodeJS, select Add NodeJS.
Enter a name for the Node.js installation.
Select the version of NodeJS installed on your machine from the Version dropbox.
In Global npm packages to install, enter newman.
Click on the Apply and Save buttons.
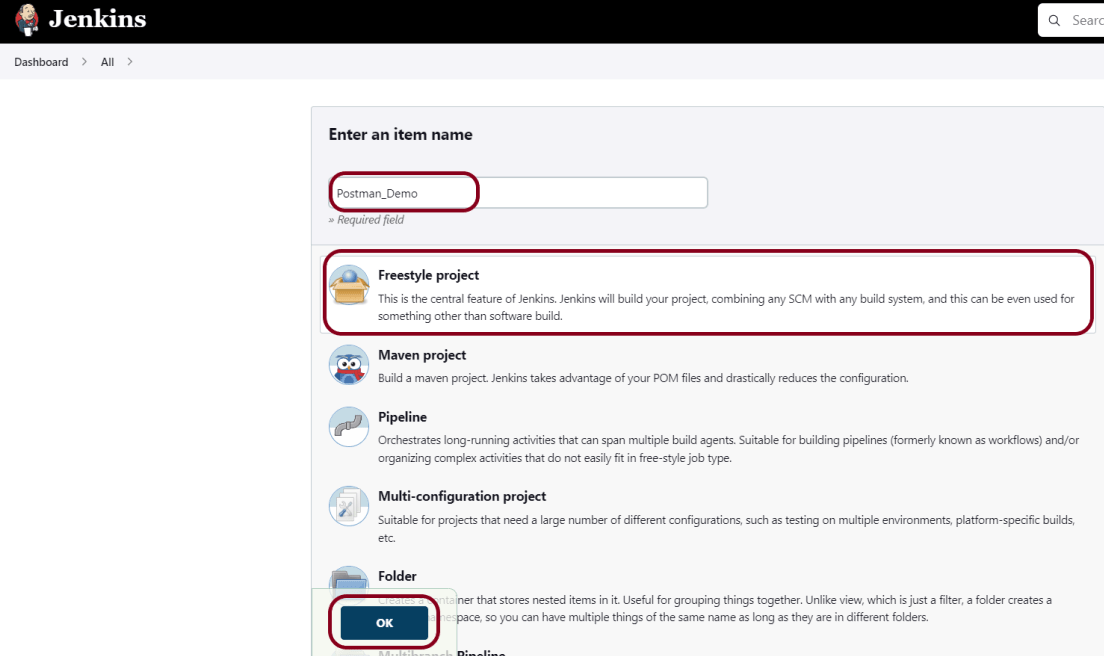
Step 3: Create a new FreeStyle project
Give the Name of the project – Postman_Demo
Click on the FreeStyle project.
Click on the OK button.
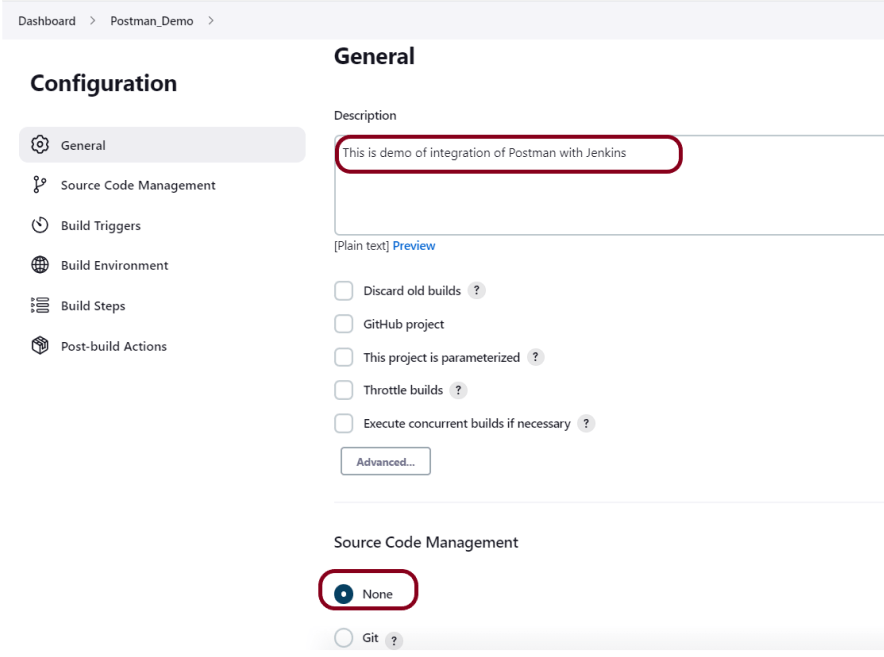
In the General section, enter the project description in the Description box.
Step 4: Source Code Management
Select Source Code Management as None if the project is locally present on the machine.
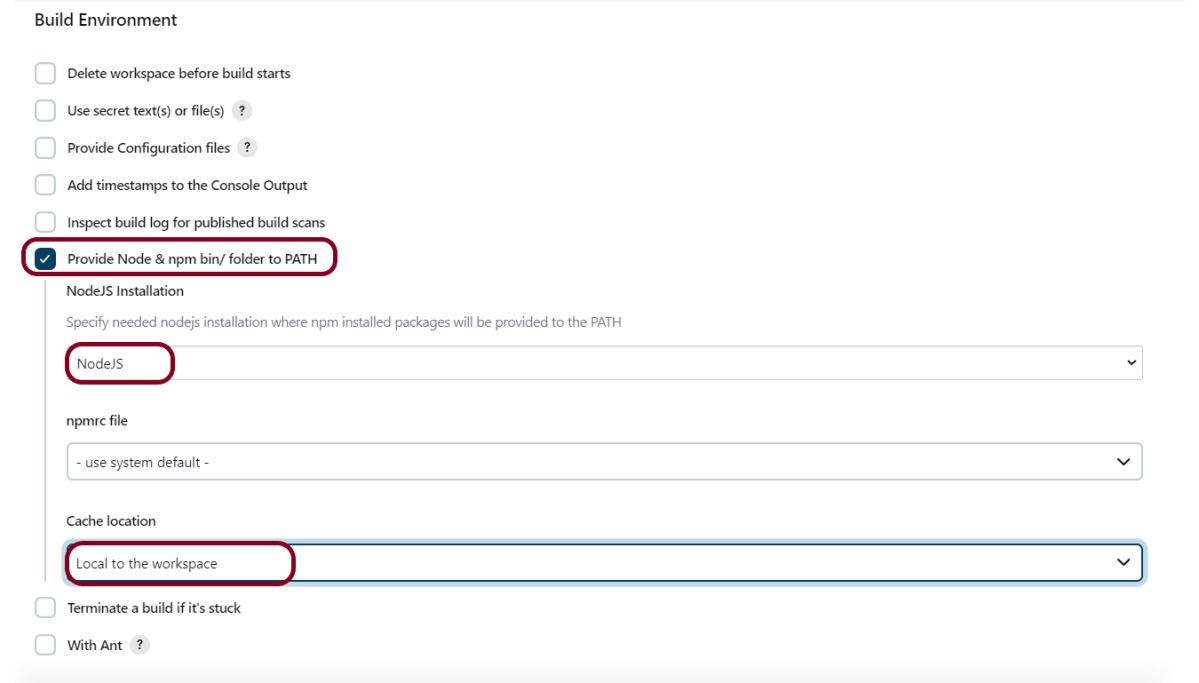
Step 5: Build Environment
Select the “Provide Node & npm bin/folder to PATH” option.
Step 6: Select Execute Windows batch command
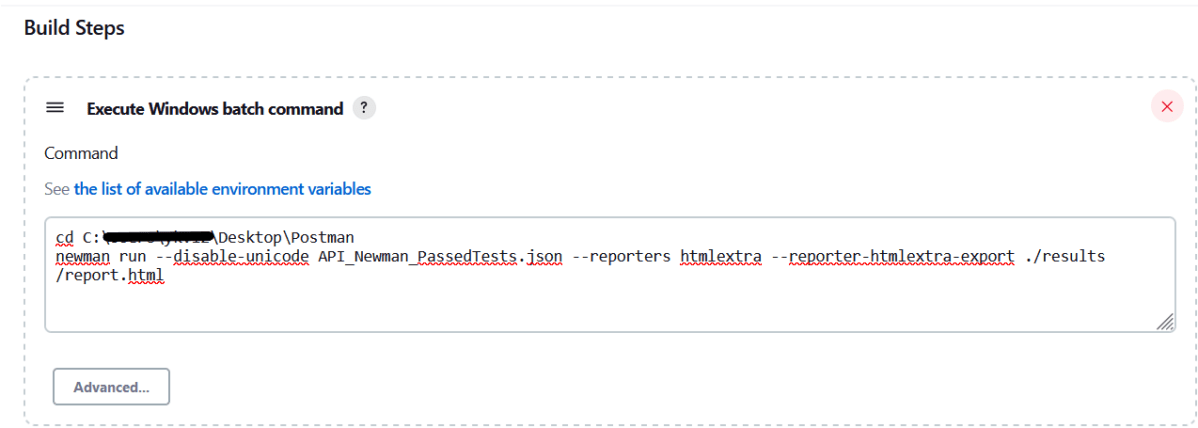
In the Build Steps section, select Execute Windows batch command.
Use the below command to go to the path where the JMeter is placed in your system.
cd C:\Users\Vibha\Desktop\Postman
newman run --disable-unicode API_Newman_PassedTests.json --reporters htmlextra --reporter-htmlextra-export ./results/report.html
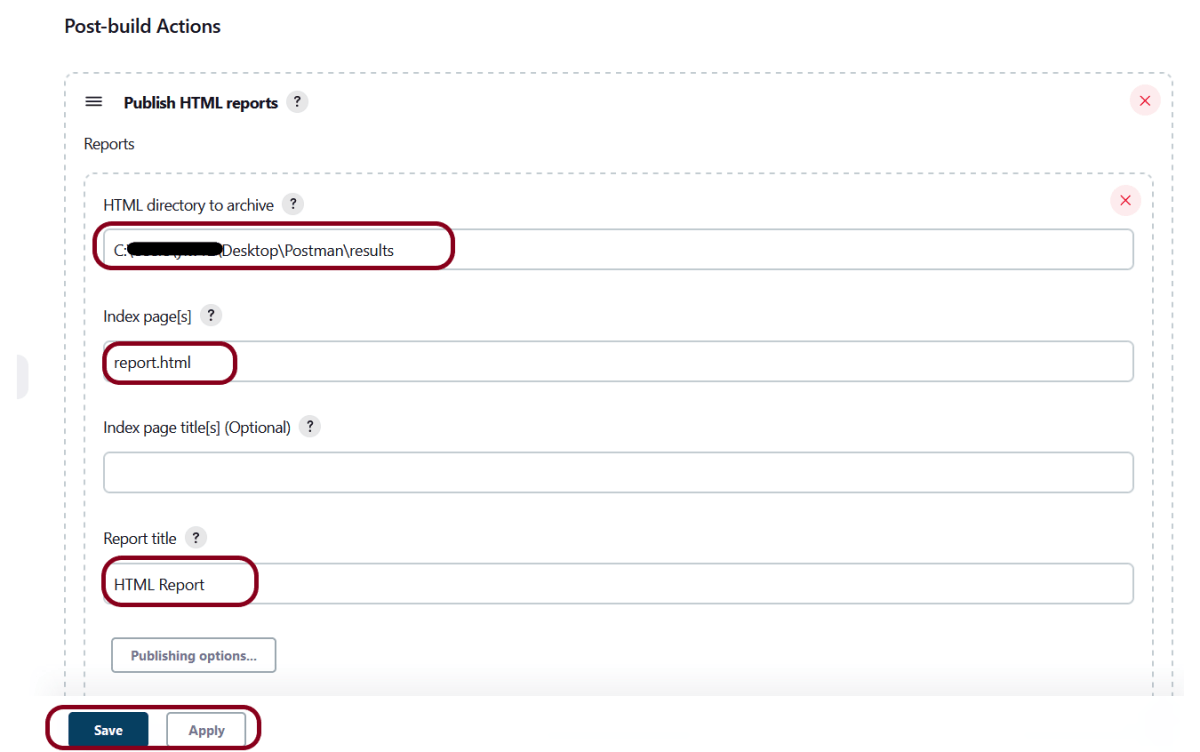
Step 7: Select “Publish HTML reports” from “Post Build Actions”
Scroll down to “Post Build Actions” and click on the “Add Post Build Actions” drop-down list. Select “Publish HTML reports“.
Enter the HTML directory to archive – ..\Postman\results, Index page[s] – report.html and Report title – HTML Report.
Click on the Apply and Save buttons.
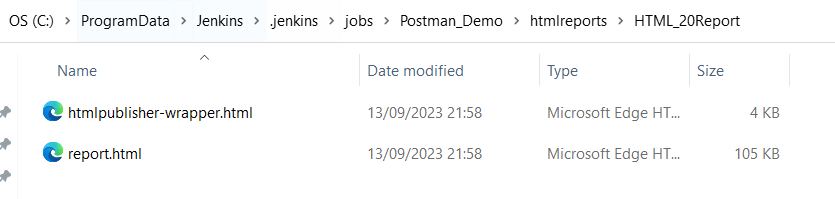
If you want to see where the report is saved on desktop, go to – C:\ProgramData\Jenkins.jenkins\jobs\Postman_Demo\htmlreports\HTML_20Report.
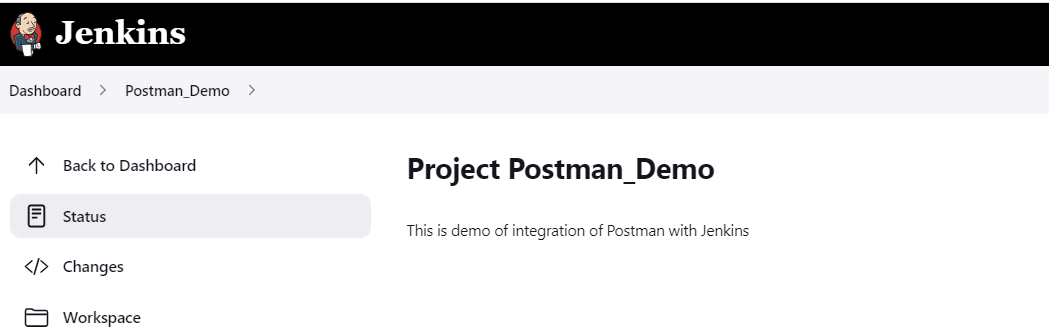
We have created a new project “Postman_Demo” with the configuration to run the Postman scripts.
Step 8: Execute the tests
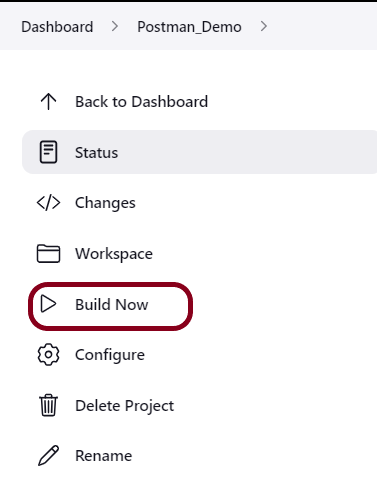
Let’s execute it now by clicking on the “Build Now” button.
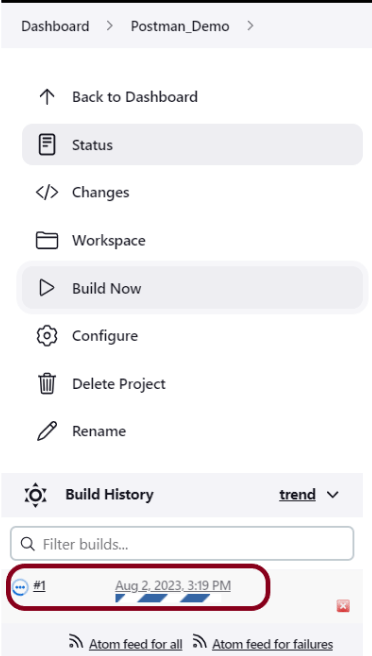
Right-click on Build Number (here in my case it is #1).
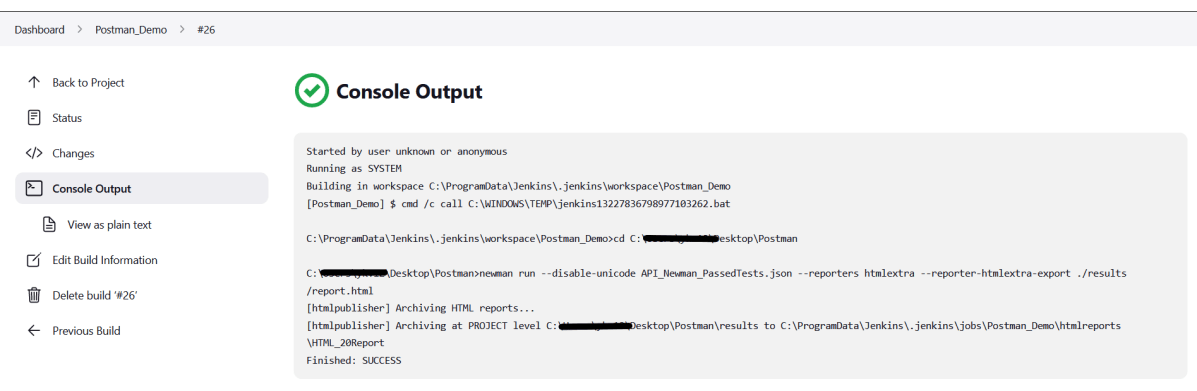
Click on Console Output to see the result.
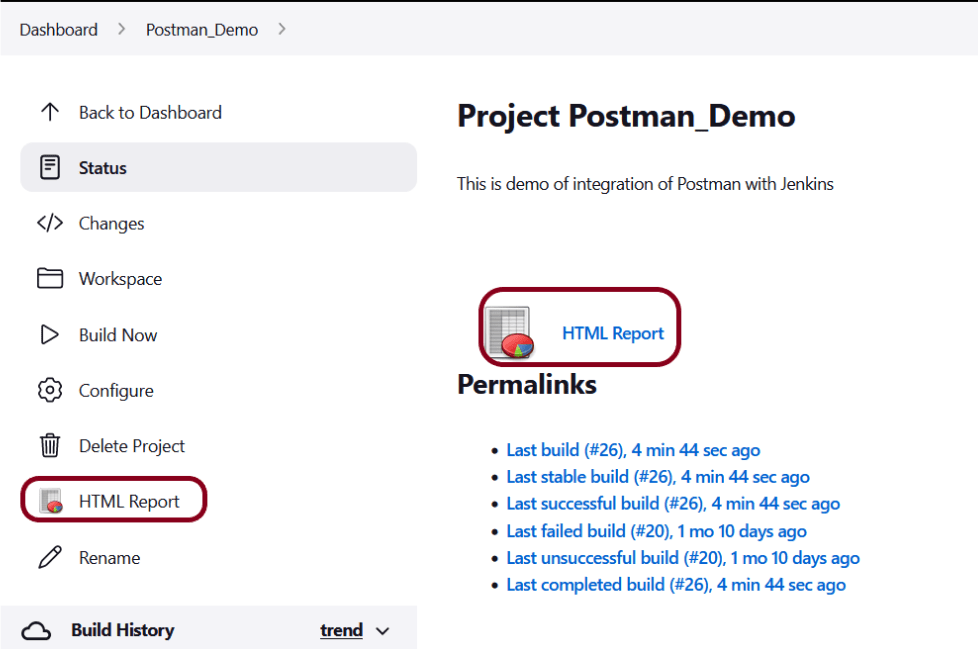
Step 9: View the HTML Report
Once the execution is completed, click on go “Back to Project“, and we could see a link to view the “HTML Report“.
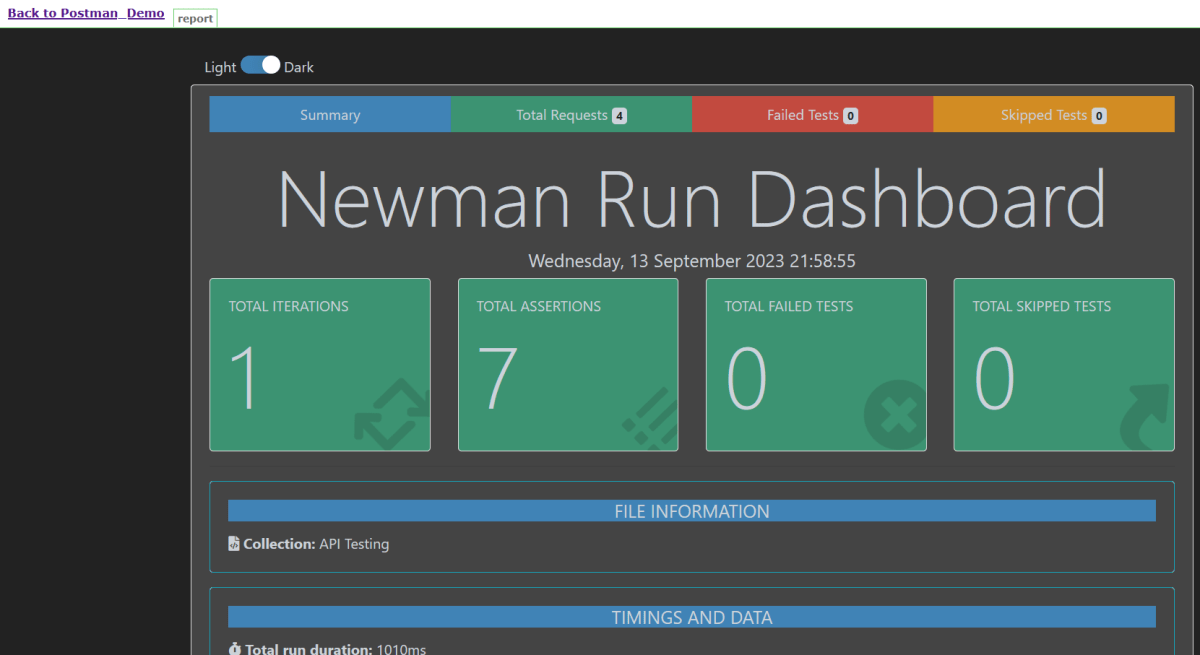
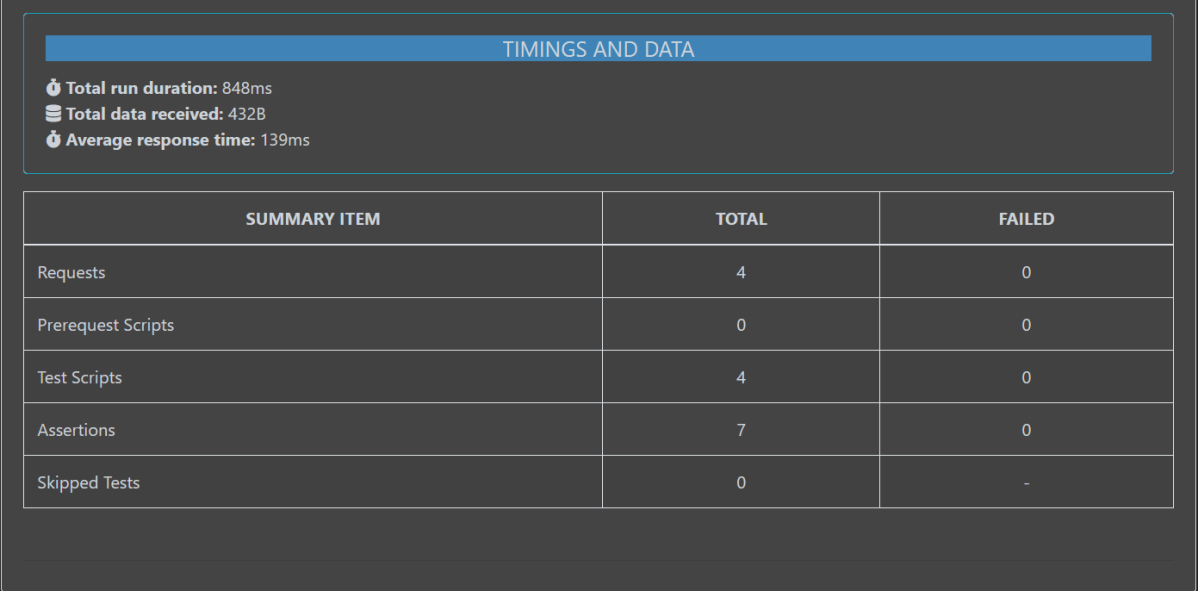
Below is the HTML Report generated in Jenkins.
In the case, we see that HTML Report does not look very pretty. The reason is that CSS is stripped out because of the Content Security Policy in Jenkins.
Go to Manage Jenkins -> Manage Nodes and Clouds. Click on the Script Console option. Type in the following command and Press Run. If you see the output as ‘Result:’ then the protection is disabled. Re-Run your build and you can see that the new HTML files archived will have the CSS enabled.
The LinkedHashMapClass is just like HashMapwith an additional feature of maintaining an order of elements inserted into it. However, the linked hash map is based on both a hash table and a linked list to enhance the functionality of the hash map.
It maintains a doubly-linked list running through all its entries, in addition to an underlying array of default size 16.
LinkedHashMap contains values based on the key. It implements the Map interface and extends the HashMap class.
Create a LinkedHashMap object as shown below from:-
import java.util.LinkedHashMap;
Syntax of LinkedHashMap
LinkedHashMap<String, String> employeeDetail = new LinkedHashMap<String, String>();

LinkedHashMap<String, String> employeeDetail = new LinkedHashMap<>();

LinkedHashMap<String, Integer> employeeDetail = new LinkedHashMap<String, Integer>();
Adding the Elements
Below is an example where we are adding items to HashMap by using put() method.
import java.util.LinkedHashMap;

public class LinkedHashMap_Demo {
    public static void main(String a[]) {

        // Creating an empty LinkedHashMap
        LinkedHashMap<String, String> linkedHashMap = new LinkedHashMap<String, String>();

        // Adding entries in Map using put() method
        linkedHashMap.put("Tim", "DBA");
        linkedHashMap.put("Cillian", "SDET");
        linkedHashMap.put("Patrick", "BA");
        linkedHashMap.put("Brendan", "Dev");

        // Printing all entries inside Map
        System.out.println("Linked HashMap :" + linkedHashMap);

    }
}
The output of the above program is
Accessing an Element
To access a value in the LinkedHashMap, use the get() method and refer to its key:-
import java.util.LinkedHashMap;

public class LinkedHashMap_Demo {
    public static void main(String a[]) {

        // Creating an empty LinkedHashMap
        LinkedHashMap<String, String> linkedHashMap = new LinkedHashMap<String, String>();

        // Adding entries in Map using put() method
        linkedHashMap.put("Tim", "DBA");
        linkedHashMap.put("Cillian", "SDET");
        linkedHashMap.put("Patrick", "BA");
        linkedHashMap.put("Brendan", "Dev");

        // Printing all entries inside Map
        System.out.println("Linked HashMap :" + linkedHashMap);

        // Access a value
        System.out.println("Access Value of Key Patrick :" + linkedHashMap.get("Patrick"));

    }
}
The output of the above program is
Removing an Element
To remove an item, use the remove() method and refer to the key:
import java.util.LinkedHashMap;
public class LinkedHashMap_Demo {
public static void main(String a[]) {
// Creating an empty LinkedHashMap
LinkedHashMap<String, String> linkedHashMap = new LinkedHashMap<String, String>();
// Adding entries in Map using put() method
linkedHashMap.put("Tim", "DBA");
linkedHashMap.put("Cillian", "SDET");
linkedHashMap.put("Patrick", "BA");
linkedHashMap.put("Brendan", "Dev");
// Printing all entries inside Map
System.out.println("Linked HashMap :" + linkedHashMap);
// Removing the mapping with Key Brendan
linkedHashMap.remove("Brendan");
// Printing the updated map
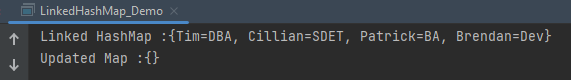
System.out.println("Updated Map :" + linkedHashMap);
}
}
The output of the above program is
To remove all items, use the clear()method:-
import java.util.LinkedHashMap;

public class LinkedHashMap_Demo {
    public static void main(String a[]) {

        // Creating an empty LinkedHashMap
        LinkedHashMap<String, String> linkedHashMap = new LinkedHashMap<String, String>();

        // Adding entries in Map using put() method
        linkedHashMap.put("Tim", "DBA");
        linkedHashMap.put("Cillian", "SDET");
        linkedHashMap.put("Patrick", "BA");
        linkedHashMap.put("Brendan", "Dev");

        // Printing all entries inside Map
        System.out.println("Linked HashMap :" + linkedHashMap);

        // Removing the mapping with Key Brendan
        linkedHashMap.clear();

        // Printing the updated map
        System.out.println("Updated Map :" + linkedHashMap);

    }
}
The output of the above program is
Iterating through the LinkedHashMap
There are multiple ways to iterate through the LinkedHashMap. The most famous way is to use a for-each loop over the set view of the map (fetched using the map.entrySet() instance method). Then for each entry (set element), the values of key and value can be fetched using the getKey() and the getValue() method.
import java.util.LinkedHashMap;
import java.util.Map;
public class LinkedHashMap_Demo {
public static void main(String a[]) {
// Creating an empty LinkedHashMap
LinkedHashMap<String, String> linkedHashMap = new LinkedHashMap<String, String>();
// Adding entries in Map using put() method
linkedHashMap.put("Tim", "DBA");
linkedHashMap.put("Cillian", "SDET");
linkedHashMap.put("Patrick", "BA");
linkedHashMap.put("Brendan", "Dev");
// For-each loop for traversal over Map
for (Map.Entry<String, String> mapElement : linkedHashMap.entrySet()) {
String key = mapElement.getKey();
// Finding the value
// using getValue() method
String value = mapElement.getValue();
// Printing the key-value pairs
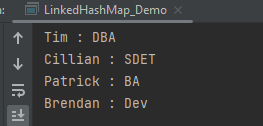
System.out.println(key + " : " + value);
}
}
}
The output of the above program is
Methods in LinkedHashMap
import java.util.LinkedHashMap;

public class LinkedHashMap_Demo {
    public static void main(String a[]) {

        // Creating an empty LinkedHashMap
        LinkedHashMap<String, String> linkedHashMap = new LinkedHashMap<String, String>();

        // Adding entries in Map using put() method
        linkedHashMap.put("Tim", "DBA");
        linkedHashMap.put("Cillian", "SDET");
        linkedHashMap.put("Patrick", "BA");
        linkedHashMap.put("Brendan", "Dev");

        // Getting and printing value for a specific key
        System.out.println("Getting value for key 'Patrick' :" + linkedHashMap.get("Patrick"));

        // Getting size of Map using size() method
        System.out.println("Size of the map :" + linkedHashMap.size());

        // Checking whether Map is empty or not
        System.out.println("Is map empty? :" + linkedHashMap.isEmpty());

        // Using containsKey() method to check for a value
        System.out.println("Contains value 'SDET' "  + linkedHashMap.containsValue("SDET"));

        // Using containsKey() method to check for a key
        System.out.println("Contains key 'Brendan'? :" + linkedHashMap.containsKey("Brendan"));

        // Removing entry using remove() method
        System.out.println("Delete element 'Brendan' :" + linkedHashMap.remove("Brendan"));

        // Printing mappings to the console
        System.out.println("Mappings of LinkedHashMap :" + linkedHashMap);
        }
}
The output of the above program is
We are done! Congratulations on making it through this tutorial and hope you found it useful! Happy Learning!!
You can share your collections, collection folders, APIs, and environments with collaborators. There are several different ways to share an element. Here, we are using API to share the Postman Collection.
To share a collection’s JSON using the Postman API, do the following:
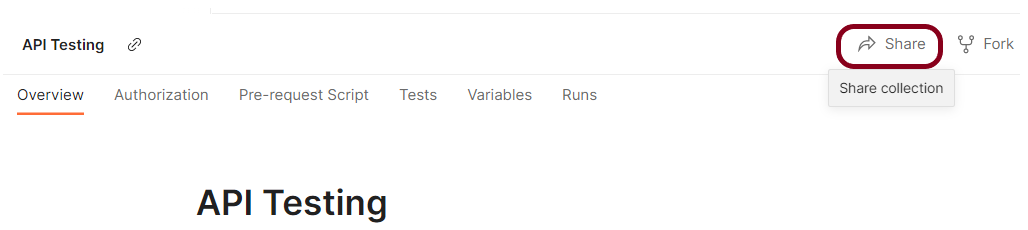
Step 1 – Go to your collection – Click the arrow – Click on the Share button.
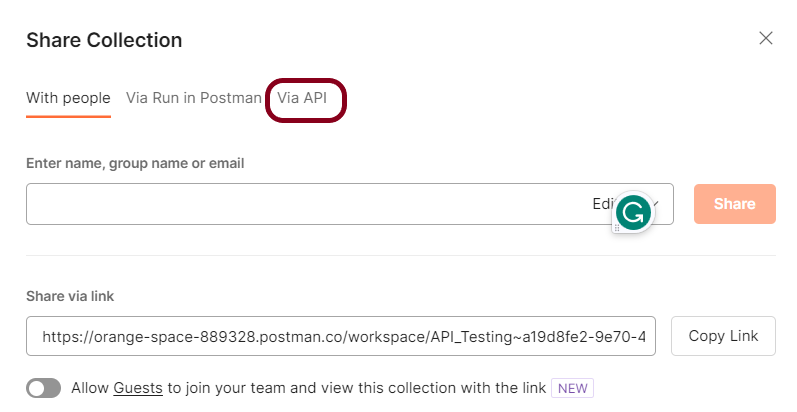
Step 2 – Select “Via API”.
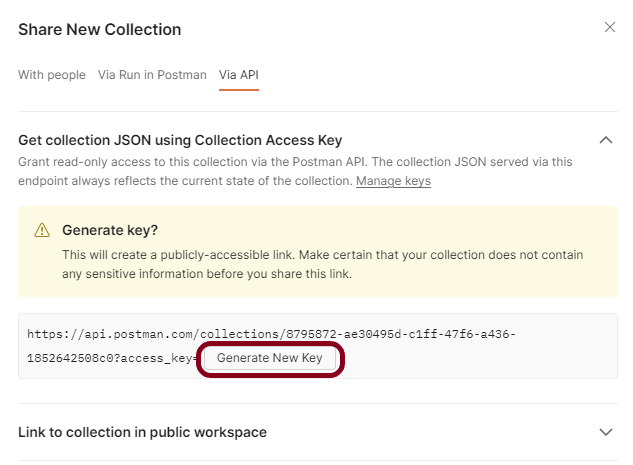
Step 3 – Select Get collection JSON using Collection Access Key
Step 4 – Select Generate New Key to create a read-only collection access key. This key expires after 60 days of inactivity.
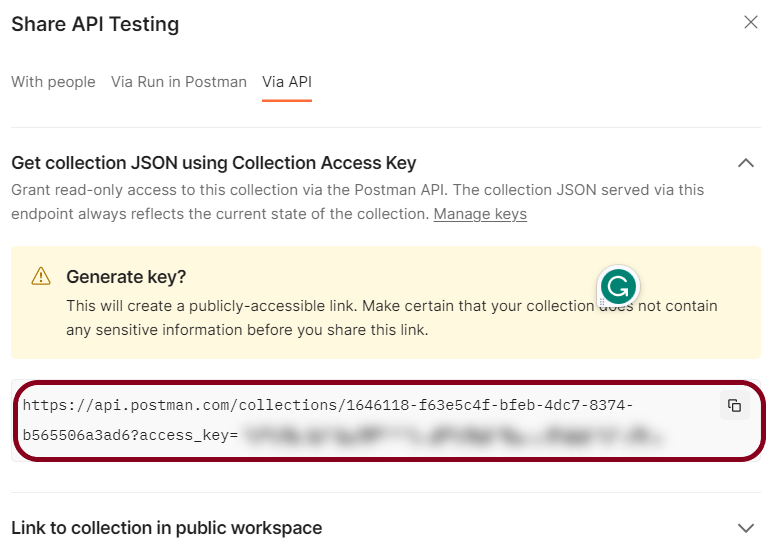
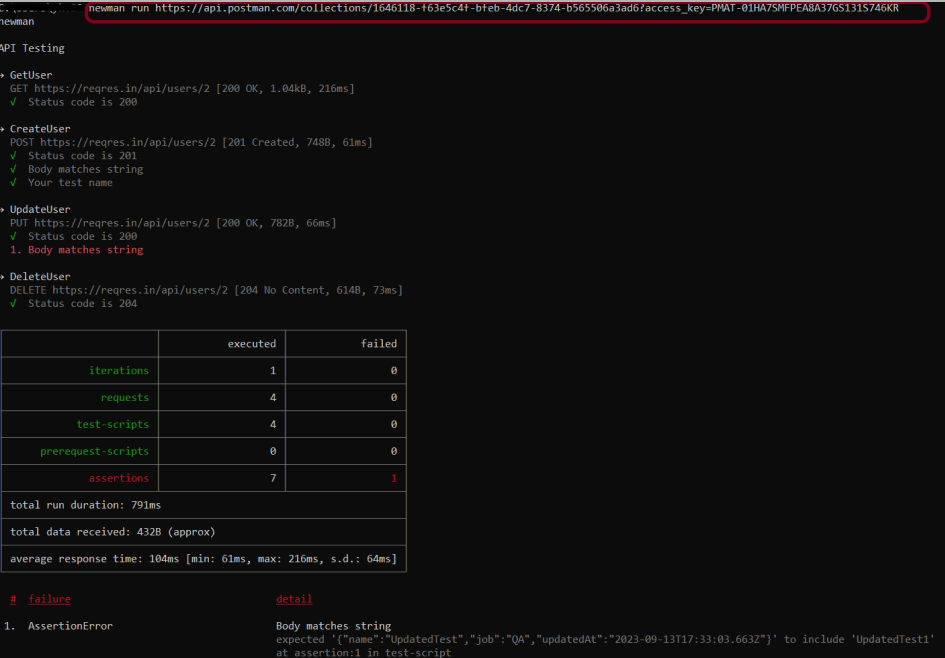
Step 5 – Copy the link and go to the Command line. Here we can run the collection using the collection URL using our Newman tool. Newman is the command-line runner for the postman.
Run the collection through URL by running the command:
newman run <copied URL>
Note: If Newman is not installed, please refer to this tutorial.
It starts running the Collection and displays the result. The same command is used to run the collection in the Remote system, even if that system has no Postman app installed.
Postman provides the capability to run the collections at specific times each day or week. For example, you may want to run a collection that tests the functionality of your API every day. You can use the Collection Runner to schedule collection runs to execute automatically at specified days and times.
Scheduled runs execute in the Postman Cloud.
Schedules share permissions with their collections. For example, if you have permissions to edit a collection, you’ll be able to edit that collection’s schedules.
Personal, private, and team workspaces support scheduling collection runs.
If you import or export a collection, its schedules don’t import or export with it. However, if you delete a collection, its schedules are deleted also.
Scheduled collection runs have the same usage limits as monitors.
When you schedule a collection run with the Collection Runner, the scheduled run is added to the collection’s Runs tab. You can view, pause, edit, and delete scheduled collection runs from the collection’s Runs tab.
Scheduling a Collection Run
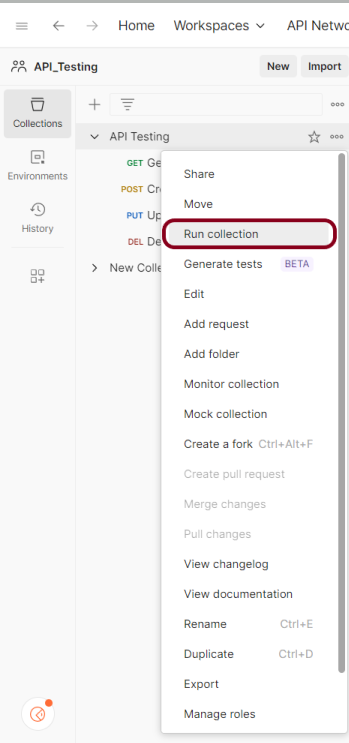
Step 1 – Click “Run Collections”
Select Collectionsin the sidebar and select the collection or folder you want to schedule. Click on the “Run Collection”.
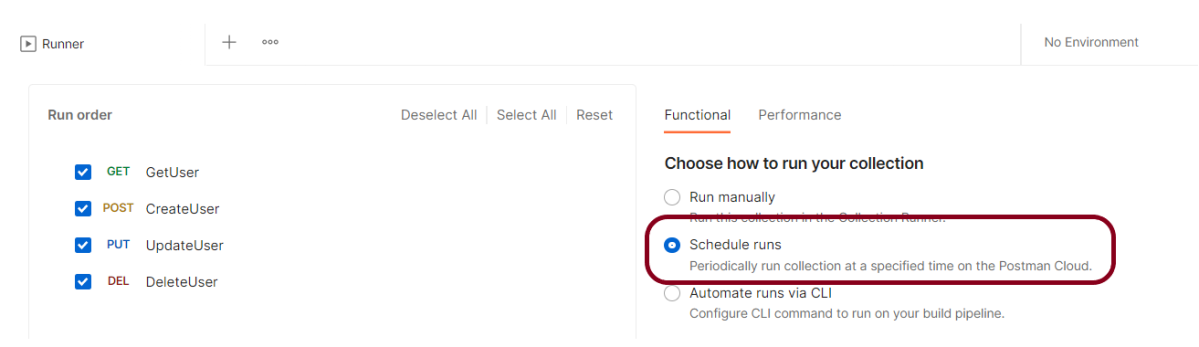
Step 2 – Schedule the Run
On the Functional tab, select Schedule runs.
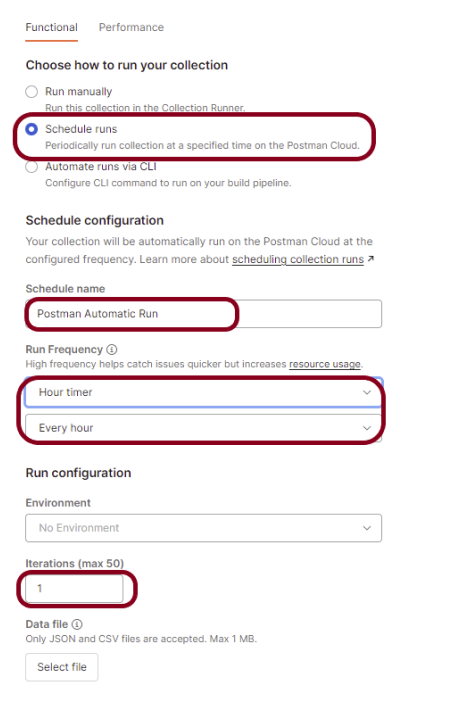
Step 3 – Select Configuration options
Choose any configuration options:
The schedule’s name – Postman Automatic Run
The run’s frequency – Hourly
An environment associated with the collection (optional) – No
How many times you want the collection to run (iterations) – 1
A JSON or CSV data file (optional)
Notification recipients (optional)
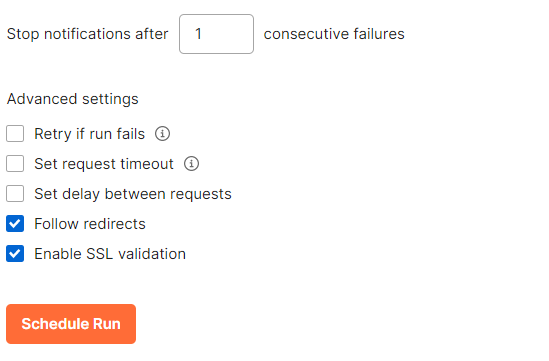
Advanced settings (optional)
Retry if run fails
Set request timeout
Set delay between requests
Follow redirects
Enable SSL validation
By default, your queries are executed in the collection’s list order. Select the request you want to move, then drag it to the new position in the execution sequence. By unchecking the box next to a certain request’s name, you can also delete that request from the run.
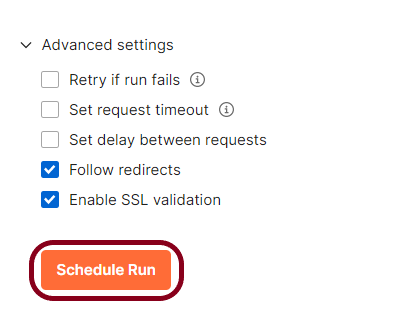
Click the “Schedule Run“ button.
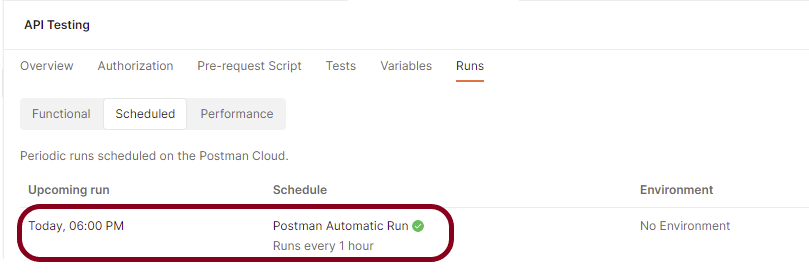
Viewing a scheduled run
Step 1 – View the schedule in Postman console
Select Collections in the sidebar and select the collection with the scheduled run you want to view.
Select the Runstab.
Select the Scheduled runs tab, hover over your scheduled run, and Select View.
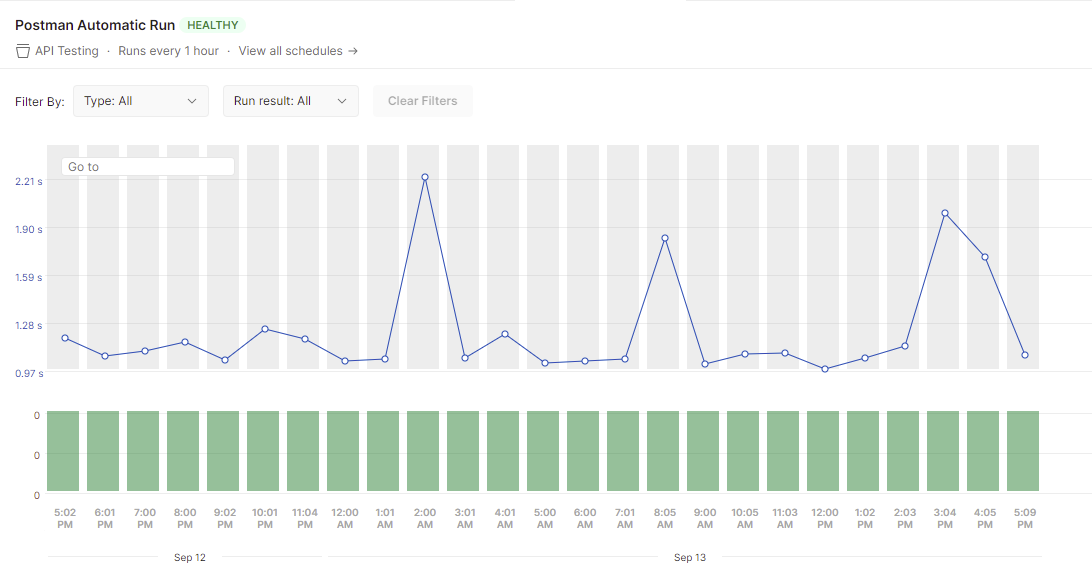
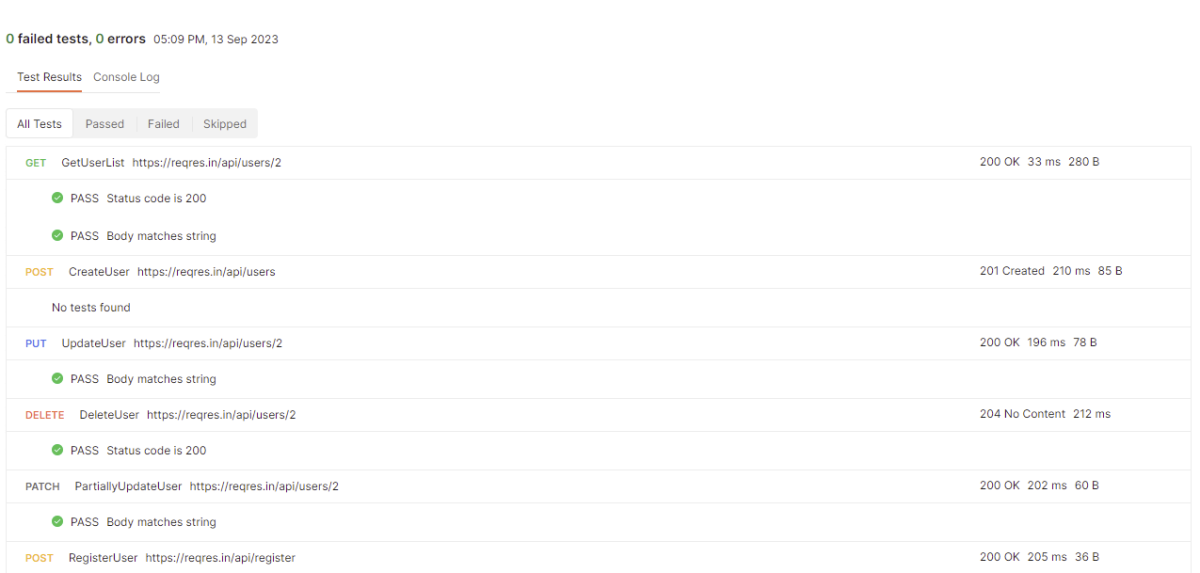
Double-click on any green bar and it shows all the test result.
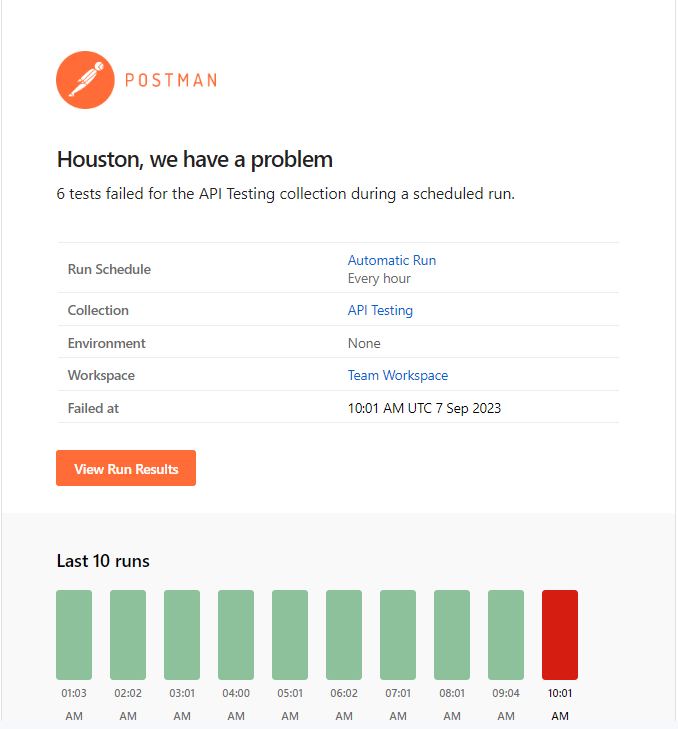
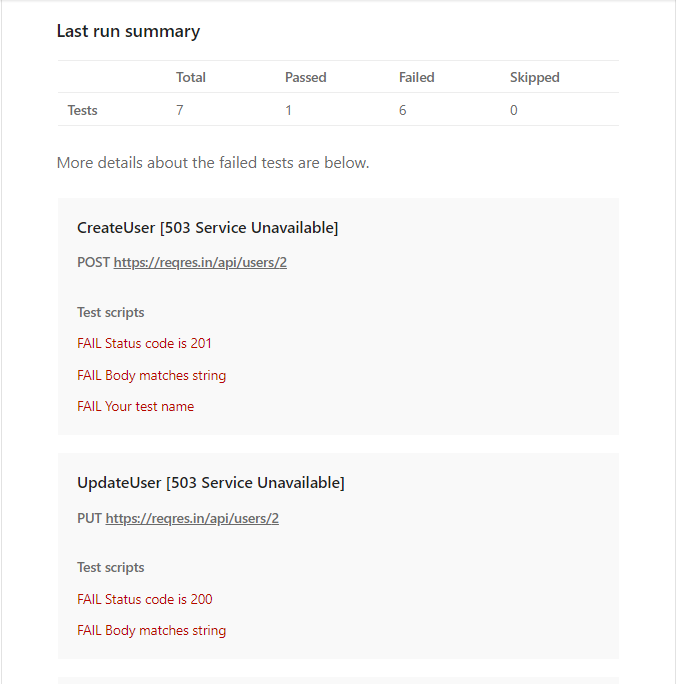
Step 2 – View the email
Postman sends email as you have configured in the runner option. Here, I have configured to send email after failure of 1 consecutive run. So, we can see the sample email below:
Sample Email
Congratulations. This tutorial has explained the steps to schedule the Collection run in the Postman. Happy Learning!!
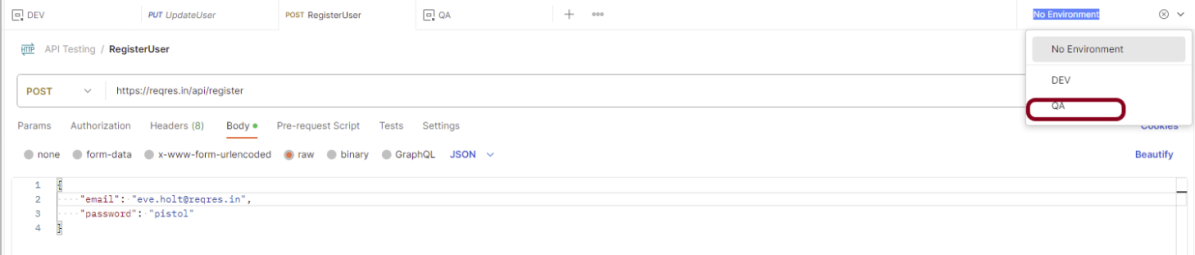
The environment is a set of key-value pairs. We can use environments to group related sets of values together and manage access to shared Postman data if you are working as part of a team.
Why do we need an environment?
Imagine we have 4 different environments – Dev, QA, UAT, and Pre Prod. These environments need different credentials to login to the application. So, we will create same request with different credentials or will keep on changing the credential of same request every time. This is a messy approach. So, the ideal scenario is we create environment variables for the changing attributes and select the environment for particular attributes. In this way, we have a single request with different combination of attributes.
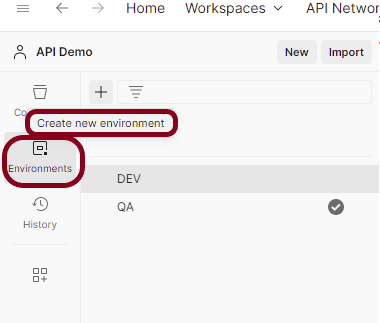
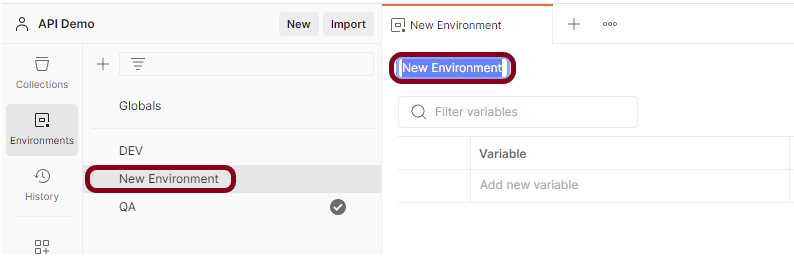
How do we create an environment?
Select Environments on the left and select +.
Enter a name for your environment, and initialize it with any variables you need. You can also specify variables for the environment later.
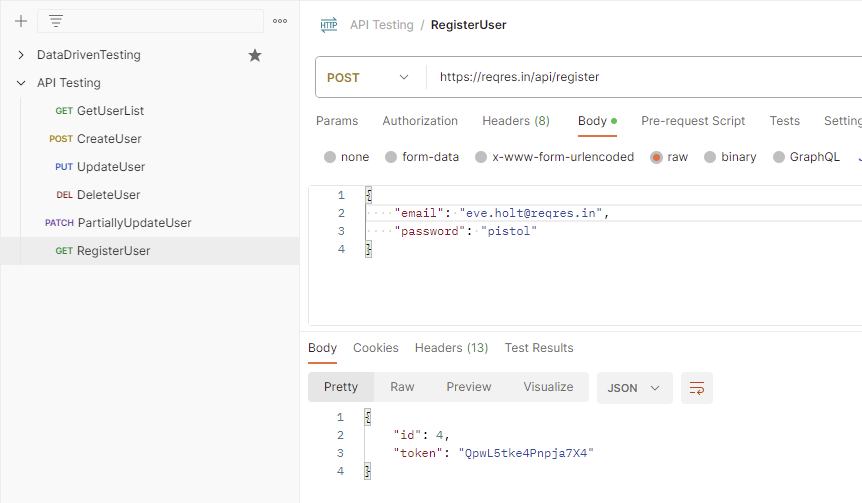
Save the request. Click on the “Send” button to verify the API returns a successful response as shown in the below image.
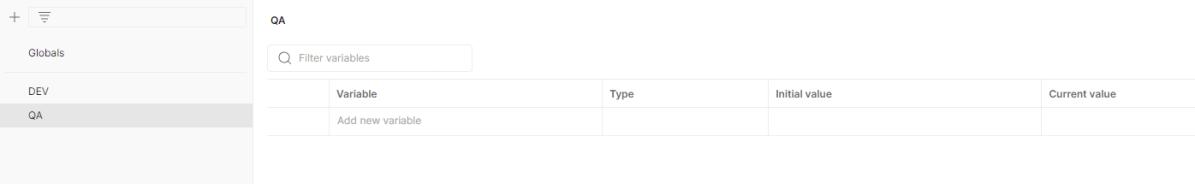
Step 2 – Create an environment and add key-value pairs (variables)
Create a new environment as explained in the above tutorial.
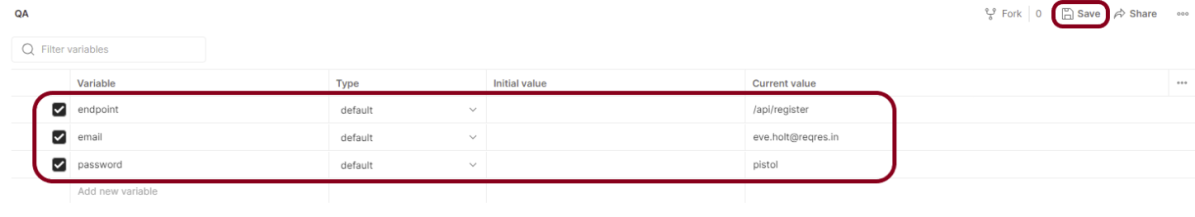
Add the values that are dynamic for different environments. Click the “Save” button to save the variables.
In the Keyfield, enter the name of the environment variable that will be used in the Postman Collection. In the Valuefield, enter the value that will replace the variable when the call is made. For example:
Enter a name for your variable, and specify its Initialand Currentvalues. By default, the current value will copy the initial value.
The Initial Value is synced to your account using the Postman servers. It’s shared with any collaborators who have access to the environment.
The Current Value is used in your local instance of Postman and is never synced to your account or shared with your team unless you choose to persist it.
Step 3 – Select the environment from dropdown
Go to the new request and select the environment created just now. In this case, I have selected “QA” environment. Refer to the newly created variables in the request.
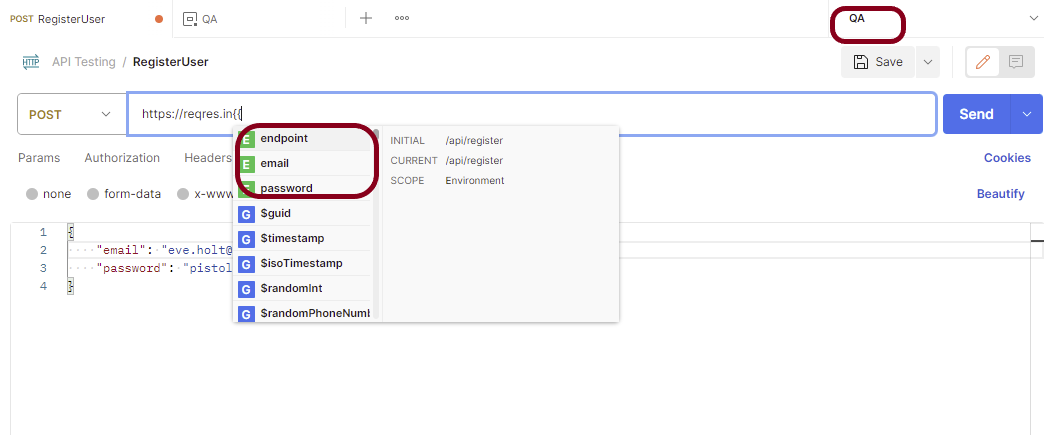
Step 4 – Refer the newly created variables in the request
Here, we can see that it is showing all 3 variables that we have defined in the previous step. To use an environment variable value in a request, reference it by name, surrounded with double curly braces:
Hover over a variable reference to get its current value.
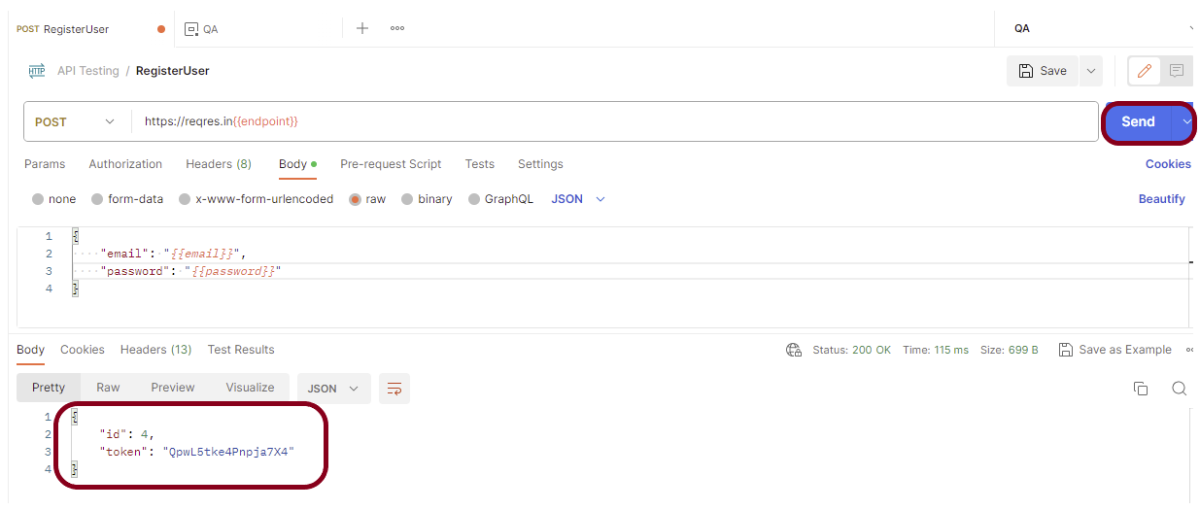
Step 5 – Run the request
Click on the “Send” button. The request will be sent, and the response displayed as in shown the below image.
Congratulations on making it through this tutorial and hope you found it useful! Happy Learning!! Cheers!!
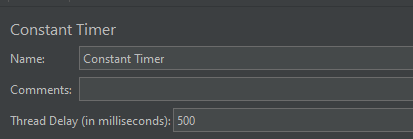
Constant Timer is used to delay the next request by a constant time which you can configure by adding the value of constant delay time.
Constant Timer has the following input fields:
Name: To provide the name of the timer. This is a non-mandatory field.
Comments: To provide arbitrary comments (if any). This is a non-mandatory field.
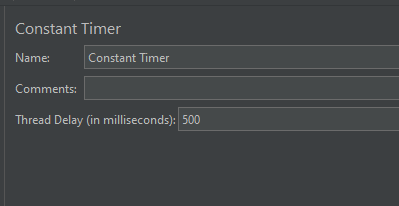
Thread Delay (in milliseconds): The pause time in milliseconds. Thread(s) will hold the execution of the sampler/request for the defined time and once the delay time is over then the sampler will be executed. This is a mandatory field.
The sample request and response used in this tutorial is shown below:
Add Thread Group To add Thread Group: Right-click on the “Test Plan” and add a new thread group: Add -> Threads (Users) -> Thread Group
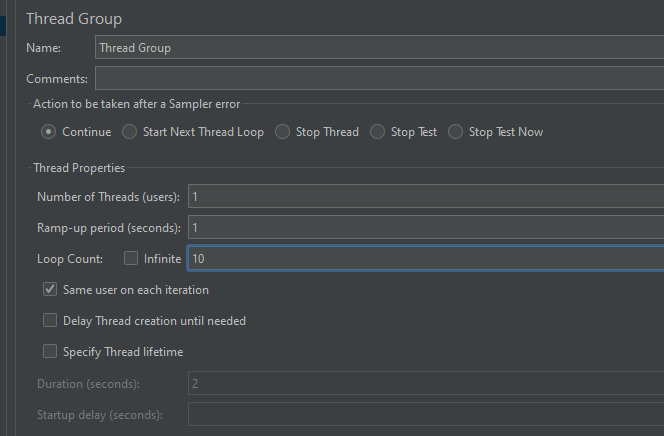
In the Thread Group control panel, enter Thread Properties as follows: We will take an example of row no 5
Number of Threads: 1 – Number of users connects to the target website Loop Count: 10 – Number of times to execute testing Ramp-Up Period: 1 – It tells JMeter how long to delay before starting the next user. For example, if we have 5 users and a 5 -second Ramp-Up period, then the delay between starting users would be 1 second (5 seconds /5 users).
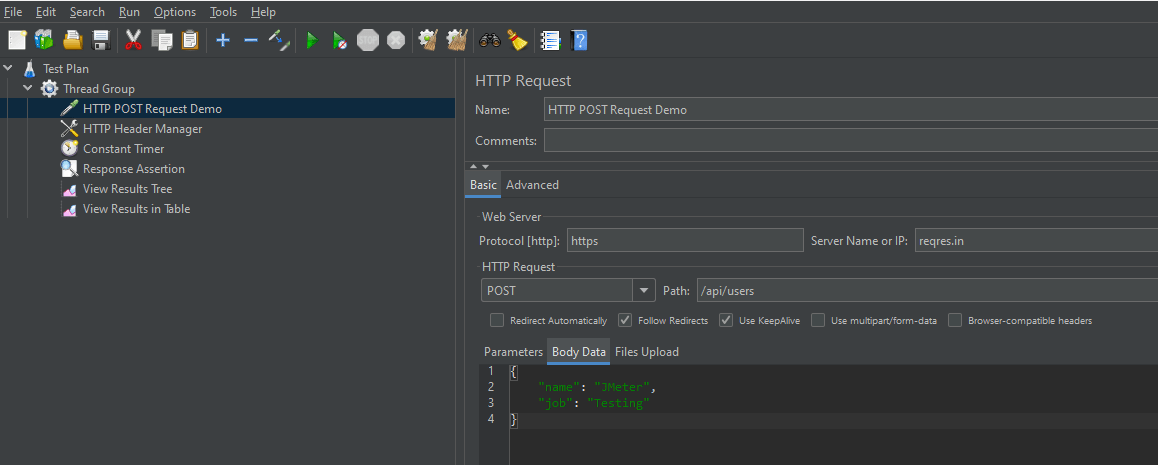
Step 2 – Add HTTP Request Sampler
The JMeter element used here is HTTP Request Sampler. In HTTP Request Control Panel, the Path field indicates which URL request you want to send
Add HTTP Request Sampler To add: Right-click on Thread Group and select: Add -> Sampler -> HTTP Request
The below-mentioned are the values used in HTTP Request to perform the test
Name – HTTP POST Request Demo
Server Name or IP – reqres.in
Protocol – https
Method – POST
Path – /api/users
Step 3 – Add HTTP Head Manager
The Header Manager lets you add or override HTTP request headers like can add Accept-Encoding, Accept, Cache-Control
To add: Right-click on Thread Group and select: Add -> Config Element -> HTTP Read Manager
The below-mentioned are the values used in Http Request to perform the test Content-type = application/json
Below is the image once HTTP Header Manager is added to the Test Plan.
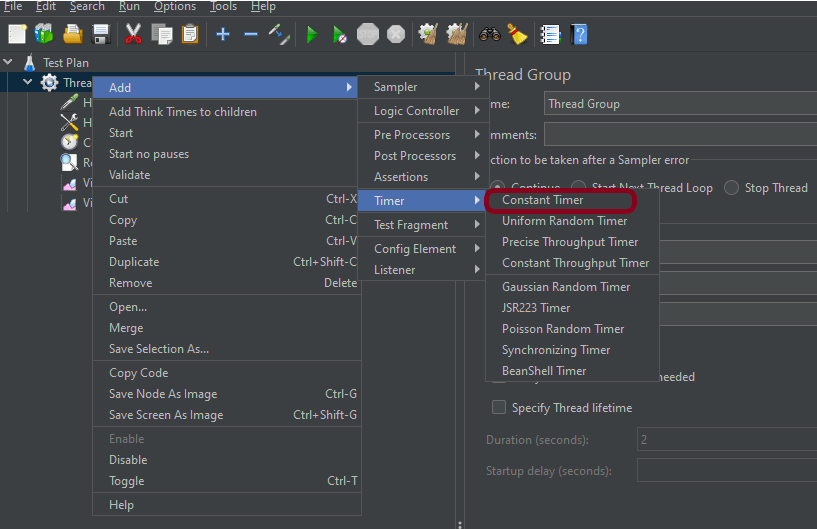
Step 4 – Add a Constant Timer
I want to have each thread pause for the same amount of time (500ms) between requests. So, configure Constant Timer.
To add: Right-click on Thread Group and select: Add -> Timer ->Constant Timer
Configuring Thread Delay of 500 milliseconds
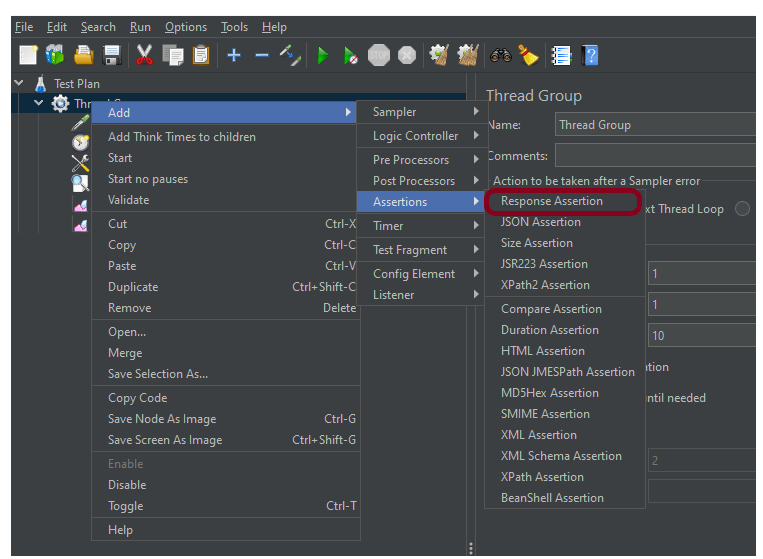
Step 5 – Adding Response Assertion to Test Plan
The response assertion control panel lets you add pattern strings to be compared against various fields of the request or response.
To add: Right-click on HTTP Request and select: Add -> Assertions-> Response Assertions
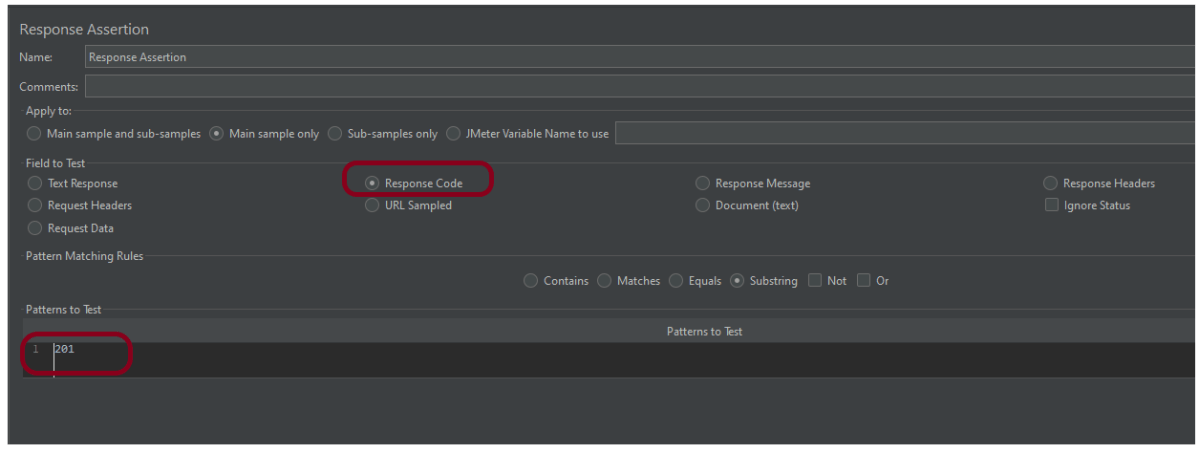
Here, I have selected the below options:-
Apply to: Main Sample only Field to Test: Response Code Pattern Matching Rules: Substring Pattern To Test: 201
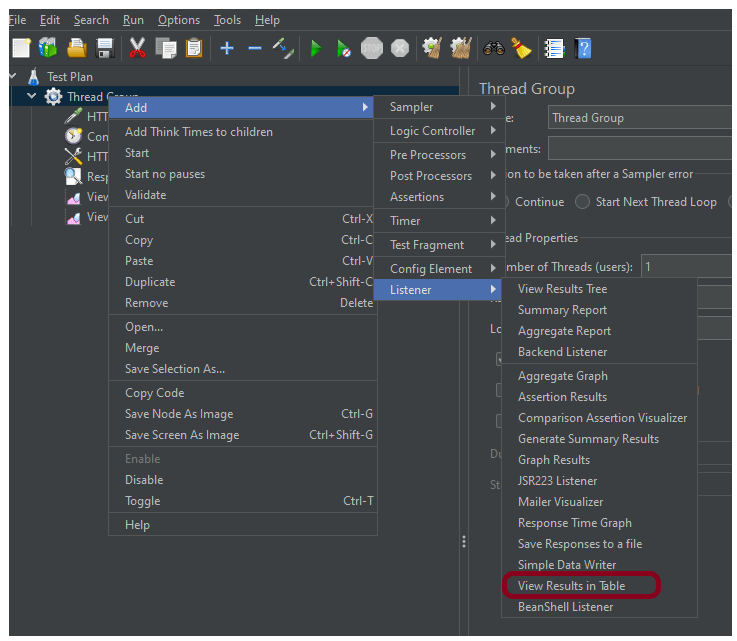
Step 6 – Adding Listeners to Test Plan
Listeners – They show the results of the test execution. They can show results in a different format such as a tree, table, graph, or log file We are adding the View Result in Table
View Result in Table – The View Result in Table listener displays information about each sample in the form of a table. To add: Right-click on Test Plan, Add -> Listener -> View Result in Table
Note – Don’t use “View Results Tree” or “View Results in Table” listeners during the load test, use them only during the scripting phase to debug your scripts.
Step 7 – Save the Test Plan
To Save: Click File Select -> Save Test Plan as ->Give the name of the Test Plan. It will be saved in .jmx format.
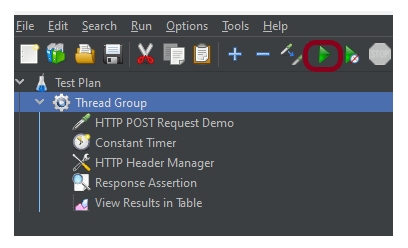
Step 8 – Run the Test Plan
Click on the Green Triangle as shown at the top to run the test.
Step 9 – View the Execution Status
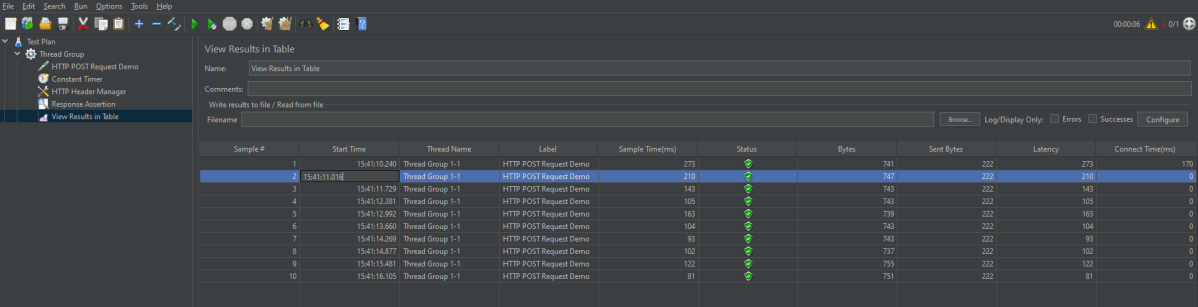
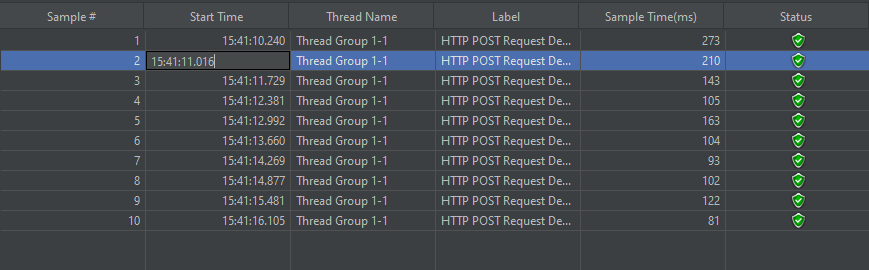
Click on View Result in Table to see the status of Run. A successful request will be of a Green colour in the Text Section.
For example, in the above figure, let’s analyse Sample 2.
Start time is 15:41:10.240
Sample Time of Sample 1 is 273 ms
Constant Timer: 500 ms (as configured)
End Time of this sample is = 15:41:10.240 + 273 + 500 = 15:41:11.013
So Sample 2 should start at the time is 15:41:11.014 (As shown in the above figure – approximately started at 16).
We are done! Congratulations on making it through this tutorial and hope you found it useful! Happy Learning!!


