In this tutorial, we will discuss the LinkedHashMap in Java.
Table of Contents
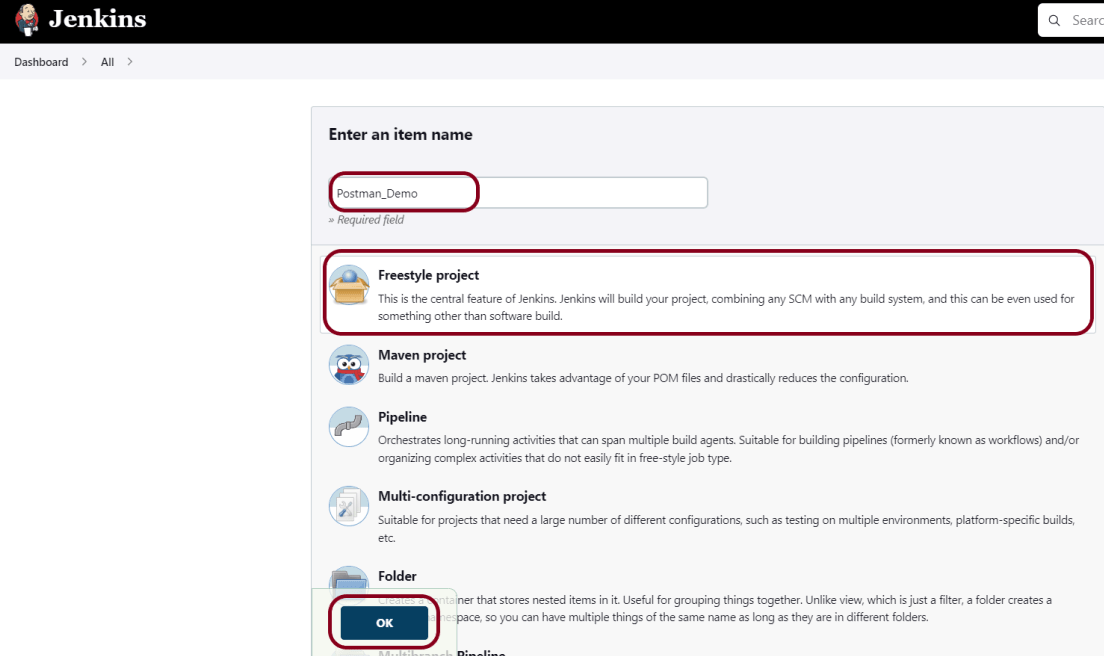
What is LinkedHashMap?
The LinkedHashMap Class is just like HashMap with an additional feature of maintaining an order of elements inserted into it. However, the linked hash map is based on both a hash table and a linked list to enhance the functionality of the hash map.
It maintains a doubly-linked list running through all its entries, in addition to an underlying array of default size 16.
LinkedHashMap contains values based on the key. It implements the Map interface and extends the HashMap class.
Create a LinkedHashMap object as shown below from:-
import java.util.LinkedHashMap;
Syntax of LinkedHashMap
LinkedHashMap<String, String> employeeDetail = new LinkedHashMap<String, String>();

LinkedHashMap<String, String> employeeDetail = new LinkedHashMap<>();

LinkedHashMap<String, Integer> employeeDetail = new LinkedHashMap<String, Integer>();
Adding the Elements
Below is an example where we are adding items to HashMap by using put() method.
import java.util.LinkedHashMap;

public class LinkedHashMap_Demo {
    public static void main(String a[]) {

        // Creating an empty LinkedHashMap
        LinkedHashMap<String, String> linkedHashMap = new LinkedHashMap<String, String>();

        // Adding entries in Map using put() method
        linkedHashMap.put("Tim", "DBA");
        linkedHashMap.put("Cillian", "SDET");
        linkedHashMap.put("Patrick", "BA");
        linkedHashMap.put("Brendan", "Dev");

        // Printing all entries inside Map
        System.out.println("Linked HashMap :" + linkedHashMap);

    }
}
The output of the above program is

Accessing an Element
To access a value in the LinkedHashMap, use the get() method and refer to its key:-
import java.util.LinkedHashMap;

public class LinkedHashMap_Demo {
    public static void main(String a[]) {

        // Creating an empty LinkedHashMap
        LinkedHashMap<String, String> linkedHashMap = new LinkedHashMap<String, String>();

        // Adding entries in Map using put() method
        linkedHashMap.put("Tim", "DBA");
        linkedHashMap.put("Cillian", "SDET");
        linkedHashMap.put("Patrick", "BA");
        linkedHashMap.put("Brendan", "Dev");

        // Printing all entries inside Map
        System.out.println("Linked HashMap :" + linkedHashMap);

        // Access a value
        System.out.println("Access Value of Key Patrick :" + linkedHashMap.get("Patrick"));

    }
}
The output of the above program is

Removing an Element
To remove an item, use the remove() method and refer to the key:
import java.util.LinkedHashMap;

public class LinkedHashMap_Demo {
    public static void main(String a[]) {

        // Creating an empty LinkedHashMap
        LinkedHashMap<String, String> linkedHashMap = new LinkedHashMap<String, String>();

        // Adding entries in Map using put() method
        linkedHashMap.put("Tim", "DBA");
        linkedHashMap.put("Cillian", "SDET");
        linkedHashMap.put("Patrick", "BA");
        linkedHashMap.put("Brendan", "Dev");

        // Printing all entries inside Map
        System.out.println("Linked HashMap :" + linkedHashMap);

        // Removing the mapping with Key Brendan
        linkedHashMap.remove("Brendan");

        // Printing the updated map
        System.out.println("Updated Map :" + linkedHashMap);

    }
}
The output of the above program is

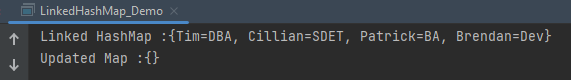
To remove all items, use the clear() method:-
import java.util.LinkedHashMap;

public class LinkedHashMap_Demo {
    public static void main(String a[]) {

        // Creating an empty LinkedHashMap
        LinkedHashMap<String, String> linkedHashMap = new LinkedHashMap<String, String>();

        // Adding entries in Map using put() method
        linkedHashMap.put("Tim", "DBA");
        linkedHashMap.put("Cillian", "SDET");
        linkedHashMap.put("Patrick", "BA");
        linkedHashMap.put("Brendan", "Dev");

        // Printing all entries inside Map
        System.out.println("Linked HashMap :" + linkedHashMap);

        // Removing the mapping with Key Brendan
        linkedHashMap.clear();

        // Printing the updated map
        System.out.println("Updated Map :" + linkedHashMap);

    }
}
The output of the above program is
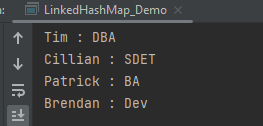
Iterating through the LinkedHashMap
There are multiple ways to iterate through the LinkedHashMap. The most famous way is to use a for-each loop over the set view of the map (fetched using the map.entrySet() instance method). Then for each entry (set element), the values of key and value can be fetched using the getKey() and the getValue() method.
import java.util.LinkedHashMap;
import java.util.Map;

public class LinkedHashMap_Demo {
    public static void main(String a[]) {

        // Creating an empty LinkedHashMap
        LinkedHashMap<String, String> linkedHashMap = new LinkedHashMap<String, String>();

        // Adding entries in Map using put() method
        linkedHashMap.put("Tim", "DBA");
        linkedHashMap.put("Cillian", "SDET");
        linkedHashMap.put("Patrick", "BA");
        linkedHashMap.put("Brendan", "Dev");

        // For-each loop for traversal over Map
        for (Map.Entry<String, String> mapElement : linkedHashMap.entrySet()) {

            String key = mapElement.getKey();

            // Finding the value
            // using getValue() method
            String value = mapElement.getValue();

            // Printing the key-value pairs
            System.out.println(key + " : " + value);
        }
    }
}
The output of the above program is
Methods in LinkedHashMap
import java.util.LinkedHashMap;

public class LinkedHashMap_Demo {
    public static void main(String a[]) {

        // Creating an empty LinkedHashMap
        LinkedHashMap<String, String> linkedHashMap = new LinkedHashMap<String, String>();

        // Adding entries in Map using put() method
        linkedHashMap.put("Tim", "DBA");
        linkedHashMap.put("Cillian", "SDET");
        linkedHashMap.put("Patrick", "BA");
        linkedHashMap.put("Brendan", "Dev");

        // Getting and printing value for a specific key
        System.out.println("Getting value for key 'Patrick' :" + linkedHashMap.get("Patrick"));

        // Getting size of Map using size() method
        System.out.println("Size of the map :" + linkedHashMap.size());

        // Checking whether Map is empty or not
        System.out.println("Is map empty? :" + linkedHashMap.isEmpty());

        // Using containsKey() method to check for a value
        System.out.println("Contains value 'SDET' "  + linkedHashMap.containsValue("SDET"));

        // Using containsKey() method to check for a key
        System.out.println("Contains key 'Brendan'? :" + linkedHashMap.containsKey("Brendan"));

        // Removing entry using remove() method
        System.out.println("Delete element 'Brendan' :" + linkedHashMap.remove("Brendan"));

        // Printing mappings to the console
        System.out.println("Mappings of LinkedHashMap :" + linkedHashMap);
        }
}
The output of the above program is

We are done! Congratulations on making it through this tutorial and hope you found it useful! Happy Learning!!


