Apache JMeter is a popular open-source performance testing tool. It is a 100% pure Java application designed to load test functional behaviour and measure performance. It was originally designed for testing Web Applications but has since expanded to other test functions.
Parameterization is a method that allows us to run a test plan several times with various sets of data. This aids in the development of a load test script that closely resembles real-world circumstances in which various users utilize different test data. Assume we need to do a load test on a search engine such as Bing. The initial step will be to document the search circumstance. To conduct an effective load test, we cannot just playback the script for 500 users. We should mimic 500 distinct users searching for 500 different items. We may utilize parameterization for this, with a CSV file containing 500 distinct search phrases. Now instead of the static search item that we had recorded in our script, we can include the search items from the CSV file dynamically.
Add Thread Group To add Thread Group: Right-click on the “Test Plan” and add a new thread group: Add -> Threads (Users) -> Thread Group
In the Thread Group control panel, enter Thread Properties as follows: We will take an example of row no 5
Number of Threads: 5 – Number of users connects to the target website Loop Count: 2 – Number of times to execute testing Ramp-Up Period: 5 – It tells JMeter how long to delay before starting the next user. For example, if we have 5 users and a 5 -second Ramp-Up period, then the delay between starting users would be 1 second (5 seconds /5 users).
Step 2 – Add HTTP Request Sampler
The JMeter element used here is HTTP Request Sampler. In HTTP Request Control Panel, the Path field indicates which URL request you want to send
Add HTTP Request Sampler To add: Right-click on Thread Group and select: Add -> Sampler -> HTTP Request
The below-mentioned are the values used in HTTP Request to perform the test
Name – Parameterized HTTP Request
Server Name or IP – reqres.in
Port –
Protocol – https
Method – POST
Path – /api/users
Here, we are parameterizing the test data for name and job attributes.
Step 3 – Add HTTP Head Manager
The Header Manager lets you add or override HTTP request headers like can add Accept-Encoding, Accept, Cache-Control
To add: Right-click on Thread Group and select: Add -> Config Element -> HTTP Read Manager
The below-mentioned are the values used in Http Request to perform the test Content-type = application/json
Below is the image once HTTP Header Manager is added to the Test Plan.
Step 4 – Add CSV Data Set Config
The ‘CSV Data Set Config’ element is used to read lines from a file and split them into variables. It is well suited to handle large numbers of variables and is also useful for testing with random and unique values.
To add: Right-click on Thread Group and select: Add -> Config Element -> CSV Data Set Config
Fill in the data in the required fields.
Let’s have a look at how the CSV Data Set is configured:
Filename: the path to the CSV file containing the data,
File Encoding: can be UTF-8 for example. The character encoding affects how the file is read,
Variable Names: comma-delimited list of names, should be an equal number of names than columns in CSV file. Example: name, job.
Ignore First Line: false by default, whenever to ignore the first line as a value (because it may contain the column names),
Delimiter: , by default, can be set to anything else. Suggestion: stick with the default one,
Allow Quoted Data: false by default, set to true if you have double quotes in CSV columns,
Recycle on EOF: true by default, should JMeter restart from the beginning when the End Of File is reached,
Stop Thread on EOF: stops the current thread gathering the value if EOF is reached,
Sharing Mode: defines how values are distributed among concurrent threads.
Below is the CSV file that has the data for the name and job attributes of the request.
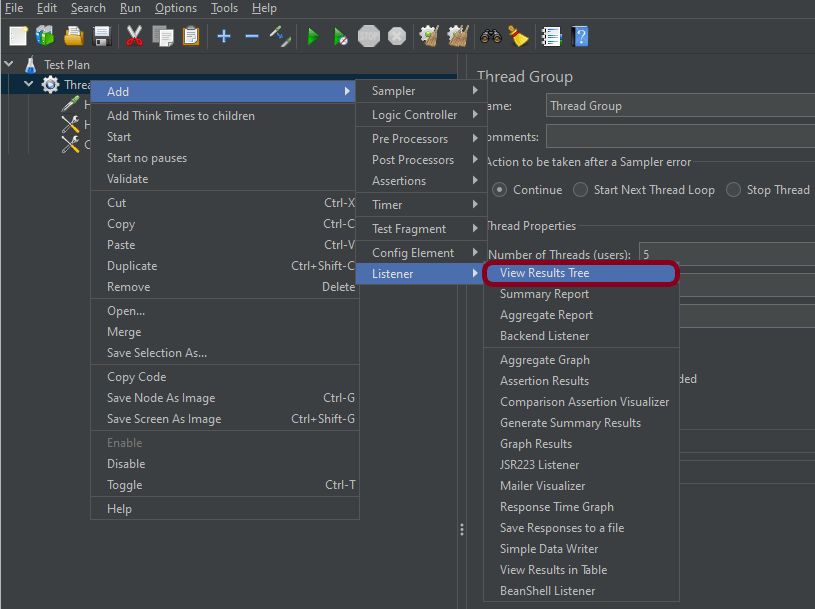
Step 5 – Adding Listeners to Test Plan
Listeners – They show the results of the test execution. They can show results in a different format such as a tree, table, graph, or log file We are adding the View Result Tree listener
View Result Tree – View Result Tree shows the results of the user request in basic HTML format To add: Right-click on Test Plan, Add -> Listener -> View Result Tree
Note – Don’t use “View Results Tree” or “View Results in Table” listeners during the load test, use them only during the scripting phase to debug your scripts.
Aggregate Report
It is almost the same as Summary Report except Aggregate Report gives a few more parameters like, “Median”, “90% Line”, “95% Line” and “99% Line”.
To add: Right Click on Thread Group > Add > Listener > Aggregate Report
Step 6 – Save the Test Plan
To Save: Click File Select -> Save Test Plan as ->Give the name of the Test Plan. It will be saved in .jmx format.
Step 7 – Run the Test Plan
Click on the Green Triangle as shown at the top to run the test.
Step 8 – View the Execution Status
Click on View Result Tree to see the status of Run. A successful request will be of a Green colour in the Text Section.
We can see that Performance and Test2 are present in the CSV file. The script has to read the data from the file and passed it to the request.
Click on Response data and Response Header to view other information about Response.
Click on Aggregate Report Result to see the aggregated status of Run.
We are done! Congratulations on making it through this tutorial and hope you found it useful! Happy Learning!!


