Saving JMeter test results in multiple formats like CSV and XML is beneficial. It allows for detailed analysis and flexibility in processing. This flexibility is useful for reporting. Here’s a detailed guide on how to save or export the results of your Apache JMeter test script to a CSV or XML file.
Table of Contents
- Prerequisite
- Implementation Steps
- Create a Test Plan in JMeter
- Add Thread Group
- Adding JMeter elements
- Add Response Assertion
- Adding Listeners to save result as CSV File
- Save the Test Plan
- Run the Test Plan
- View the Execution Status
- Save result as XML File
- Save result as dynamic Filename
- Save results to current test script location
- Troubleshooting
Prerequisite:
Install JMeter on your system.
Implementation Steps
The sample request and response used in this tutorial are shown below:
Sample Request
<?xml version="1.0" encoding="utf-8"?>
<soap:Envelope xmlns:soap="http://schemas.xmlsoap.org/soap/envelope/">
  <soap:Body>
    <NumberToWords xmlns="http://www.dataaccess.com/webservicesserver/">
      <ubiNum>500</ubiNum>
    </NumberToWords>
  </soap:Body>
</soap:Envelope>
Sample Response
<?xml version="1.0" encoding="utf-8"?>
<soap:Envelope xmlns:soap="http://schemas.xmlsoap.org/soap/envelope/">
  <soap:Body>
    <m:NumberToWordsResponse xmlns:m="http://www.dataaccess.com/webservicesserver/">
      <m:NumberToWordsResult>five hundred </m:NumberToWordsResult>
    </m:NumberToWordsResponse>
  </soap:Body>
</soap:Envelope>
1. Create a Test Plan in JMeter
Create a new test plan in JMeter by selecting File > New Test Plan. We can provide name to the test plan (e.g., “SOAP Test Plan”) and click Create. This will create a new test plan with a default thread group.

2. Add Thread Group
- Select Test Plan on the tree
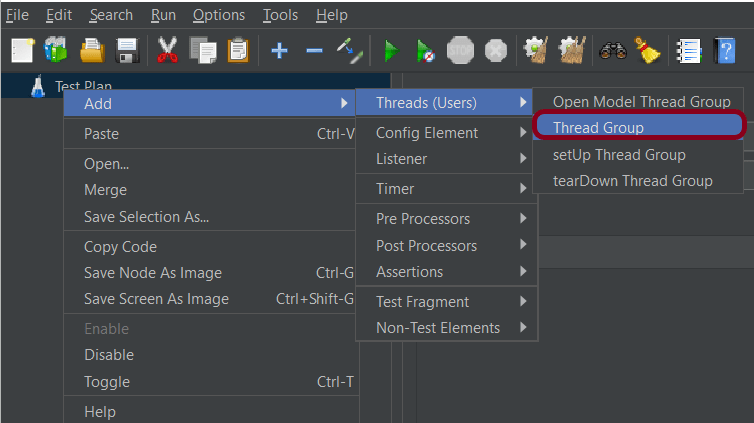
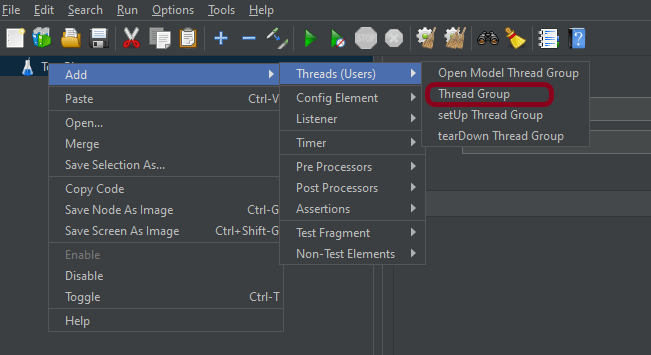
- Add Thread Group
- To add Thread Group: Right-click on the “Test Plan” and add a new thread group: Add -> Threads (Users) -> Thread Group

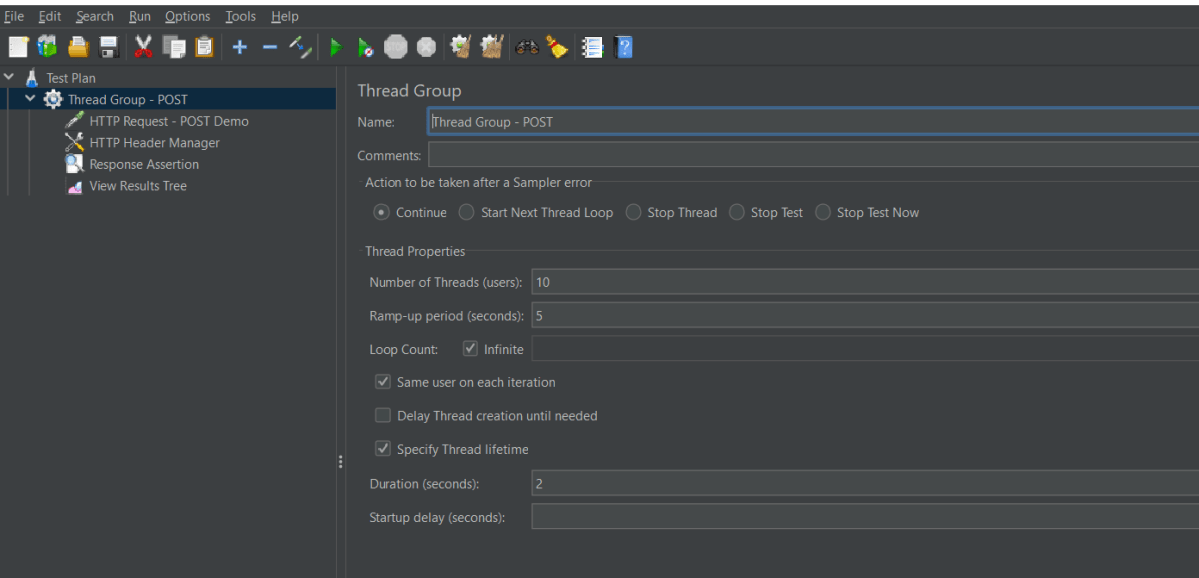
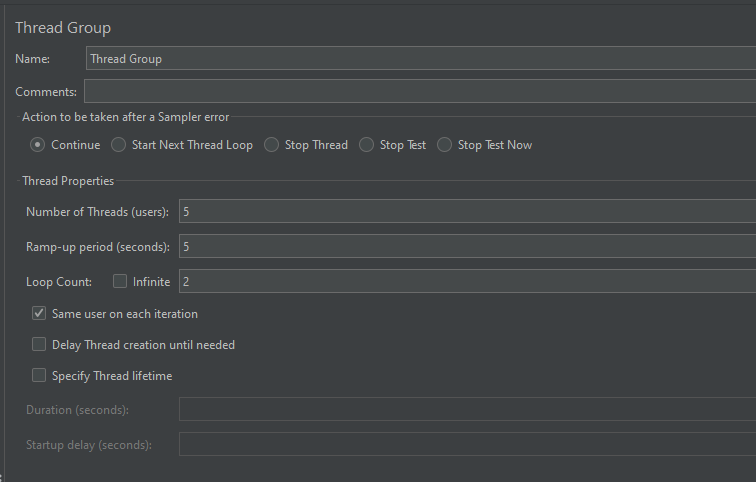
In the Thread Group control panel, enter Thread Properties as follows:
- Number of Threads: 10 – Number of users connects to the target website
- Loop Count: 5 – The loop count specifies how many times each thread will execute. Given a loop count of 5, each of the 10 threads will run the entire test sequence 5 times. In total, this results in 50 iterations across all threads (10 threads x 5 loops).
- Ramp-Up Period: 5 – It tells JMeter how long to delay before starting the next user. A ramp-up period of 5 seconds means that JMeter will start a new thread every 0.5 seconds (calculated as total ramp-up time divided by number of threads: 5 seconds / 10 threads = 0.5 seconds).

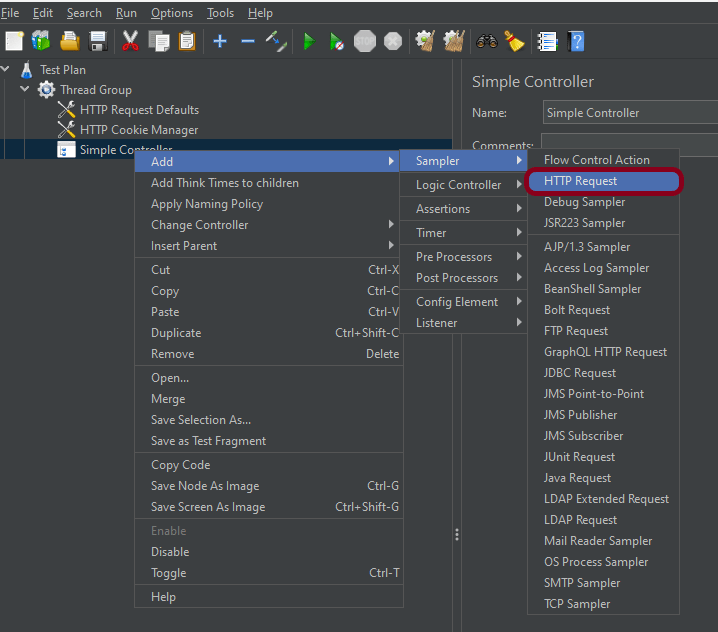
3. Adding JMeter elements
The JMeter element used here is HTTP Request Sampler. In the HTTP Request Control Panel, the Path field indicates which URL request you want to send
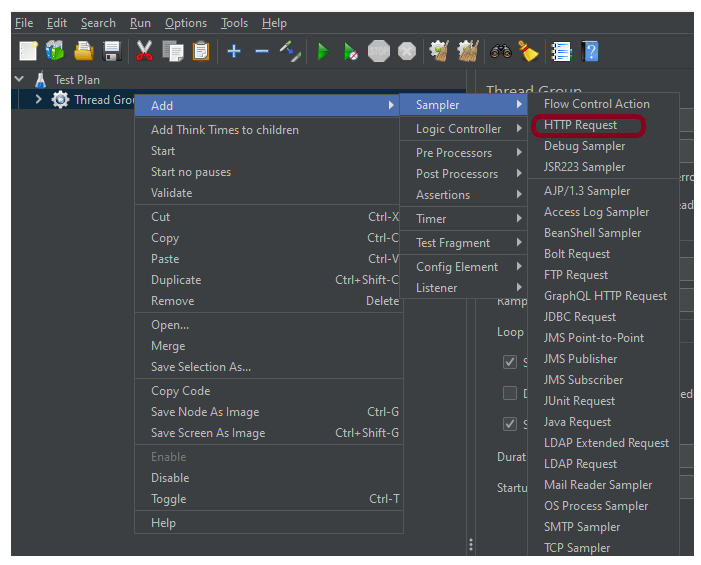
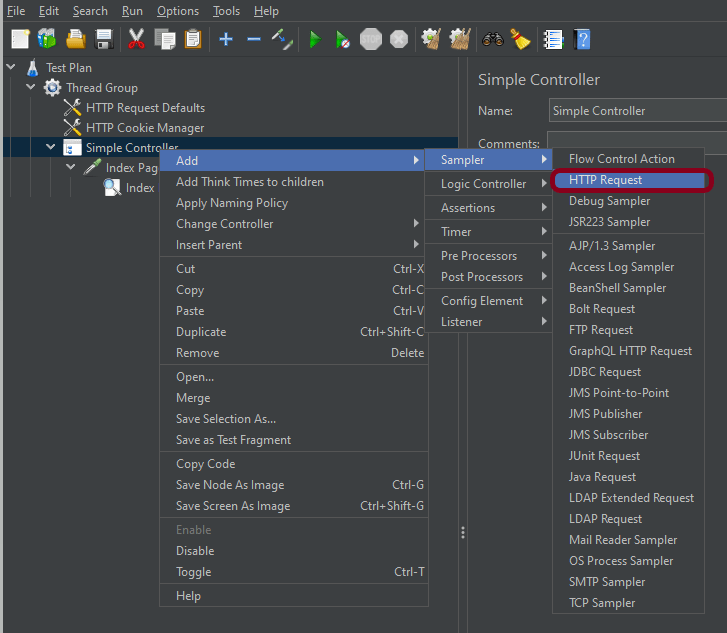
Add HTTP Request
To add: Right-click on Thread Group and select: Add -> Sampler -> HTTP Request

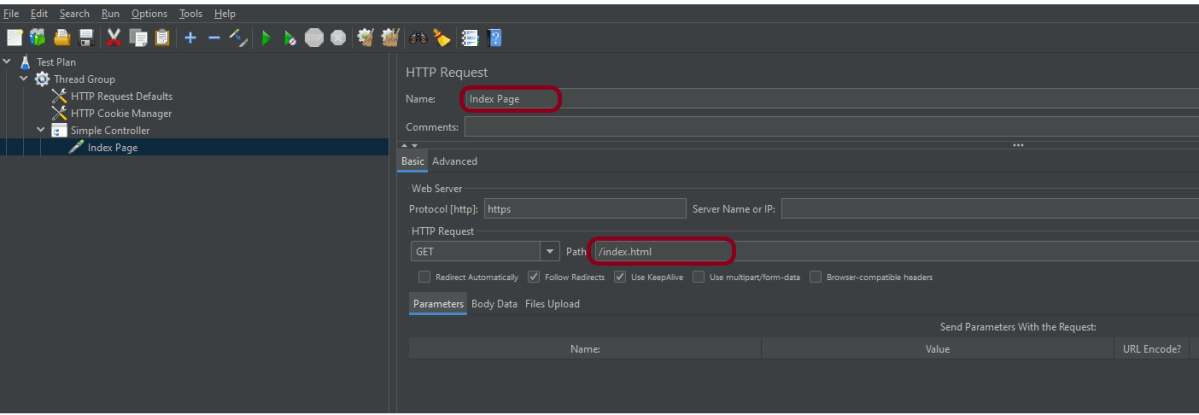
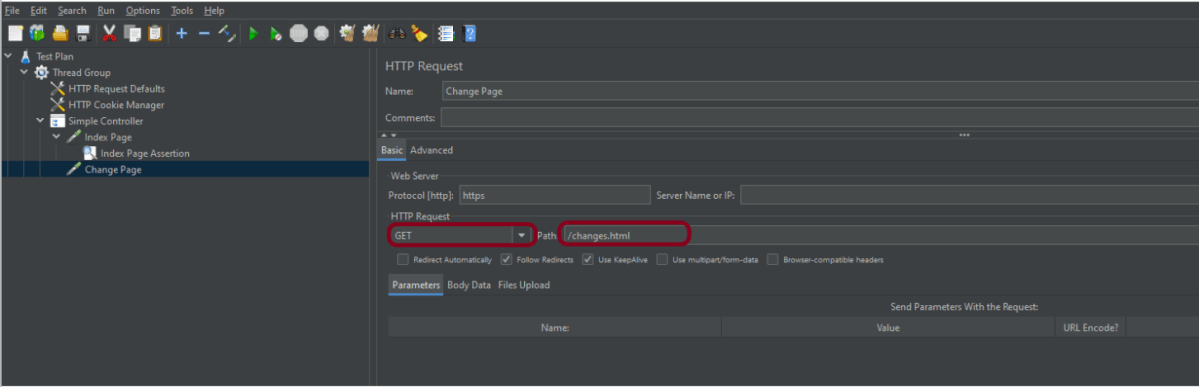
The below-mentioned are the values used in HTTP Request to perform the test
- Protocol– https
- Server Name or IP – “www.dataaccess.com”
- Method – POST
- Path – /webservicesserver/NumberConversion.wso

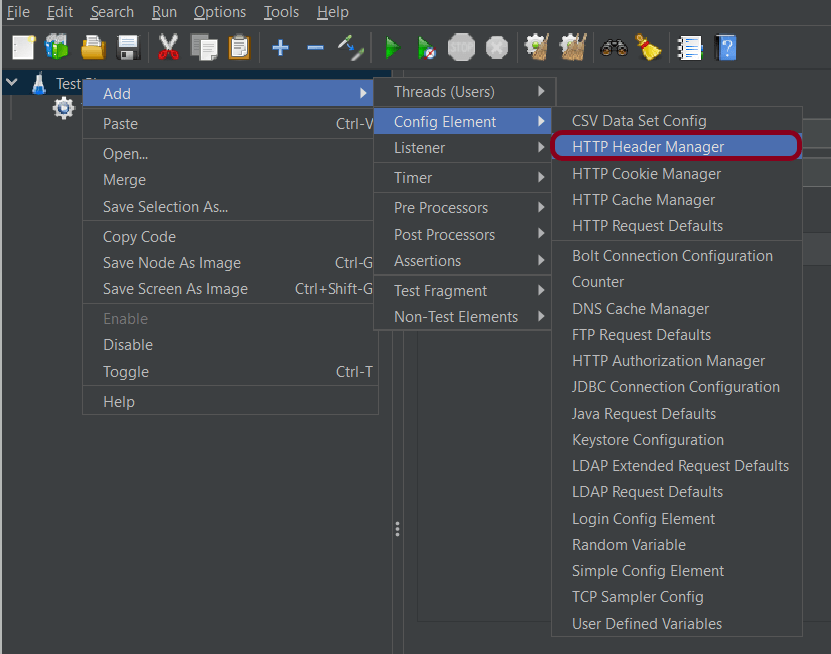
Add HTTP Head Manager
SOAP requests require specific content-type headers. The Header Manager lets you add or override HTTP request headers like can add Accept-Encoding, Accept, Cache-Control
To add: Right-click on Thread Group and select: Add -> Config Element -> HTTP Read Manager

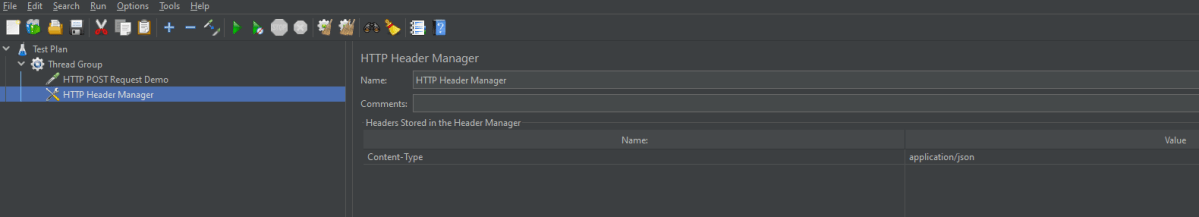
The below-mentioned are the values used in Http Request to perform the test
Content-type = text/xml

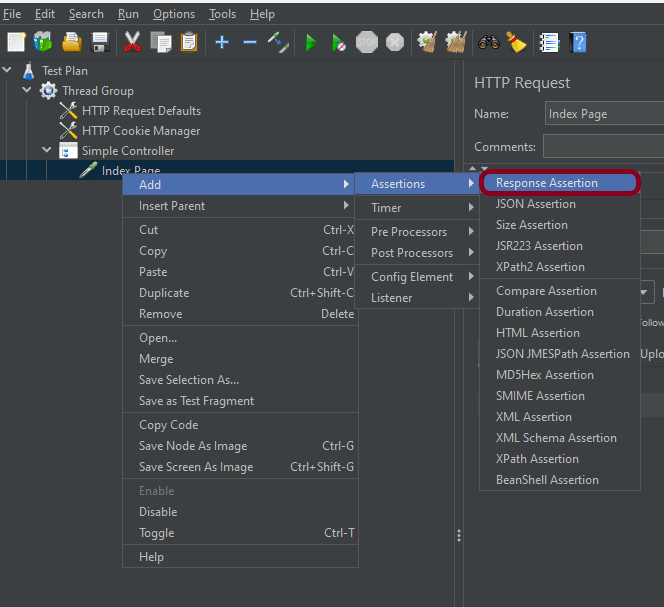
4. Add Response Assertion
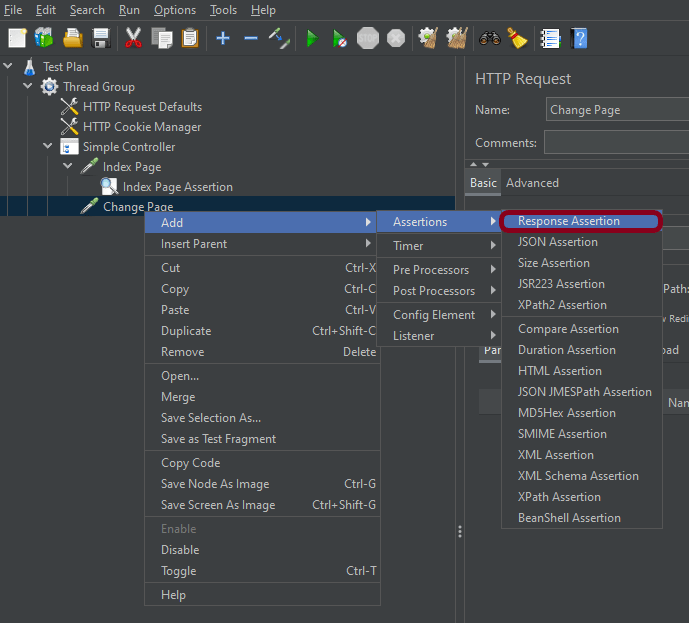
Add a “Response Assertion” to check for expected values, tags, or response status codes in the XML response.
To add: Right-click on Thread Group and select: Add -> Assertions-> Response Assertions

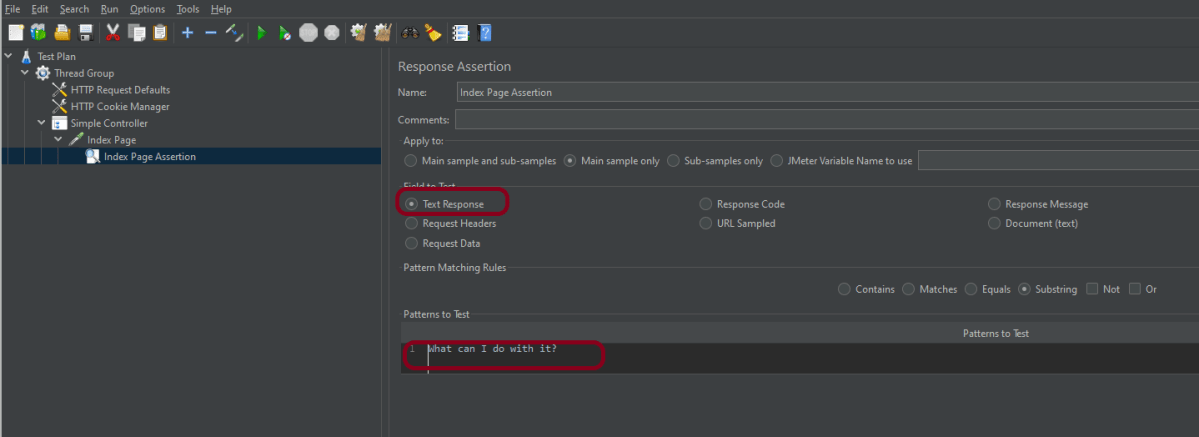
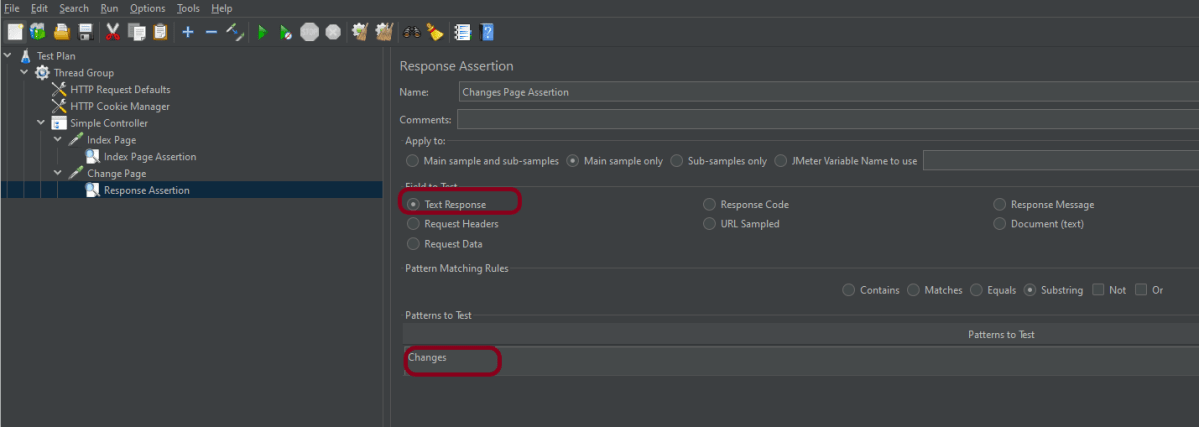
Here, I have selected below options:-
Apply to : Main Sample only
Field to Test: Response Code
Pattern To Test: 200

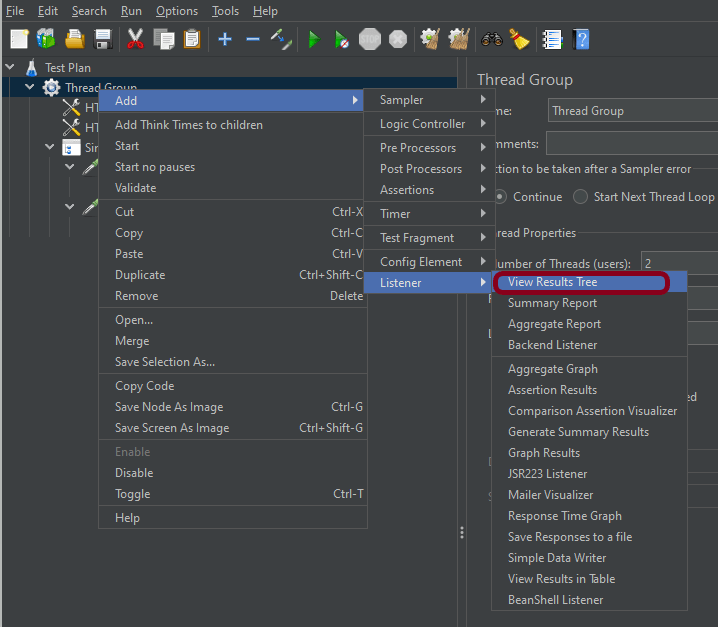
5. Adding Listeners to save result as CSV File
Listeners – They show the results of the test execution. They can show results in a different format such as a tree, table, graph, or log file
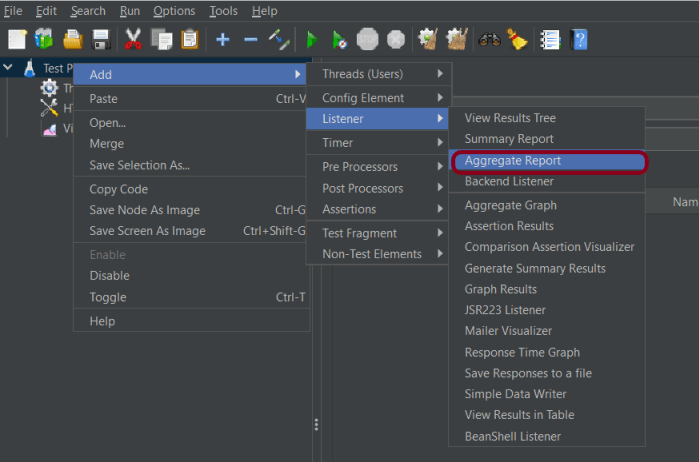
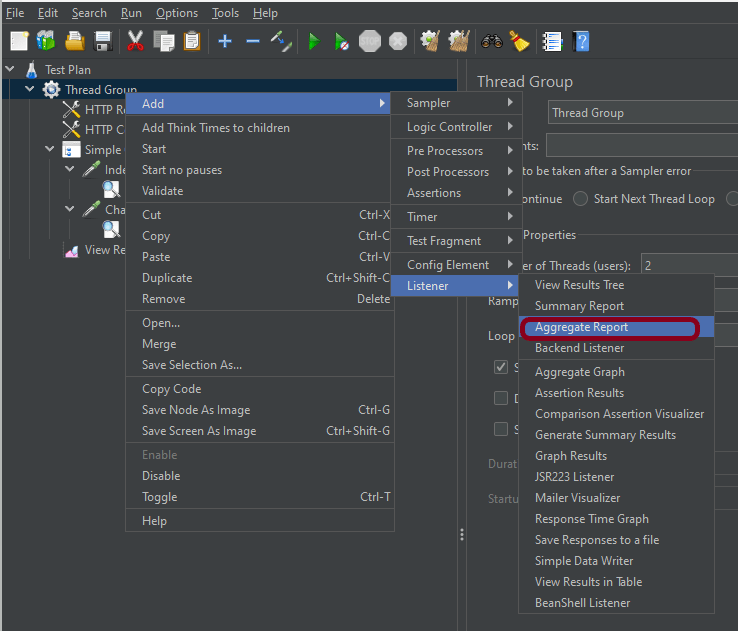
We are adding the Aggregate Report listener.
Aggregate Report
It is almost the same as Summary Report except Aggregate Report gives a few more parameters like, “Median”, “90% Line”, “95% Line” and “99% Line”.
To add: Right Click on Thread Group > Add > Listener > Aggregate Report

Configure the filename in the Filename field of the Aggregate Report i.e.: [FULLPATH]/results.csv, where [FULLPATH] is the path on the disk to the directory where you want to save the Apache

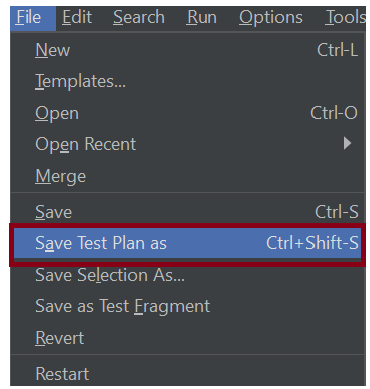
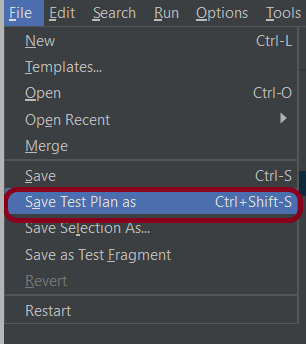
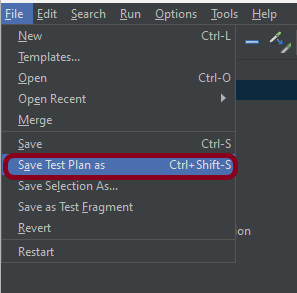
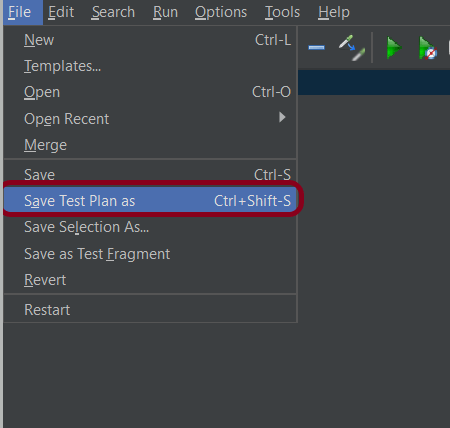
6. Save the Test Plan
To Save: Click File and Select -> Save Test Plan as ->Give the name of the Test Plan. It will be saved in .jmx format.
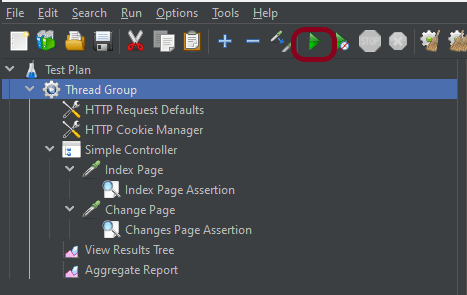
7. Run the Test Plan
Click on the Green Triangle as shown at the top to run the test.

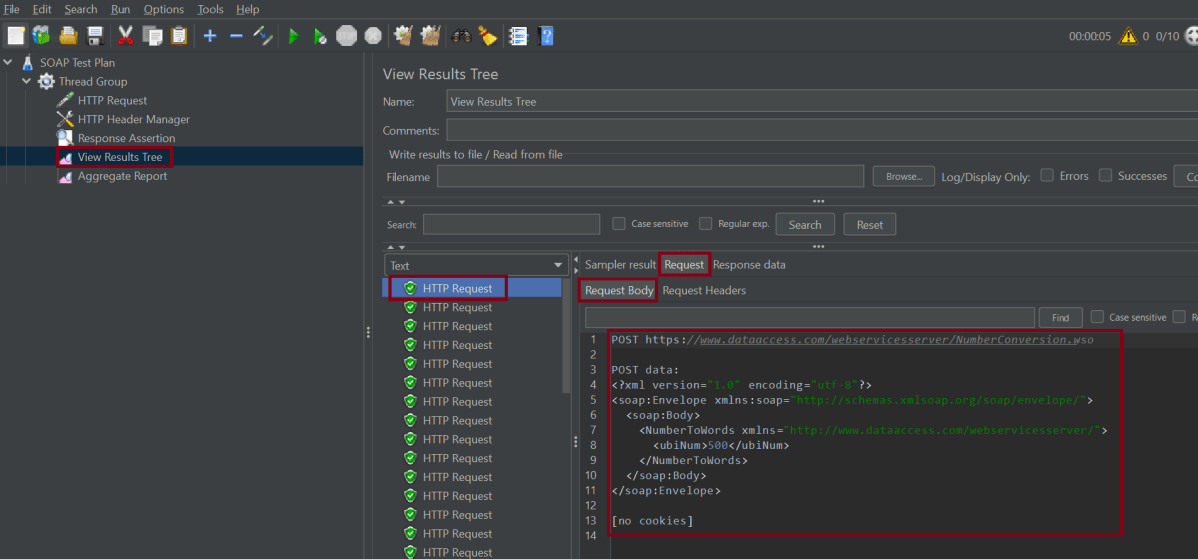
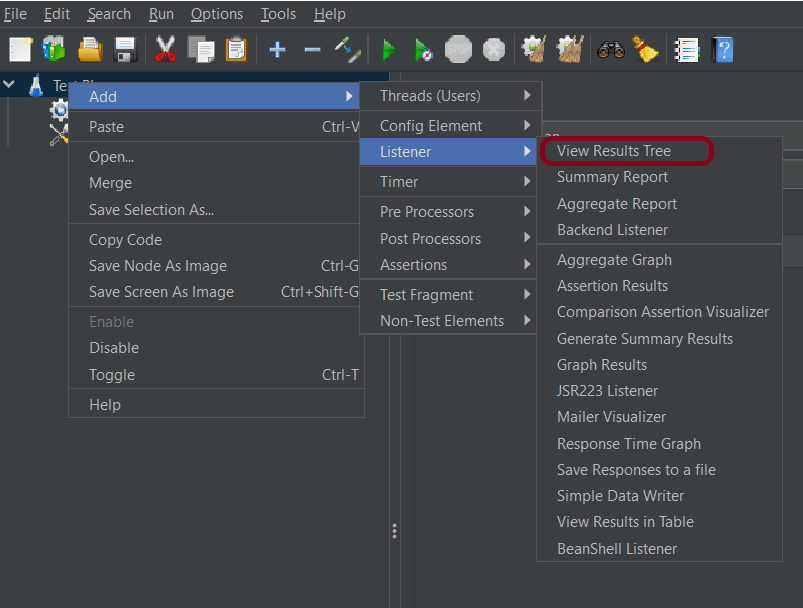
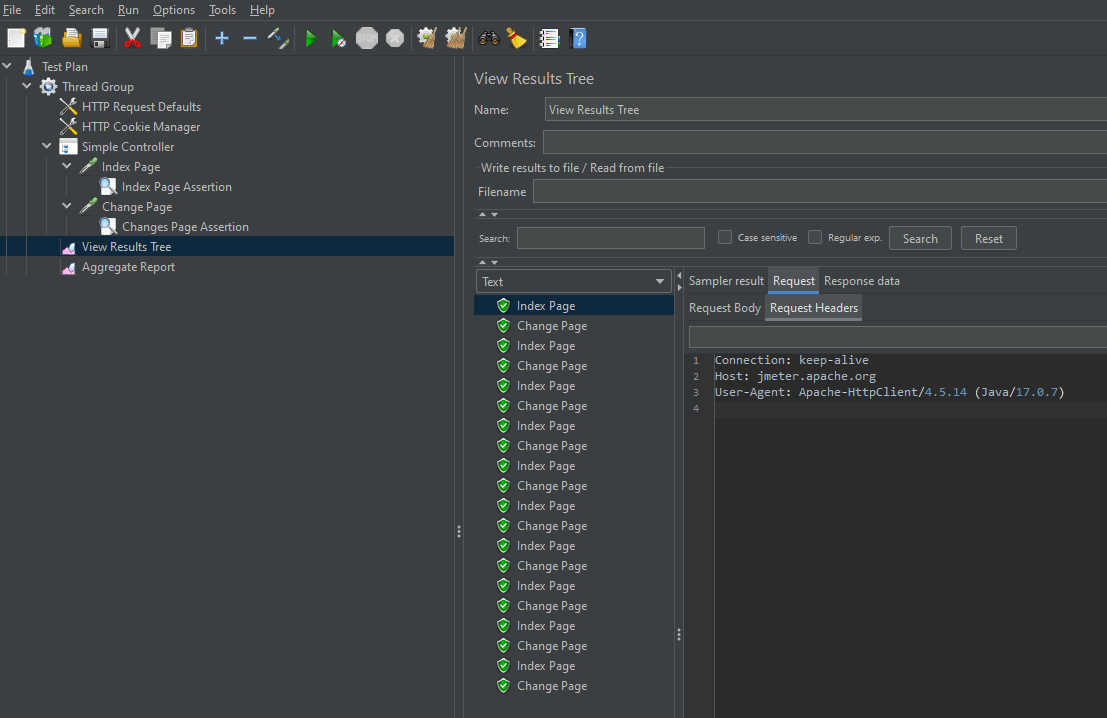
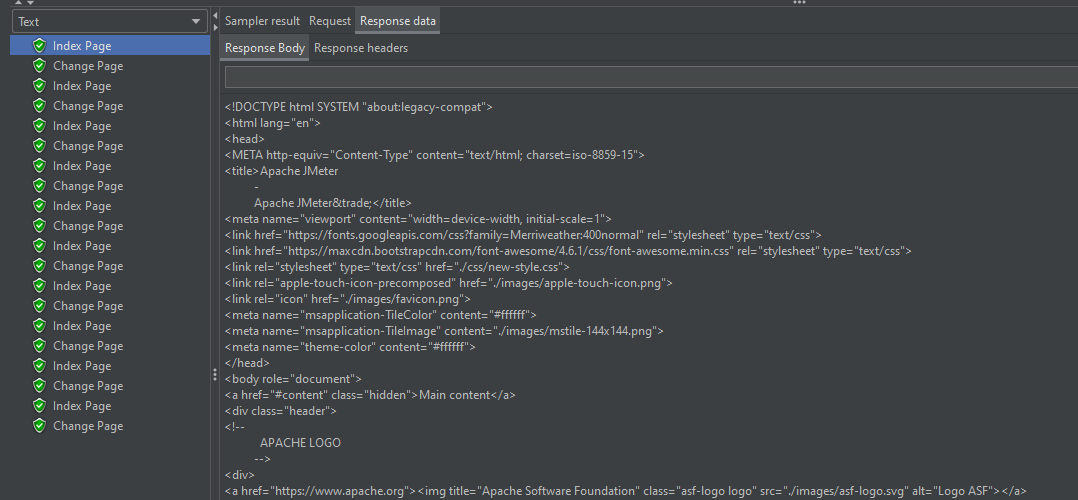
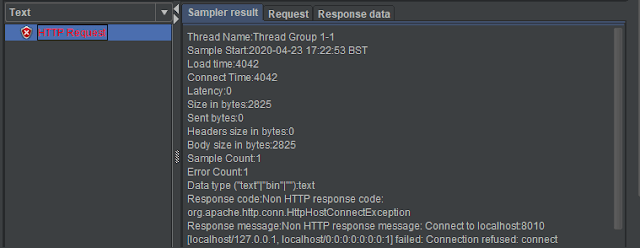
8. View the Execution Status
Click on View Result Tree to see the status of Run. A successful request will be of a Green color in the Text Section.
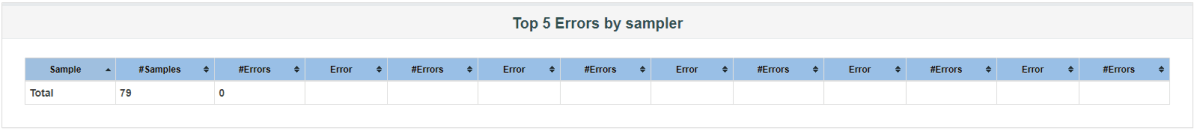
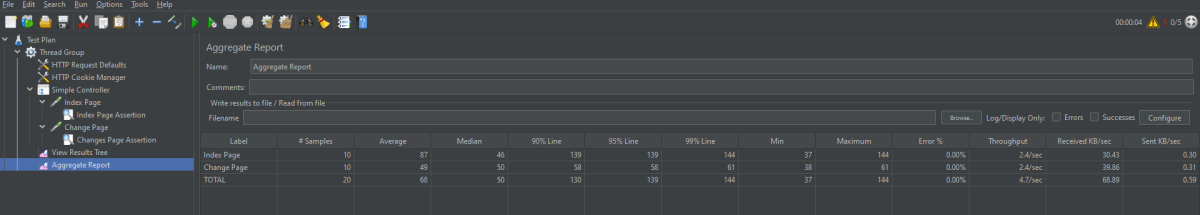
Click on Aggregate Report Result to see the aggregated status of Run.

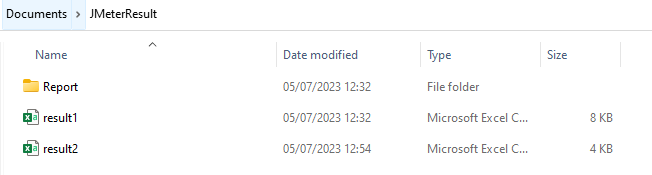
A file with the Aggregate_Result.csv name will now be created at the path specified.

Below is the image of the Aggregate_Result.csv file.

9. Save result as XML File
Configure the filename in the Filename field of the Aggregate Report i.e.: [FULLPATH]/results.xml where [FULLPATH] is the path on the disk to the directory where you want to save the Apache JMeter results.

Repeat step 6,7 and 8
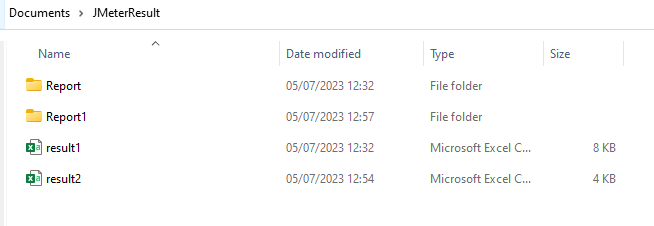
A file with the Aggregate_Result.xml name will now be created at the path specified.

10. Save result as dynamic Filename
In order not to overwrite the result values from the JMeter script, we can append a timestamp to the filename:
C:\Users\Vibha\Desktop\Automation\Performance_Testing\AggregateResult_${__time(yyyyMMdd-HHmmss)}.csv
C:\Users\Vibha\Desktop\Automation\Performance_Testing\ggregateResult_${__time(yyyyMMdd-HHmmss)}.xml

Repeat step 6,7 and 8
A file with the name of AggregateResult_20250502-102536.csv will now be created at the path specified.

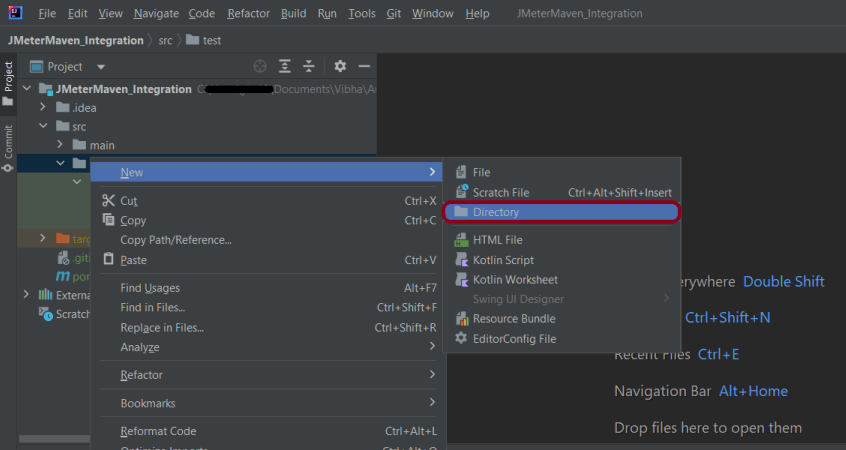
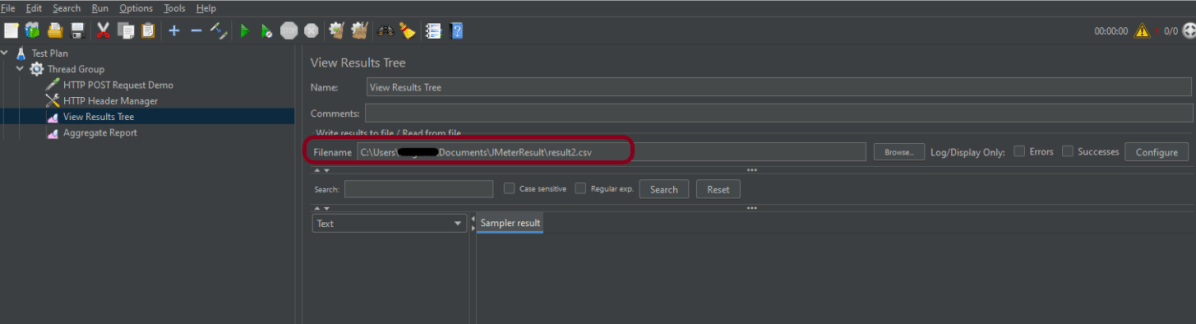
11. Save results to current test script location
Use the current test script location as the destination of your Apache JMeter test scripts. Add the below path in Listener. Here, I’m using the Aggregate Listener.
${__property(user.dir)}${__BeanShell(File.separator,)}PerformanceResult_${__time(yyyyMMdd-HHmmss)}.csv
${__property(user.dir)}${__BeanShell(File.separator,)}PerformanceResult_${__time(yyyyMMdd-HHmmss)}.xml
Repeat step 6,7 and 8
A file with the name of PerformanceResult_20250502-103227.csv will now be created at the path specified.

12. Troubleshooting
Incorrect SOAP Request Format
Received server errors due to incorrect SOAP messages. Ensure the SOAP Envelope is correctly formatted according to the Web Service Description Language (WSDL).
Resource Limitations
JMeter runs out of memory or experiences high CPU usage. Run tests in Non-GUI mode to reduce resource consumption.
Handling Dynamic Data
Failing tests due to unexpected dynamic response content. Use PostProcessors like Regular Expression Extractor or JSON Extractor to capture and handle dynamic data effectively.
Note:- Generating large result files can impact JMeter’s memory and performance, especially with a high number of test samples.
We are done! Congratulations on making it through this tutorial and hope you found it useful! Happy Learning!!
Additional Tutorials


