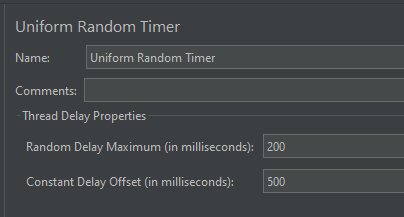
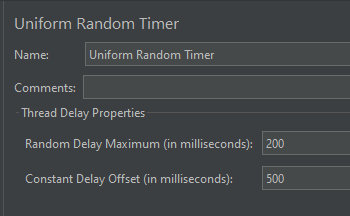
This timer pauses each thread request for a random amount of time, with each time interval having the same probability of occurring. The total delay is the sum of the random value and the offset value.
Uniform Random Timer has the following input fields:
Name: To provide the name of the timer. This is a non-mandatory field.
Comments: To provide arbitrary comments (if any). This is a non-mandatory field.
Random Delay Maximum (in milliseconds): Maximum random number of milliseconds to pause. This is a mandatory field.
Constant Delay Offset (in milliseconds): The pause time in milliseconds. Thread(s) will hold the execution of the sampler/request for the defined time and once the delay time is over then the sampler will be executed. This is a mandatory field.
The sample request and response used in this tutorial is shown below:
Add Thread Group To add Thread Group: Right-click on the “Test Plan” and add a new thread group: Add -> Threads (Users) -> Thread Group
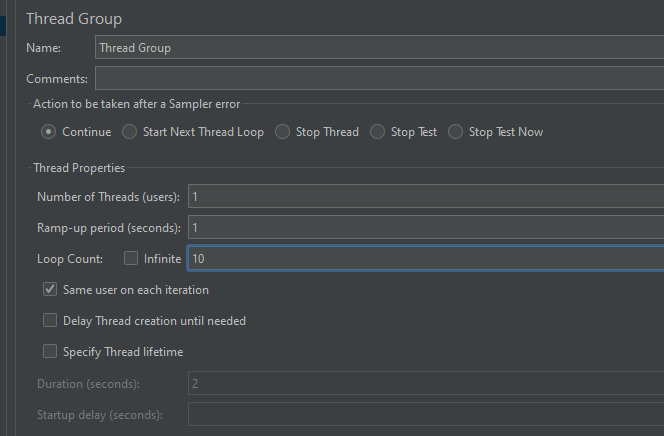
In the Thread Group control panel, enter Thread Properties as follows: We will take an example of row no 5
Number of Threads: 1 – Number of users connects to the target website Loop Count: 10 – Number of times to execute testing Ramp-Up Period: 1 – It tells JMeter how long to delay before starting the next user. For example, if we have 5 users and a 5 second Ramp-Up period, then the delay between starting users would be 1 second (5 seconds /5 users).
Step 2 – Add HTTP Request Sampler
The JMeter element used here is the HTTP Request Sampler. In the HTTP Request Control Panel, the Path field indicates which URL request you want to send
Add HTTP Request Sampler To add: Right-click on Thread Group and select: Add -> Sampler -> HTTP Request
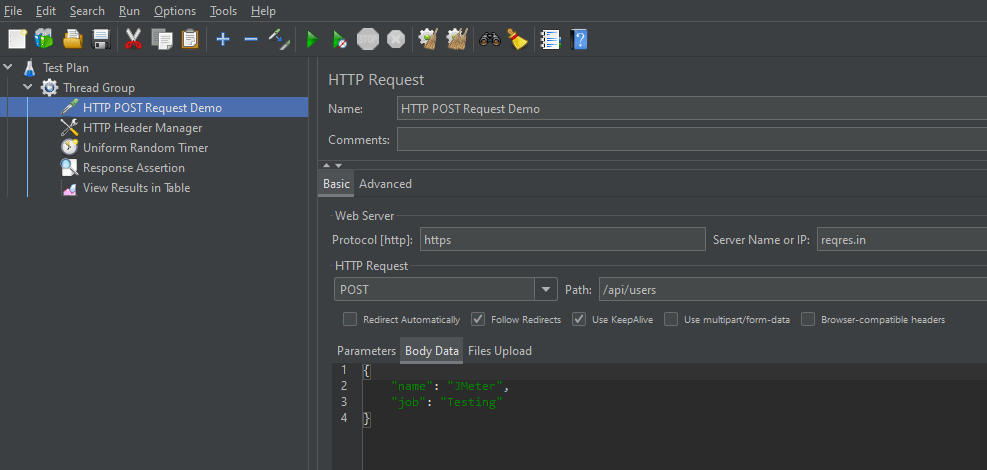
The below-mentioned are the values used in HTTP Request to perform the test
Name – Parameterized HTTP Request
Server Name or IP – reqres.in
Protocol – https
Method – POST
Path – /api/users
Step 3 – Add HTTP Head Manager
The Header Manager lets you add or override HTTP request headers like can add Accept-Encoding, Accept, Cache-Control
To add: Right-click on Thread Group and select: Add -> Config Element -> HTTP Read Manager
The below-mentioned are the values used in HTTP Request to perform the test Content-type = application/json
Below is the image once HTTP Header Manager is added to the Test Plan.
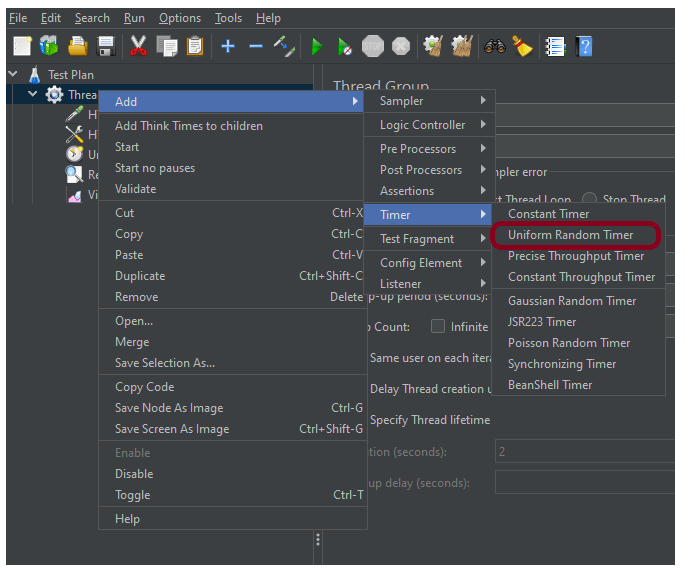
Step 4 – Add a Uniform Random Timer
I want to have each thread pause for the same amount of time (500ms) between requests. So, configure the Uniform Random Timer.
To add: Right-click on Thread Group and select: Add -> Timer ->Uniform Random Timer
Configuring Random Delay Maximum of 200 ms and Thread Delay of 500 milliseconds.
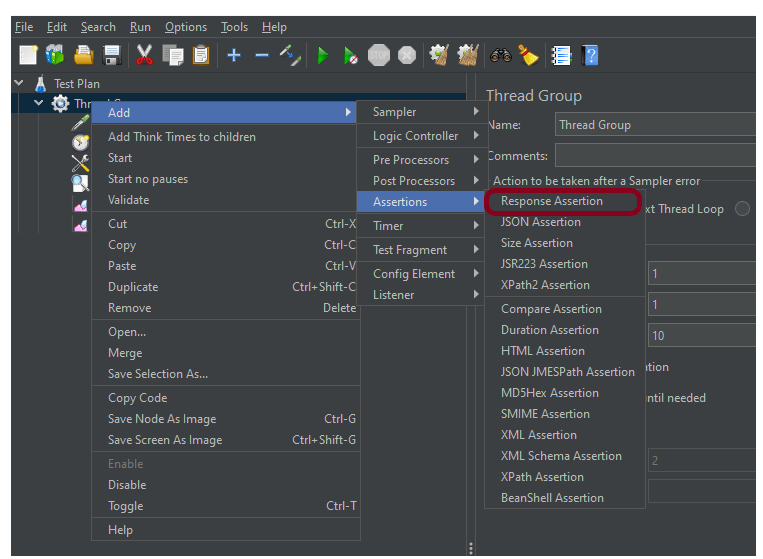
Step 5 – Adding Response Assertion to Test Plan
The response assertion control panel lets you add pattern strings to be compared against various fields of the request or response.
To add: Right-click on HTTP Request and select: Add -> Assertions-> Response Assertions
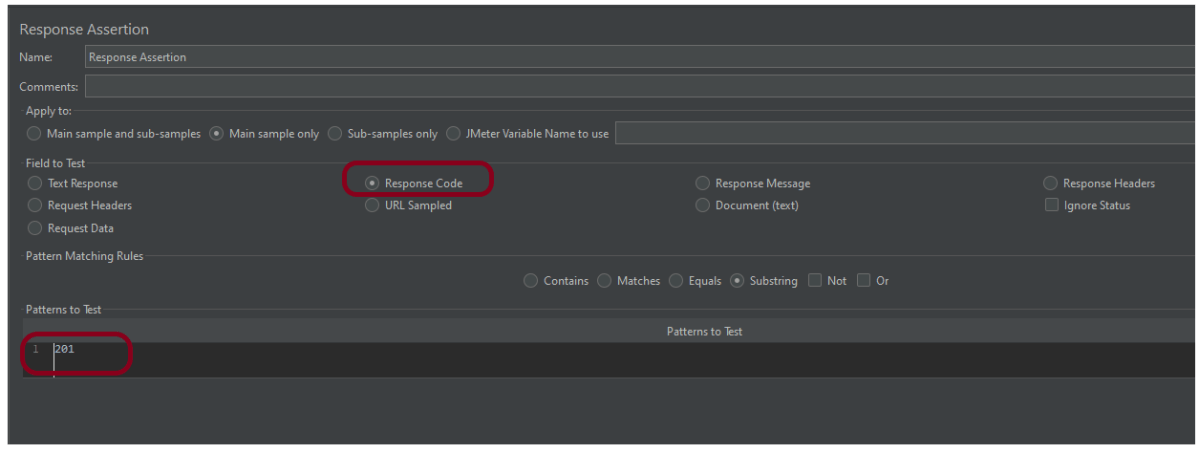
Here, I have selected the below options:-
Apply to: Main Sample only Field to Test: Response Code Pattern Matching Rules: Substring Pattern To Test: 201
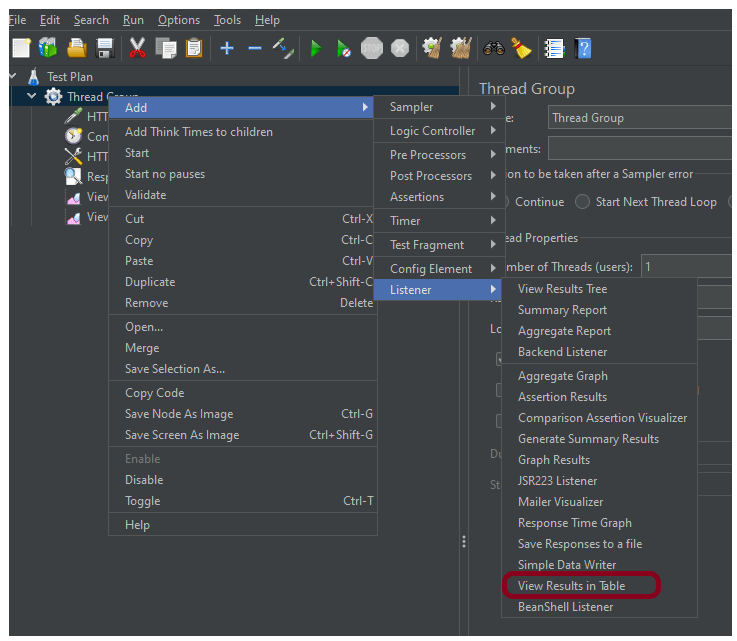
Step 6 – Adding Listeners to the Test Plan
Listeners – They show the results of the test execution. They can show results in a different format such as a tree, table, graph, or log file We are adding the View Result in Table
View Result in Table – The View Result in Table listener displays information about each sample in the form of a table. To add: Right-click on Test Plan, Add -> Listener -> View Result in Table
Note – Don’t use “View Results Tree” or “View Results in Table” listeners during the load test, use them only during the scripting phase to debug your scripts.
Step 7 – Save the Test Plan
To Save: Click File Select -> Save Test Plan as ->Give the name of the Test Plan. It will be saved in .jmx format.
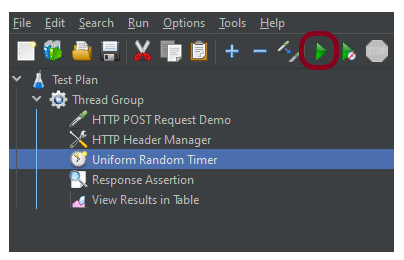
Step 8 – Run the Test Plan
Click on the Green Triangle as shown at the top to run the test.
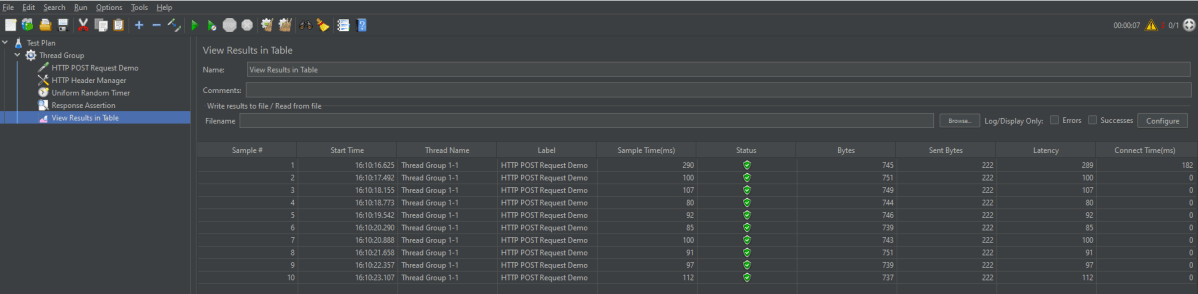
Step 9 – View the Execution Status
Click on View Result in Table to see the status of Run. A successful request will be of a Green colour in the Text Section.
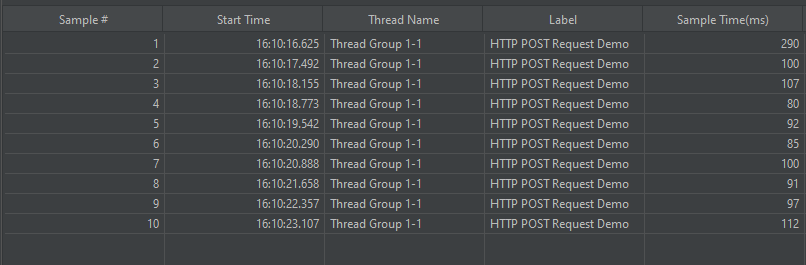
For example, in the above figure, let’s analyse Sample 2
Start time is 16:10:16.625
Sample Time of Sample 1 is 290 ms
Constant Timer: 500 ms (as configured)
End Time of this sample is = 16:10:16.625 + 290 + 500 = 16:10:17.415 and a random value of 77 ms is added to make it 16:10:17.492
We are done! Congratulations on making it through this tutorial and hope you found it useful! Happy Learning!!
Postman contains a full-featured testing sandbox that enables you to write and execute JavaScript-based tests for your API. You can then integrate Postman with your CI/CD build system using Newman, the command-line collection runner for Postman. In this tutorial, we are going to learn how we can integrate Postman with Jenkins.
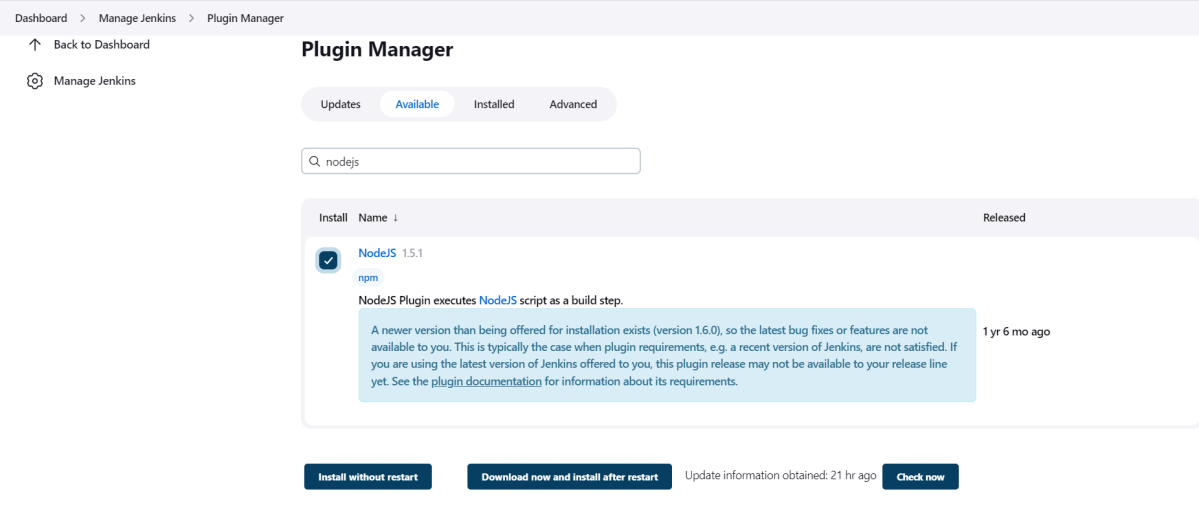
To generate a Performance Report in Jenkins, we need to download NodeJS Plugin. Please refer to this tutorial to install the plugin – How to install Plugins in Jenkins.
Go to Manage Jenkins > Manage Plugins and install the NodeJS plugin.
Step 2: Global Tool Configuration for NodeJS
Go to Manage Jenkins > Global Tool Configuration and under NodeJS, select Add NodeJS.
Enter a name for the Node.js installation.
Select the version of NodeJS installed on your machine from the Version dropbox.
In Global npm packages to install, enter newman.
Click on the Apply and Save buttons.
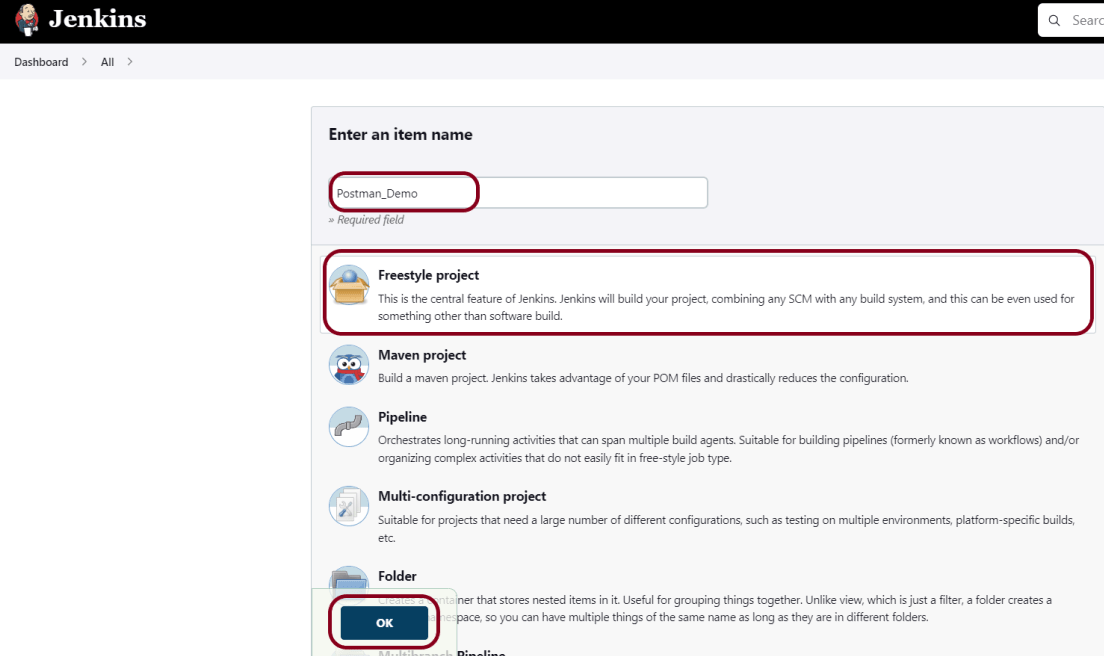
Step 3: Create a new FreeStyle project
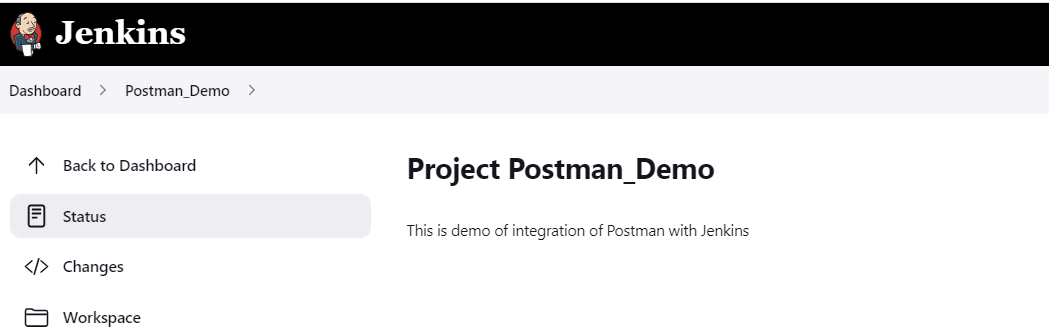
Give the Name of the project – Postman_Demo
Click on the FreeStyle project.
Click on the OK button.
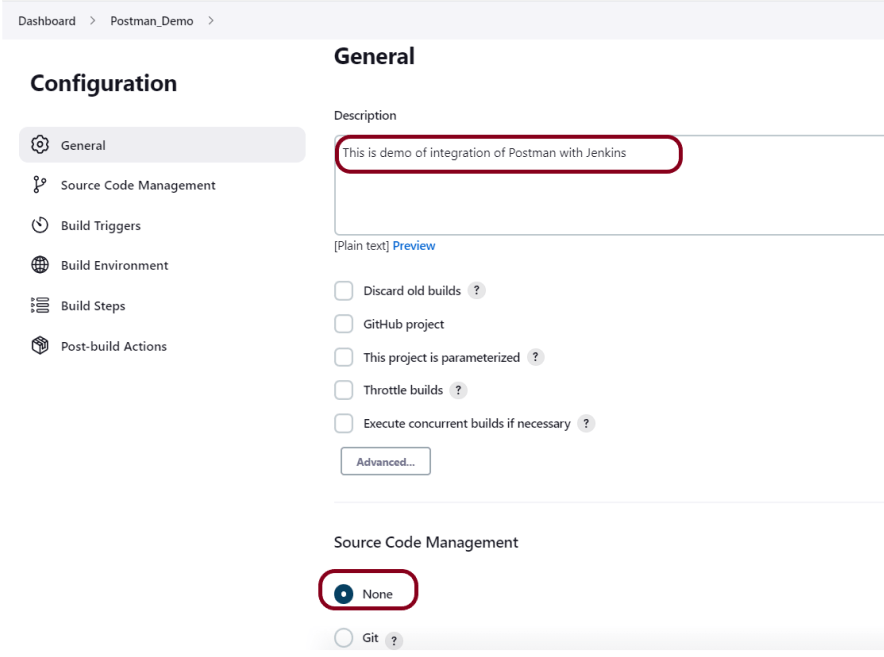
In the General section, enter the project description in the Description box.
Step 4: Source Code Management
Select Source Code Management as None if the project is locally present on the machine.
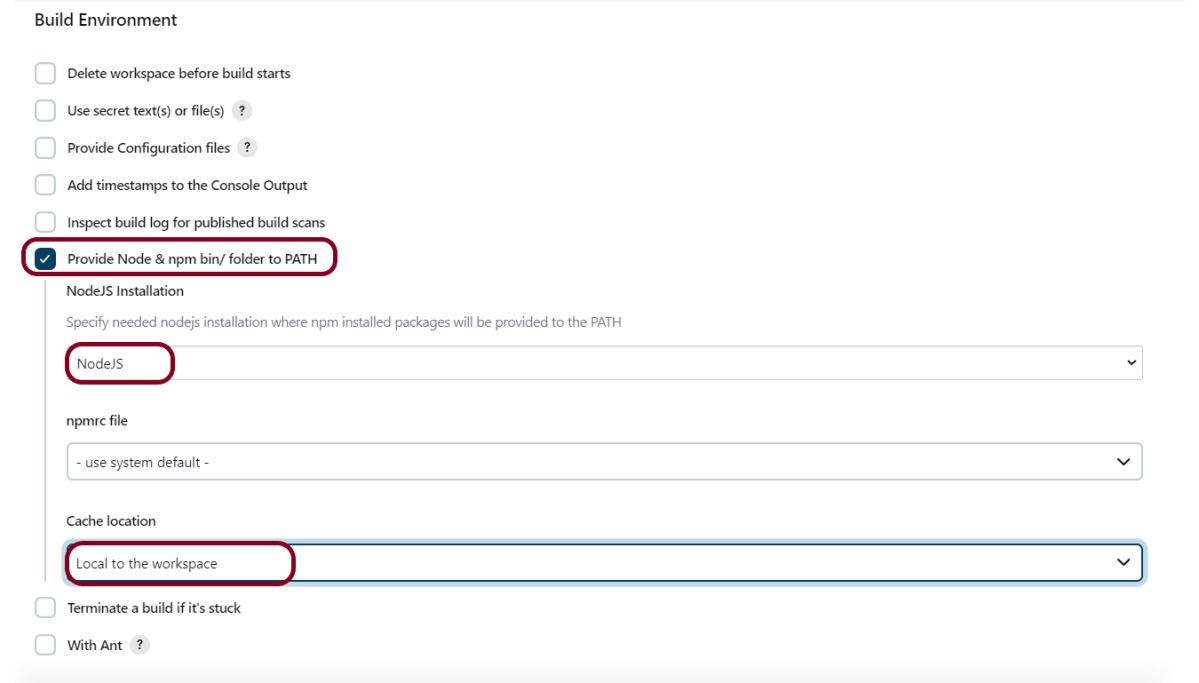
Step 5: Build Environment
Select the “Provide Node & npm bin/folder to PATH” option.
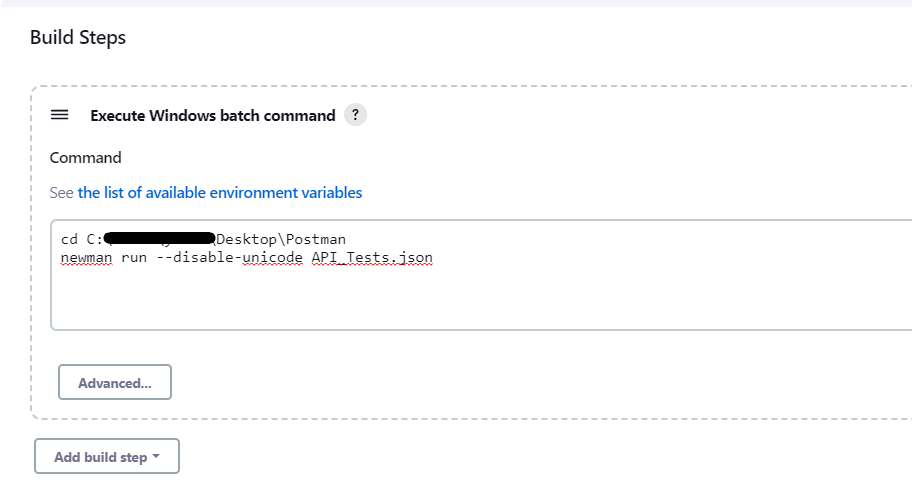
Step 6: Select Execute Windows batch command
In the Build Steps section, select Execute Windows batch command.
Use the below command to go to the path where the JMeter is placed in your system.
cd C:\Users\Vibha\Desktop\Postman
newman run --disable-unicode API_Tests.json
Click on the Apply and Save buttons.
We have created a new project “Postman_Demo” with the configuration to run the Postman scripts.
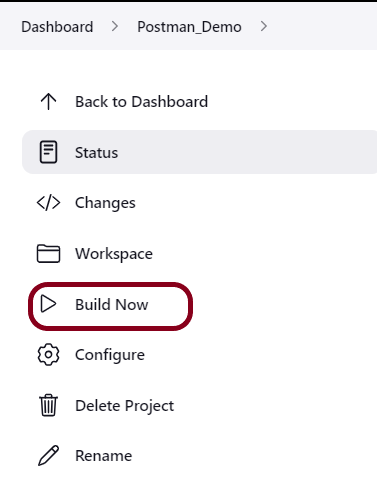
Step 7: Execute the tests
Let’s execute it now by clicking on the “Build Now” button.
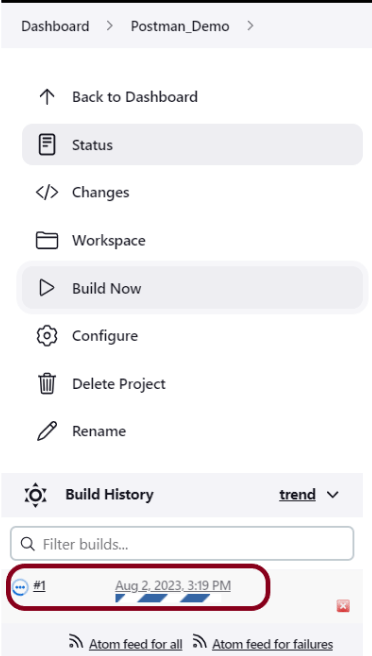
Right-click on Build Number (here in my case it is #1).
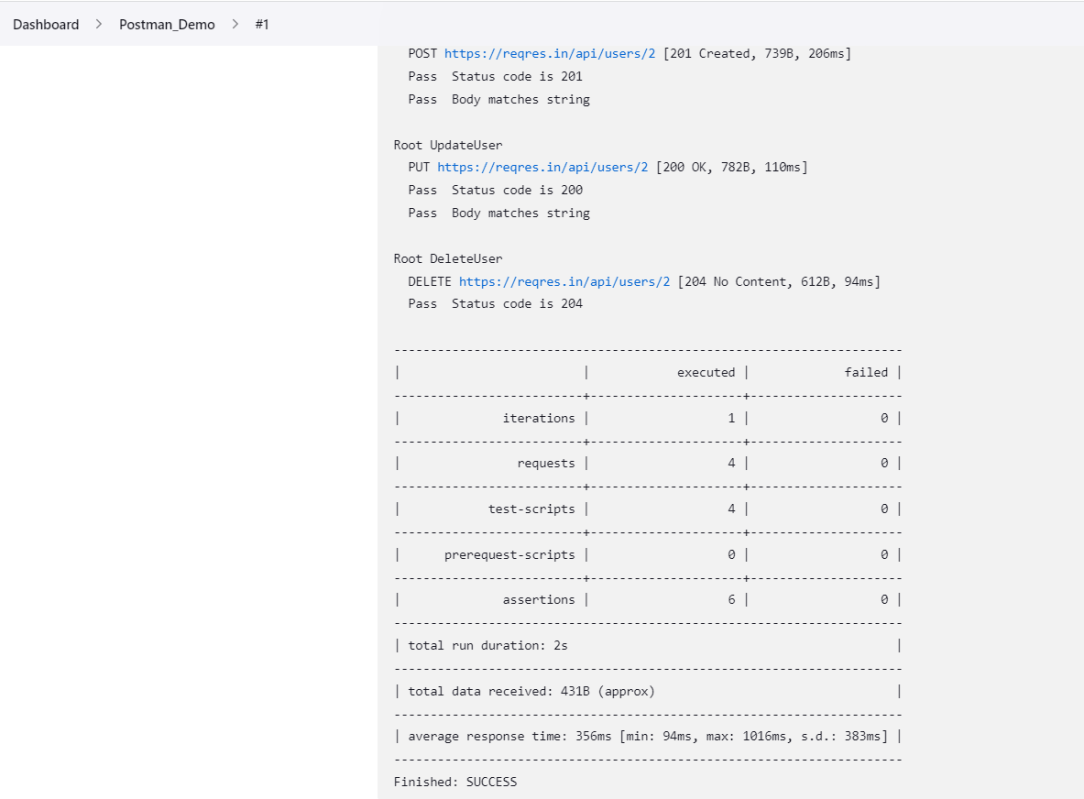
Click on Console Output to see the result.
Congratulations on making it through this tutorial and hope you found it useful! Happy Learning!! Cheers!!
A NewmanHTML reporter that has been extended to include the separation of the iteration runs so these are no longer aggregated together and also some additional handlebars helpers to enable users to create better custom templates
This reporter comes with a dashboard-style summary landing page and a set of different tabs that contain detailed request information. There are also a few optional configuration flags available, to tailor the final report in a number of different ways.
Prerequisite:
NodeJS is installed
Newman is installed
Implementation Steps
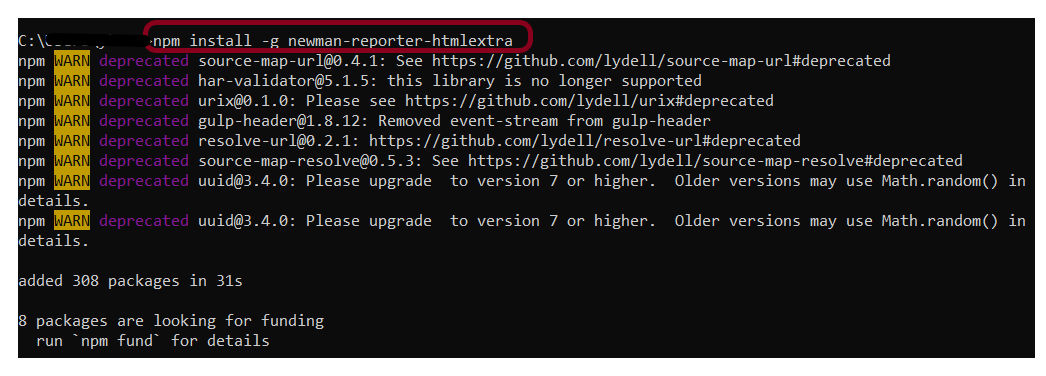
Step 1: Install newman-reporter-htmlextra package
Go to cmd prompt and type the below command:-
npm install -g newman-reporter-htmlextra
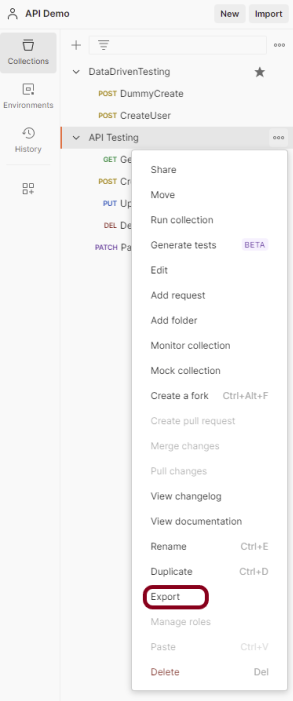
Step 2: Export the already created Postman tests
Export your Postman API collection as JSON file. To know how to export Collection in Postman, please refer to this tutorial – How to Export Postman Collections?.
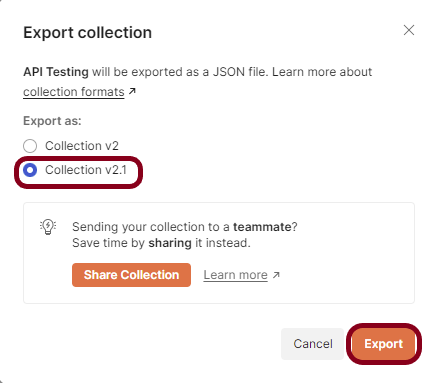
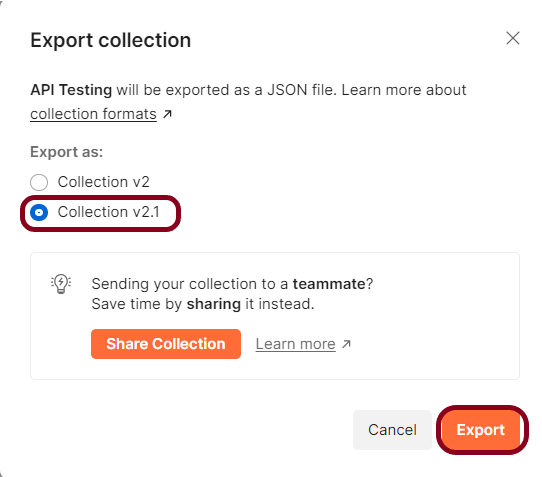
This screen provides the option to export the JSON file as Collection v2 or Collection v2.1 and click on the “Export” button.
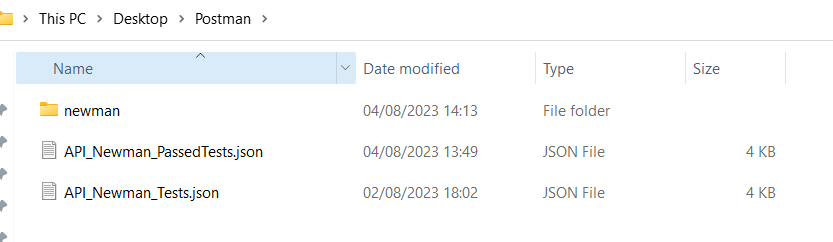
Open the Command Line and go to that location of the collection JSON file.
Step 3: Run the API collection through the command line
Use the below command to execute the tests and generate an HTML Report. The following command will create a new report in the ./newman directory, if the directory does not exist, it will be created as part of the Newman run.
newman run API_Newman_Tests.json -r htmlextra
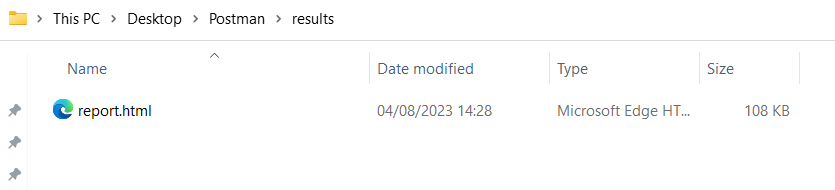
Go inside the newman folder and see a .html report is present.
Step 4: View Newman HTML Report
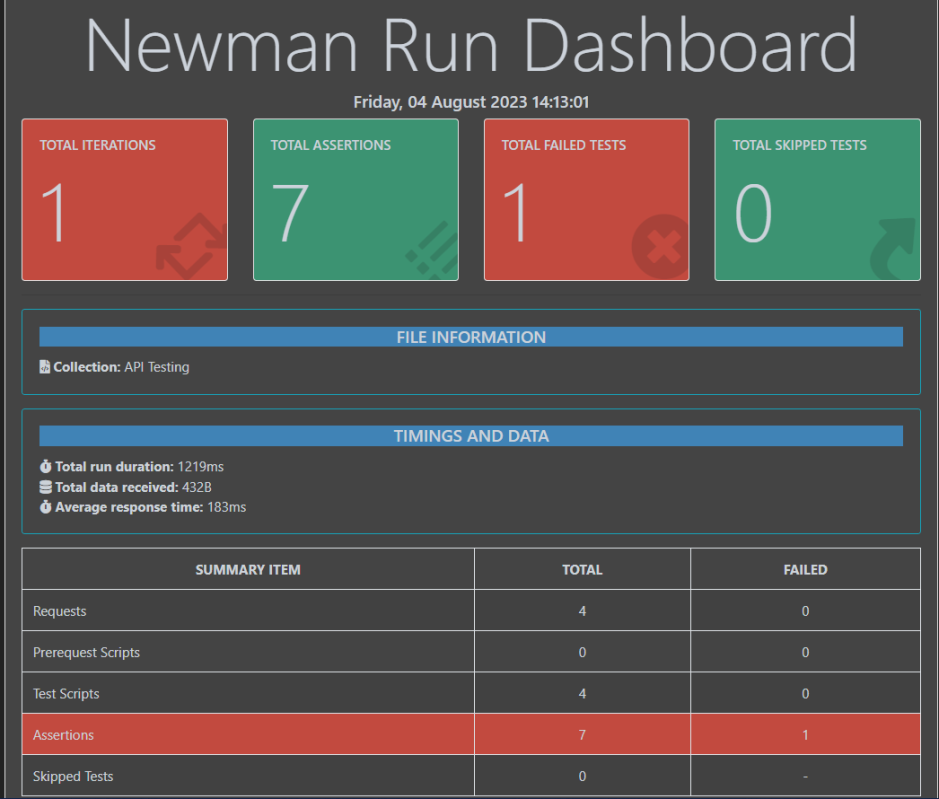
Double-click on the .html report and this will display. On the summary page, we get a summary of the test results we have run. We get detailed information like a number of iterations, assertions, skipped tests, and failed tests. From the Total Requests tab, we can get a lot of information like baseurl, the request body, the response header, and the response format. For more details, we can go to the Failed tests tab to check which scripts failed, the status code, and the assertion error message.
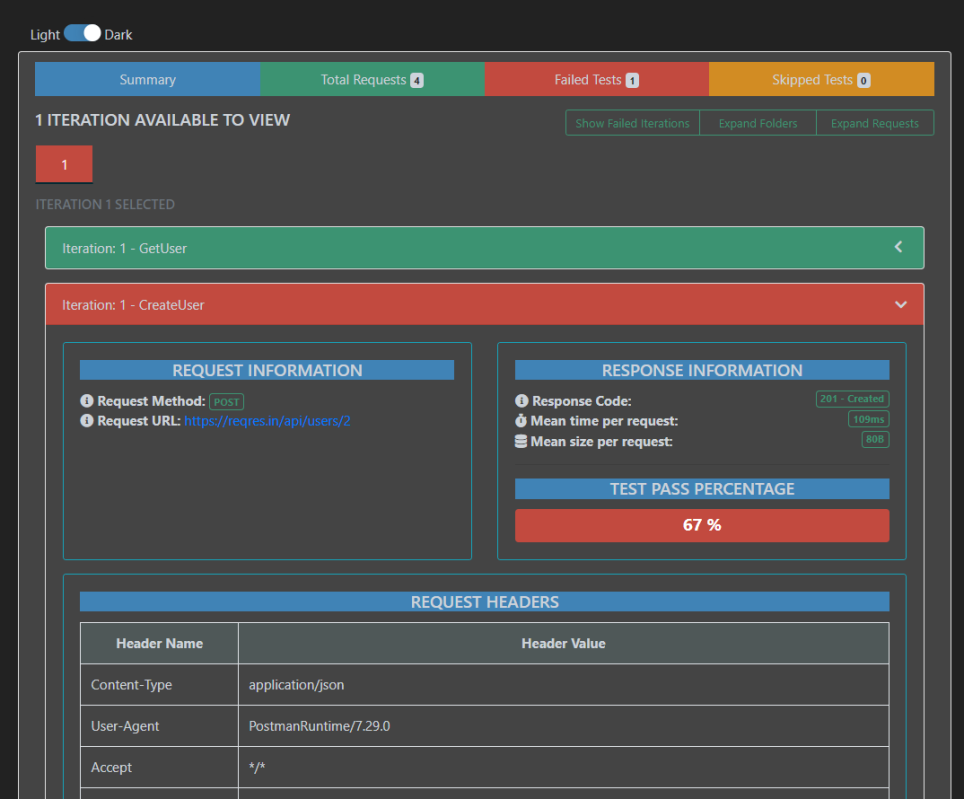
Go to the Total Requests tab to get all the information regarding the request method used, request URL, request body, response body, time taken to process the request, the means size of the request, and so on.
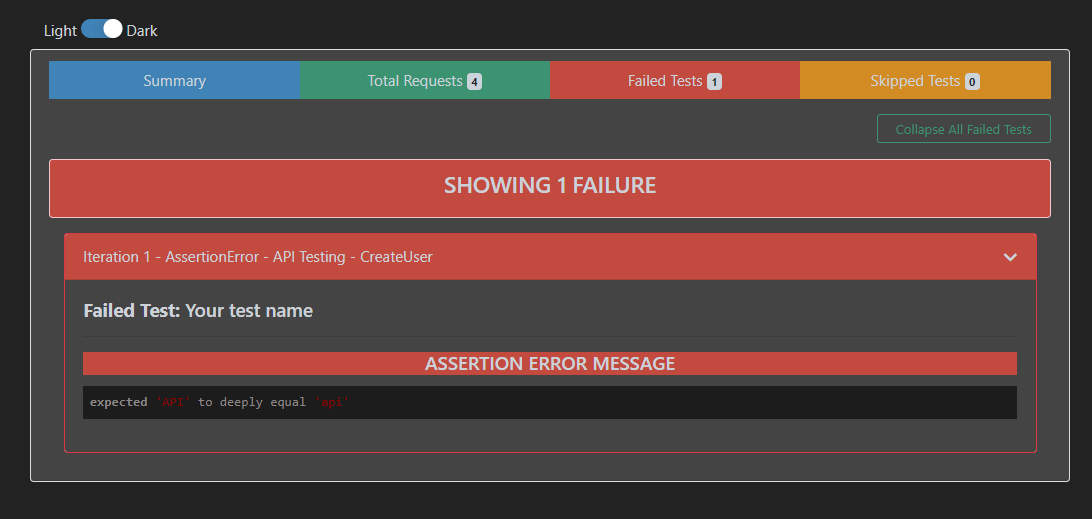
Go to the Failed Tests tab and see all the details about the failed tests.
Step 5: Additional CLI Options
Specify a path for the HTML Report.
Specify a path where the output HTML file will be written to disk.
Use the below command.
newman run API_Newman_Tests.json -r htmlextra --reporter-htmlextra-export ./results/report.html
If the path is not specified, the file will be written to the newmain/ in the current working directory.
That’s it! Congratulations on making it through this tutorial and hope you found it useful! Happy Learning!!
Postman is a powerful tool that allows developers to test APs efficiently. One of the key features of Postman is the ability to create and share collections, which are groups of API requests that can be organized together. In this tutorial, I will discuss how to import Postman collections.
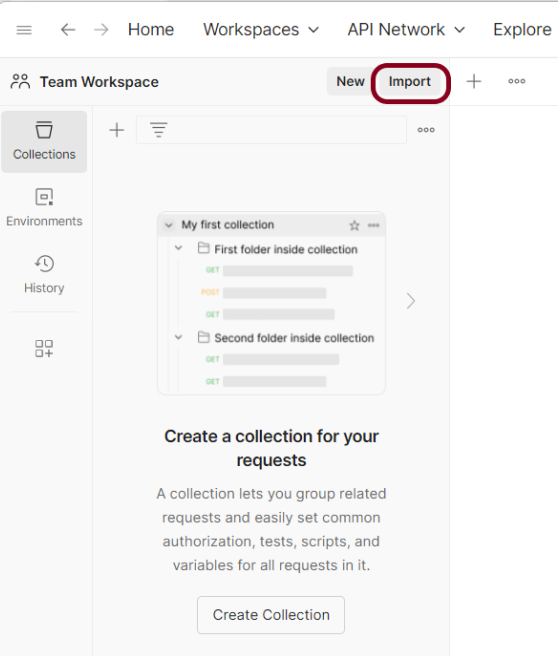
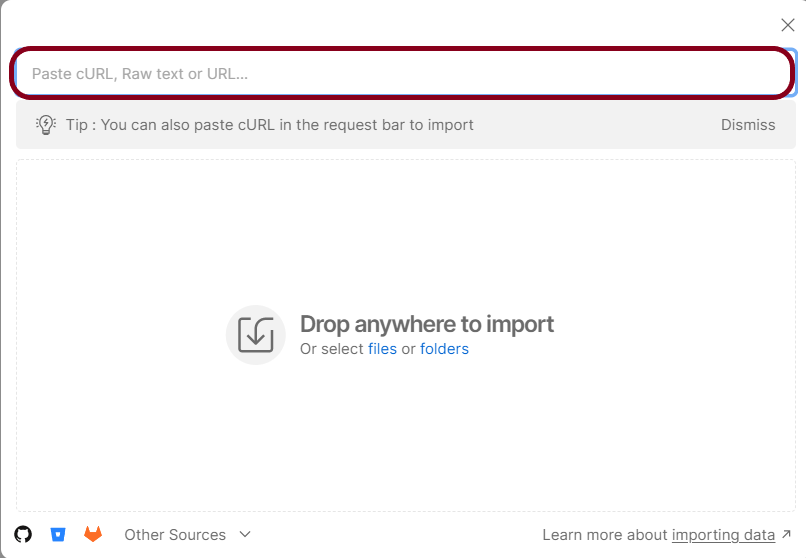
Step 1: Open Postman and navigate to the Collections tab on the left-hand side. Click on the “Import” button located in the top-left corner of the screen.
Step 2: In the “Import File” modal, click on the “Choose Files” button and select the Postman collection file you wish to import.
Step 3: Once the file has been selected, click on the “Import” button to initiate the import process.
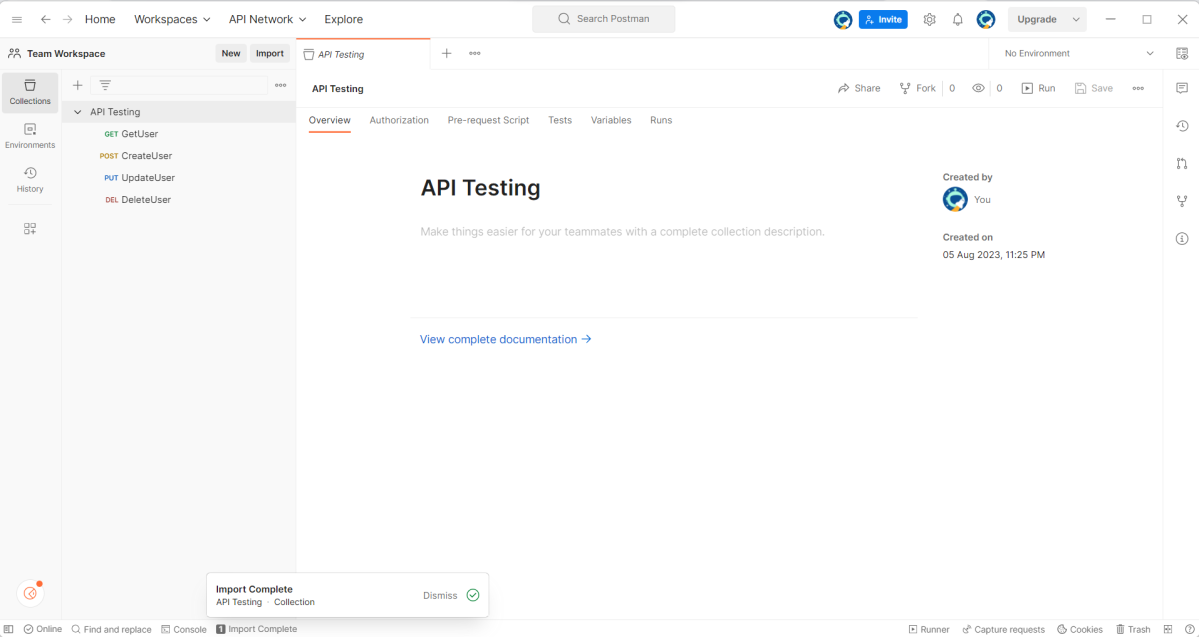
Step 4: After the import process is complete, you should see your newly imported collection listed in the Collections tab.
Step 5: Run the tests present in the Collection to see if the import is successful.
Congratulations on making it through this tutorial and hope you found it useful! Happy Learning!!
Newman enables you to run and test a Postman Collection directly from the command line. It’s built with extensibility in mind so that you can integrate it with your continuous integration (CI) servers and build systems.
Let’s learn about Newman and how to run the Postman collection using a command line.
Implementation Steps
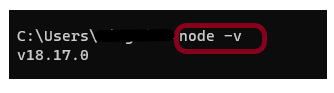
Step 1: Check if node.js is already installed or not
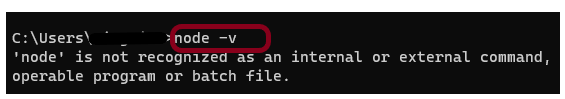
Open your cmd from your machine
node -v
If found: ‘node’ is not recognized as an internal or external command, operable program, or batch file
That means node.js is not installed on your system yet.
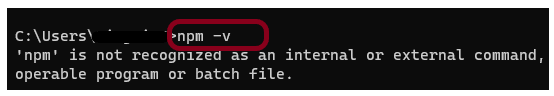
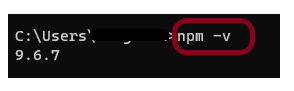
Step 2: Check if npm is already installed or not
npm is node package manager which is used to installed packages over node.
npm -v
‘npm’ is not recognized as an internal or external command, operable program or batch file message means that node is not found in the system.
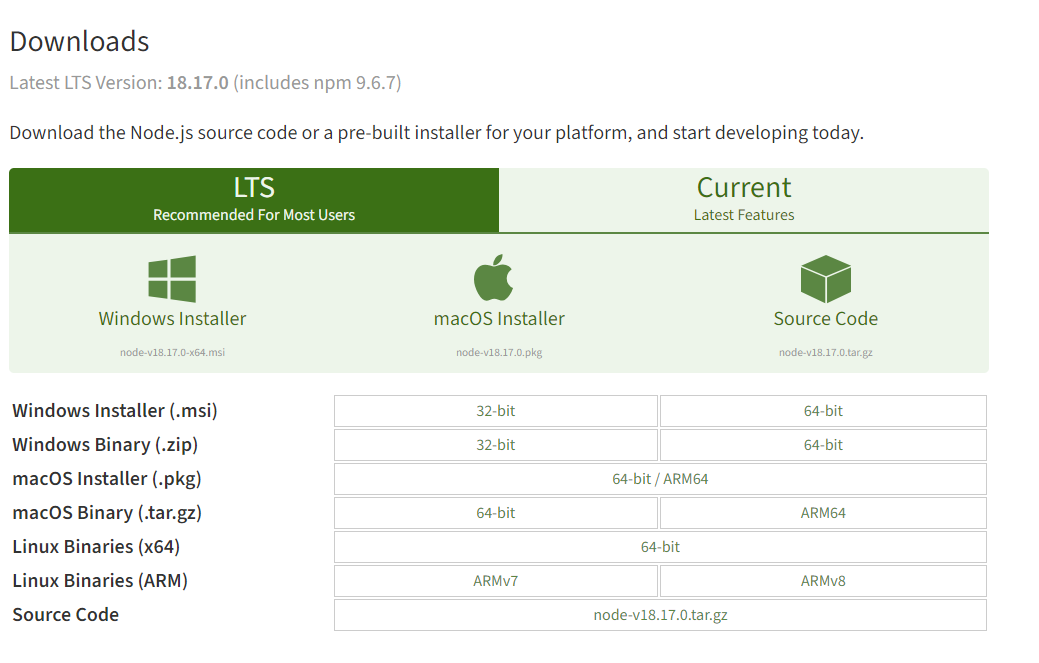
Step 3: Install node.js
Newman is node.js program and to get newman we have to first install node.js
Depending upon the system requirement, select and download 32-bit or 64-bit for Window or macOS operating system Node.js installer.
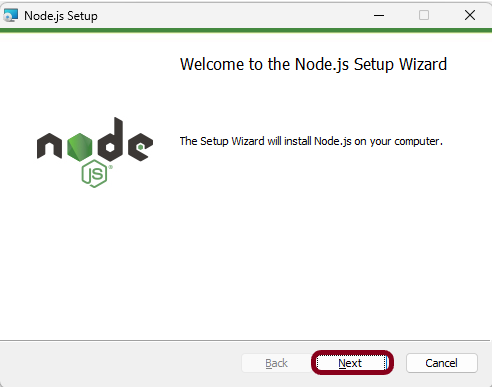
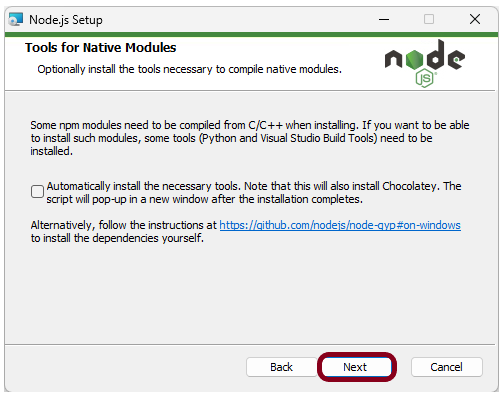
Once the installer finishes downloading, launch it. Open the downloads link in your browser and click the file. Or, browse to the location where you have saved the file and double-click it to launch. Click the “Next” button.
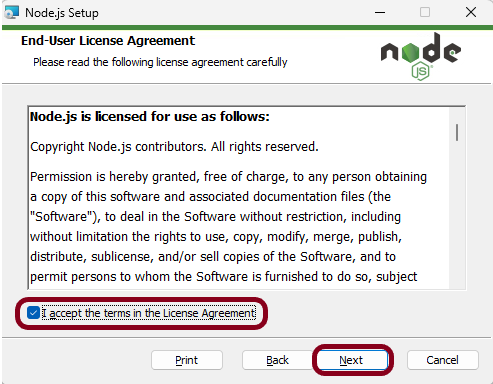
Select the option “I accept the terms in the License Agreement” and click the “Next” button.
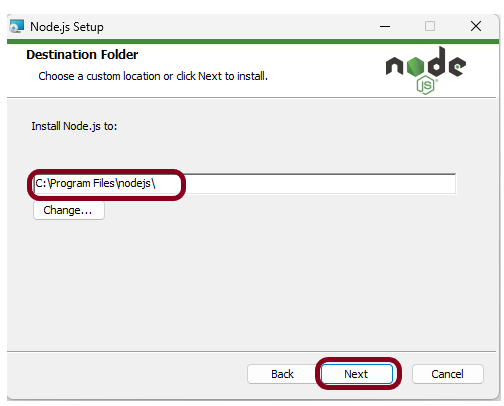
The installer will prompt you for the installation location. Leave the default location, unless you have a specific need to install it somewhere else. Click the “Next”button.
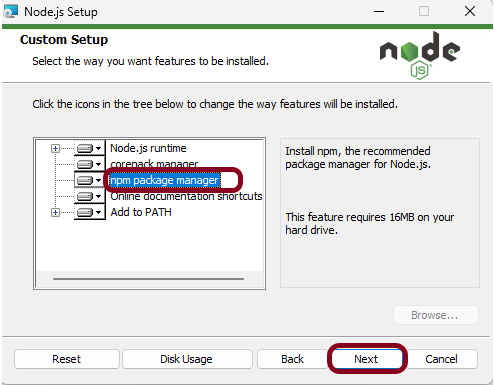
This screen shows that npm package manager is also getting installed. Click the “Next” button.
Select the “Next” button.
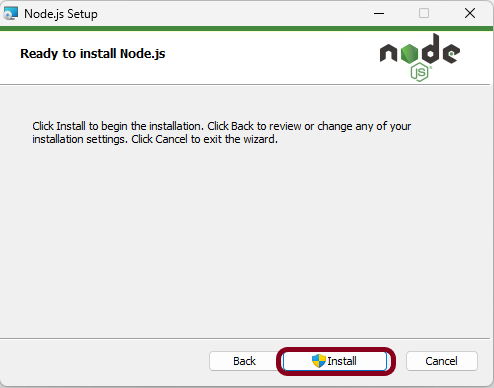
Click on the “Install” button.
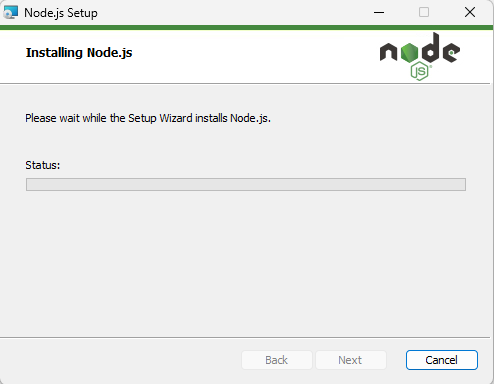
This screen shows that installation is in progress.
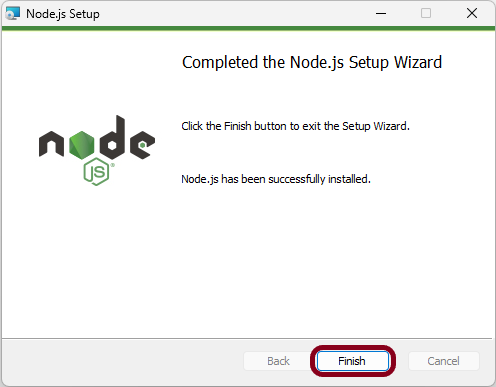
Click the “Finish” button to end the installation process.
Step 4: Check if node.js and npm are successfully installed
Close the cmd prompt and reopen the cmd prompt. Type node-v command and see if the version is displayed or not. The below image shows that node.js of version 18.17 is installed on the machine.
Type npm-v command and see if the version is displayed or not. The below image shows that npm of version 9.6.7 is installed on the machine.
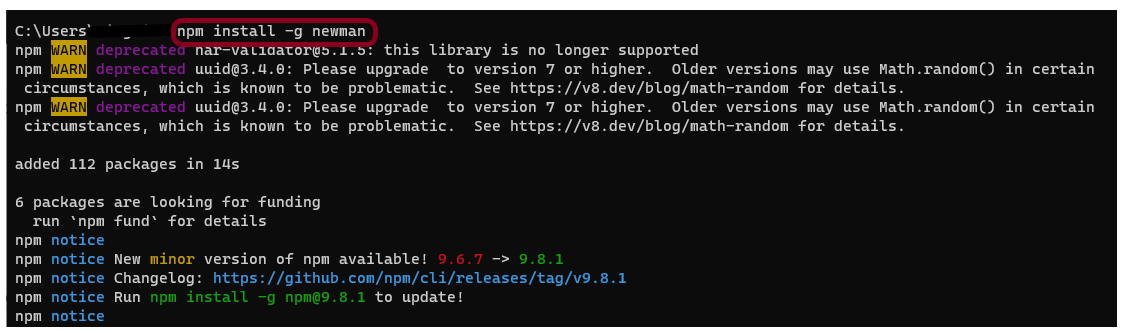
Step 5: Install Newman
npm install -g newman
It will get Newman then install in your system. It will take couple of second.
After finishing the installation you can see it has added all the packages from contributors.
Step 6: Export the already created Postman tests
Export your Postman API collection as json file
This screen provides the option to export the json file as Collection v2 or Collection v2.1 and click on the “Export” button.
On cmd go to that location of collection json file
cd C:\Users\Vibha\Desktop\Automation\Postman
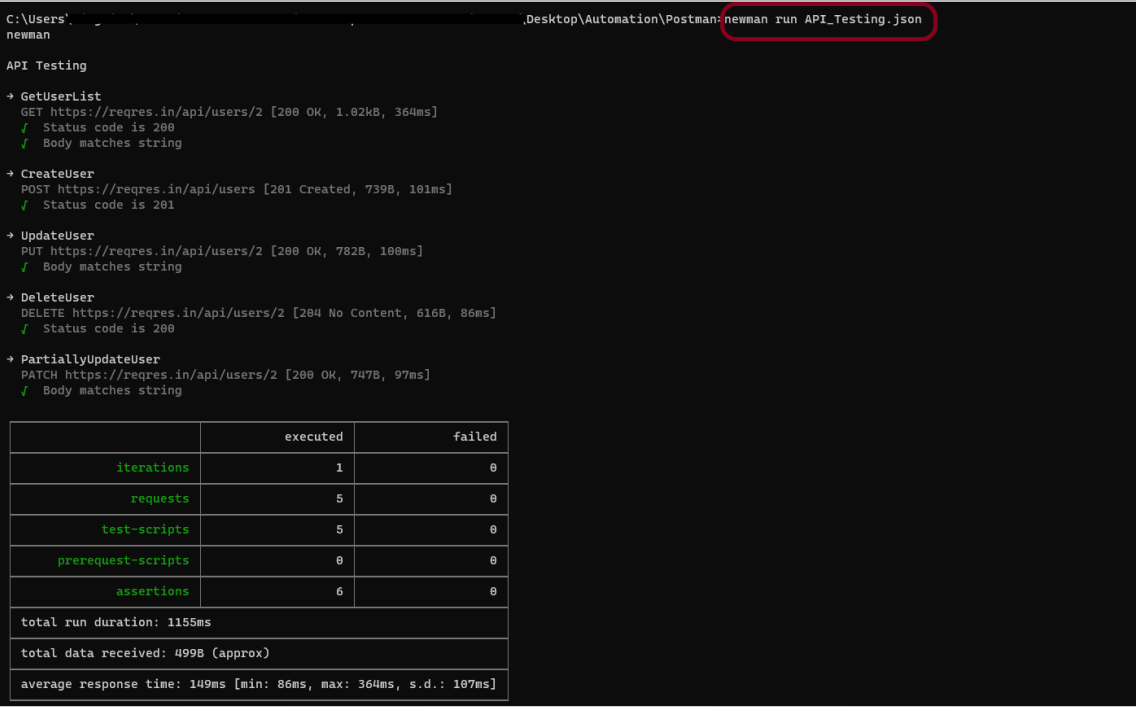
Step 7: Run the API collection through command line
newman run API_Testing.json
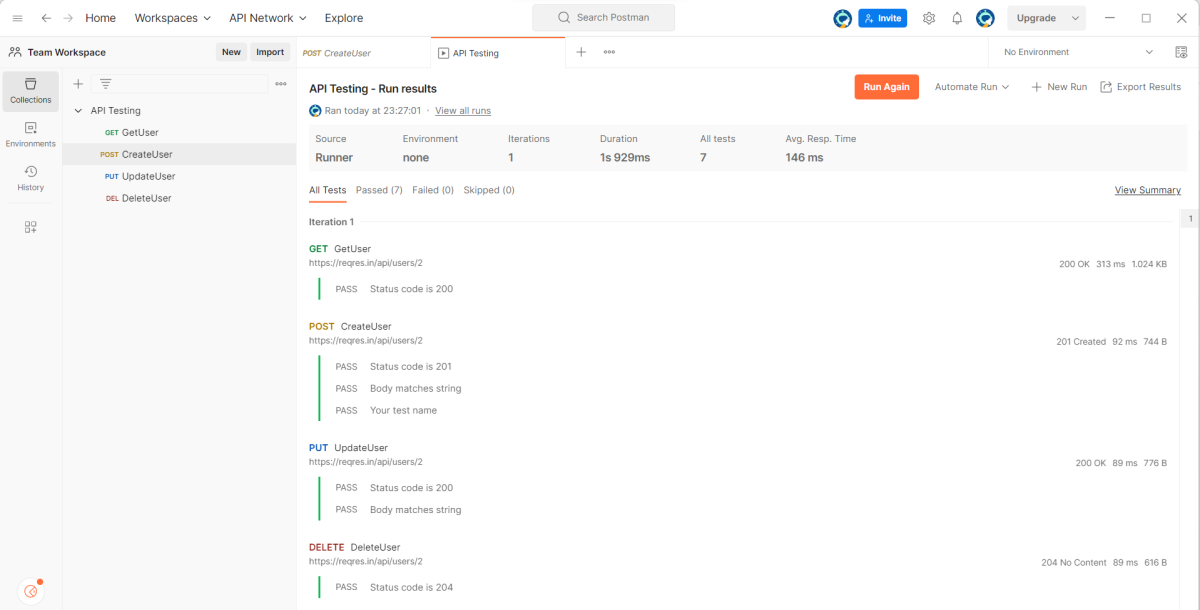
The output of the above command is shown below. There is a log of entire over all summary showing iterations, requests, test-scripts, prerequest-scripts, assertions, total run duration, total data received, average response time and in case of any failure we get the details of failure and all.
Congratulations!! We have run the Postman tests through command line. I hope this tutorial is useful to you.
In this tutorial, we will go through the steps to export a Collection in Postman.
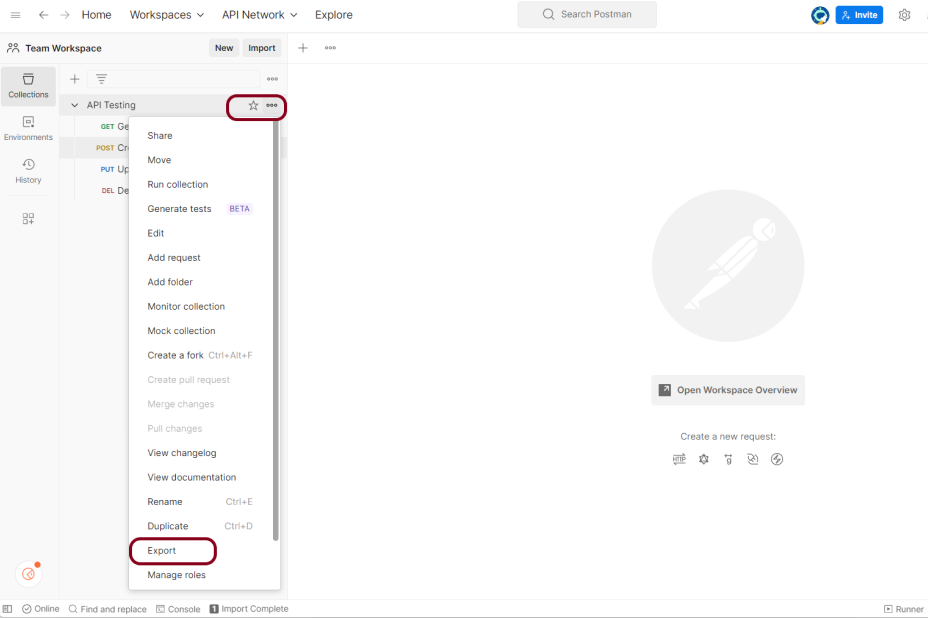
Step 1: Open Postman and navigate to the collection you want to export. Click on the ellipsis (…) icon next to the collection name.
Step 2: Select “Export” from the drop-down menu. Choose the format in which you want to export the collection. Postman supports a variety of formats including JSON, CSV, and YAML.
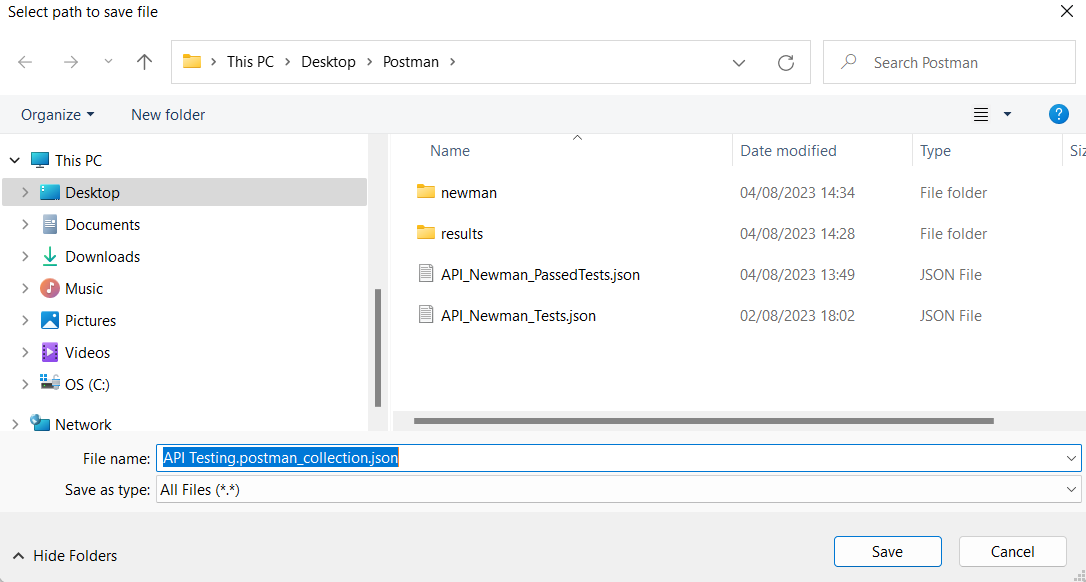
Step 3: Choose the location on your computer where you want to save the exported file.
Step 4: Click “Save” to export the collection.
Please keep in mind that if you wish to export a huge collection in Postman, the export procedure may take a few minutes. You may quickly share your Postman collections with others or backup your collections for future use using the exported file.
We are done! Congratulations on making it through this tutorial and hope you found it useful! Happy Learning!!
This tutorial explains the process to run the Selenium Tests on multiple browsers in the GitLab pipeline. This is a very important step towards achieving CI/CD. Ideally, the tests need to run after any change (minor/major) before merging the latest change to the master branch. This makes life of a QA very easy.
Once the proposed changes are built, then push the commits to a feature branch in a remote repository that’s hosted in GitLab. The push triggers the CI/CD pipeline for your project. Then, GitLab CI/CD runs automated scripts (sequentially or in parallel) to build as well as to test the application. After a successful run of the test scripts, GitLab CI/CD deploys your changes automatically to any environment (DEV/QA/UAT/PROD). But if the test stage is failed in the pipeline, then the deployment is stopped.
After the implementation works as expected:
Get the code reviewed and approved.
Merge the feature branch into the default branch.
GitLab CI/CD deploys your changes automatically to a production environment.
To use GitLab CI/CD, we need to keep 2 things in mind:
a) Make sure a runner is available in GitLab to run the jobs. If there is no runner, install GitLab Runner and register a runner for your instance, project, or group.
b) Create a .gitlab-ci.yml file at the root of the repository. This file is where CI/CD jobs are defined.
The Selenium tests run on a headless browser in the pipeline.
How to check if GitLab Runner is configured?
Go to the project created in the GitLab. Go to the left side and click on Settings. Go to CI/CD option and a CI/CD Settings page open. Scroll down and see the Runners. By default, Shared runner will be selected for any new project.
What is a headless browser?
A headless browser is like any other browser, but without a Head/GUI (Graphical User Interface). A headless browser is used to automate the browser without launching the browser. While the tests are running, we could not see the browser, but we can see the test results coming on the console.
As explained in one of the previous tutorial, it is needed to add the maven-surefire-plugin to run the TestNG tests through the command line.
Step 3 – Create the Test Code
This is the BaseTest Class where the WebDriver is initialized, headless mode, full screen, and at the end close the WebDriver.
package com.example.tests;

import org.openqa.selenium.WebDriver;
import org.openqa.selenium.chrome.ChromeOptions;
import org.openqa.selenium.edge.EdgeOptions;
import org.openqa.selenium.firefox.FirefoxOptions;
import org.openqa.selenium.remote.RemoteWebDriver;
import org.testng.annotations.AfterMethod;
import org.testng.annotations.BeforeMethod;
import org.testng.annotations.Parameters;

import java.net.URL;
import java.time.Duration;

public class BaseTests {
    protected static ThreadLocal<RemoteWebDriver> driver = new ThreadLocal<RemoteWebDriver>();
    public static String remote_url = "http://selenium-hub:4444";
    public final static int TIMEOUT = 5;

    @BeforeMethod
    @Parameters("browser")
    public void setUp(String browser) throws Exception {
        if(browser.equalsIgnoreCase("chrome")) {

            ChromeOptions options = new ChromeOptions();
            options.addArguments("--start-maximized");
            options.addArguments("--headless=new");
            options.addArguments("--remote-allow-origins=*");
            driver.set(new RemoteWebDriver(new URL(remote_url), options));
            System.out.println("Browser Started :"+ browser);


        } else if (browser.equalsIgnoreCase("firefox")) {
            FirefoxOptions options = new FirefoxOptions();
            options.addArguments("--start-maximized");
            options.addArguments("-headless");
            driver.set(new RemoteWebDriver(new URL(remote_url), options));
            System.out.println("Browser Started :"+ browser);


        } else if (browser.equalsIgnoreCase("edge")) {
            EdgeOptions options = new EdgeOptions();
            options.addArguments("--start-maximized");
            options.addArguments("--headless=new");
            driver.set(new RemoteWebDriver(new URL(remote_url), options));
            System.out.println("Browser Started :"+ browser);


        } else {
            throw new Exception ("Browser is not correct");
        }

        driver.get().get("https://opensource-demo.orangehrmlive.com/");
        driver.get().manage().timeouts().implicitlyWait(Duration.ofSeconds(TIMEOUT));
    }


    public WebDriver getDriver() {
        return driver.get();
    }

    @AfterMethod
    public  void closeBrowser() {
        driver.get().quit();
        driver.remove();
    }

}
There is a Login pages that need to be tested.
LoginPage contains the tests to log in to the application. After successful login, the application moves to the next webpage – HomePage. You can see that BaseTest class is extended here.
package com.example.tests;

import org.openqa.selenium.By;
import org.testng.annotations.Test;

import static org.testng.Assert.assertEquals;

public class LoginPageTests extends BaseTests {

    By userName = By.name("username");
    By passWord = By.name("password");

    By loginBtn = By.xpath("//*[@id='app']/div[1]/div/div[1]/div/div[2]/div[2]/form/div[3]/button");

    By errorMessage = By.xpath("//*[@id='app']/div[1]/div/div[1]/div/div[2]/div[2]/div/div[1]/div[1]/p");

    By blankUsername = By.xpath("//*[@id='app']/div[1]/div/div[1]/div/div[2]/div[2]/form/div[1]/div/span");

    By dashboardPage = By.xpath("//*[@id='app']/div[1]/div[1]/header/div[1]/div[1]/span/h6");

    @Test
    public void invalidCredentials()  {

        getDriver().findElement(userName).sendKeys("1234");
        getDriver().findElement(passWord).sendKeys("12342");
        getDriver().findElement(loginBtn).click();
        String actualErrorMessage = getDriver().findElement(errorMessage).getText();
        System.out.println("Actual ErrorMessage :" + actualErrorMessage);
        assertEquals(actualErrorMessage,"Invalid credentials");

    }

    @Test
    public void blankUsername()  {

        getDriver().findElement(userName).sendKeys("");
        getDriver().findElement(passWord).sendKeys("12342");
        getDriver().findElement(loginBtn).click();
        String actualErrorMessage = getDriver().findElement(blankUsername).getText();
        System.out.println("Actual ErrorMessage :" + actualErrorMessage);
        assertEquals(actualErrorMessage,"Required");

    }

    @Test
    public void successfulLogin()  {

        getDriver().findElement(userName).sendKeys("Admin");
        getDriver().findElement(passWord).sendKeys("admin123");
        getDriver().findElement(loginBtn).click();
        String actualMessage = getDriver().findElement(dashboardPage).getText();
        System.out.println("Message :" + actualMessage);
        assertEquals(actualMessage,"Dashboard");

    }
}
Step 4 – Create testng.xml to run the tests
Now, let’s create a testng.xml to run the TestNG tests. It is very easy to create testng.xml in the case of Eclipse. Right-click on the project, and select TestNG -> Convert to TestNG. It will create a basic testng.xml structure. In case of IntelliJ, create a new file with the name of testng.xml and copy the code from here.
<?xml version="1.0" encoding="UTF-8"?>
<!DOCTYPE suite SYSTEM "https://testng.org/testng-1.0.dtd">
<suite name="Suite" parallel="tests" thread-count="3">
    <test name="Chrome Test">
        <parameter name="browser" value="chrome"></parameter>
        <classes>
            <class name="com.example.tests.LoginPageTests"/>
        </classes>
    </test> <!-- Test -->
    <test name="Firefox Test">
        <parameter name="browser" value="firefox"></parameter>
        <classes>
            <class name="com.example.tests.LoginPageTests"/>
        </classes>
    </test> <!-- Test -->
    <test name="Edge Test">
        <parameter name="browser" value="edge"></parameter>
        <classes>
            <class name="com.example.tests.LoginPageTests"/>
        </classes>
    </test> <!-- Test -->
</suite> <!-- Suite -->
version: 3. It is the latest version of the docker-compose files.
services(containers): This contains the list of the images and their configurations.
image: It defines which image will be used to spin up container.
ports: Published ports with host:container format.
container_name: You can give name to your containers.
depends_on: This defines the required dependency before spinning up the container. In our docker-compose.yml file, containers Chrome and Firefox are dependent upon container hub to spin up.
SE_NODE_MAX_INSTANCES: This defines how many instances of same version of browser can run over the Remote System.
SE_NODE_MAX_SESSIONS: This defines maximum number of concurrent sessions that will be allowed.
Step 6 – Create a .gitlab-ci.yml
stages:
  - test

variables:
  SELENIUM_SERVER_NAME: selenium-hub
  SELENIUM_SERVER_URL: http://${SELENIUM_SERVER_NAME}:4444
  DOCKER_HOST: tcp://docker:2375

services:
  - docker:20.10.16-dind

test:
  stage: test
  image: docker/compose
  before_script:
    - docker-compose up -d selenium-hub chrome edge firefox
    - sleep 10
    - docker-compose run ping curl ${SELENIUM_SERVER_URL}/status
  script:
    - docker-compose run tests mvn clean test

  artifacts:
    when: always
    name: "report"
    paths:
      - target/surefire-reports/**
    expire_in: 7 days
GitLab Section
Step 7 – Create a blank project in GitLab
To know, how to create a blank new project in GitLab, please refer tothis tutorial.
Step 8 – Push the project from local repository to Gitlab Repository
To know, how to push the changes in GitLab, please refer to this tutorial.
Step 9 – Run the tests in the GitLab pipeline
Now, when a new change is committed, a pipeline kicks off and it runs all the tests.
Step 10 – Check the status of the pipeline
Once the Status of the pipeline changes to either failed or passed.. that means the tests are already executed.
As you can see the Status is failed here which means that the execution is completed. Let us see the logs of the execution it shows that out of 9 tests, all 9 are passed. This shows that tests ran successfully in the GitLab pipeline.
As I have added an artifact also in the gitalb-ci.yml, which is highlighted in the image. This artifact creates a folder with the name “report” and the reports in this folder come from the path /target/surefire-reports. This artifact gives us the option to download the reports or browse the report. This report will be available for 7 days only as mentioned in the gitlab-ci.yml.
Step 11 – Download the report
Once, will click on the download button, it will download “report.zip”. Unzip the folder and it looks like something as shown below:
Example of Emailable-Report.html
Example of Index.html
Congratulations. This tutorial has explained the steps to run Selenium tests in GitLab CI/CD. Happy Learning!!
Cross-browser testing is a software testing practice that involves evaluating the compatibility and functionality of a website or web application across different web browsers. The goal of cross-browser testing is to ensure that the website or application works consistently and as expected on various browsers, operating systems, and devices.
Since different web browsers (such as Google Chrome, Mozilla Firefox, Microsoft Edge, Safari, etc.) may interpret and render HTML, CSS, and JavaScript code differently, cross-browser testing helps identify and address any discrepancies or issues that might arise. These differences can affect the visual appearance, layout, performance, and functionality of a website or application.
What is Selenium Grid?
Selenium Grid enables the execution of WebDriver scripts on remote machines (virtual or physical) by routing client commands to remote browser instances. Selenium Grid is a component of the Selenium testing framework that allows you to distribute and run tests across multiple browsers, operating systems, and machines simultaneously. It is particularly useful for performing parallel testing and cross-browser testing, helping to speed up the testing process and ensure consistent behavior across different environments.
What is new in Selenium Grid 4?
Grid 4 makes use of a variety of new technologies to enable scaling while allowing for local execution.
Selenium Grid 4 is a new implementation that does not share the previous version’s codebase.
I like how noVNC is packaged with Selenium Grid. In the dashboard, there is a Sessions tab that, when clicked, displays the links to the browser sessions that are now active, along with a video icon. When you click the video icon, you will be prompted to enter the password (“secret”), following which you will be taken to the current browser session where you can view the test live.
If we wanted to observe what was going on inside the browser session, we had to explicitly configure the grid for noVNC viewer in the prior version. From the grid, we just saw the browser icons highlighted, letting us know that the tests were being run in this or that browser.
What is Docker?
Docker is an open platform for developing, shipping, and running applications inside the containers. Containers are lightweight, portable, and self-sufficient units that package an application and its dependencies (such as libraries, frameworks, and runtime environments) together. Docker provides a consistent environment for running applications across different systems, making it easier to ensure that an application behaves the same way in development, testing, and production environments.
CLI Options for Docker
What is Docker Compose?
Docker Compose is a tool provided by Docker that allows you to define and manage multi-container Docker applications. It uses a simple and declarative YAML file to define the services, networks, and volumes that make up your application stack.
Project Structure
How to perform cross browser testing with Selenium Grid and Docker
Docker Desktop does not start automatically after installation. To start Docker Desktop, search for Docker, and select Docker Desktop in the search results. When the whale icon in the status bar stays steady, Docker Desktop is up-and-running, and is accessible from any terminal window.
Creating an instance of the Remote WebDriver and passing the selenium endpoint and chrome options defined in it.
To run a Remote WebDriver client, we first need to connect to the RemoteWebDriver. We do this by pointing the URL to the address of the server running our tests. In order to customize our configuration, we set desired capabilities.
BaseTests
import org.openqa.selenium.WebDriver;
import org.openqa.selenium.chrome.ChromeOptions;
import org.openqa.selenium.edge.EdgeOptions;
import org.openqa.selenium.firefox.FirefoxOptions;
import org.openqa.selenium.remote.RemoteWebDriver;
import org.testng.annotations.AfterMethod;
import org.testng.annotations.BeforeMethod;
import org.testng.annotations.Parameters;
import java.net.URL;
import java.time.Duration;

public class BaseTests {
    protected static ThreadLocal<RemoteWebDriver> driver = new ThreadLocal<RemoteWebDriver>();
    public static String remote_url = "http://localhost:4444";
    public final static int TIMEOUT = 5;

    @BeforeMethod
    @Parameters("browser")
    public void setUp(String browser) throws Exception {
        if(browser.equalsIgnoreCase("chrome")) {

            ChromeOptions options = new ChromeOptions();
            options.addArguments("--start-maximized");
            options.addArguments("--headless=new");
            options.addArguments("--remote-allow-origins=*");
            driver.set(new RemoteWebDriver(new URL(remote_url), options));
            System.out.println("Browser Started :"+ browser);

        } else if (browser.equalsIgnoreCase("firefox")) {
            FirefoxOptions options = new FirefoxOptions();
            options.addArguments("--start-maximized");
            options.addArguments("-headless");
            driver.set(new RemoteWebDriver(new URL(remote_url), options));
            System.out.println("Browser Started :"+ browser);

        } else if (browser.equalsIgnoreCase("edge")) {
            EdgeOptions options = new EdgeOptions();
            options.addArguments("--start-maximized");
            options.addArguments("--headless=new");
            driver.set(new RemoteWebDriver(new URL(remote_url), options));
            System.out.println("Browser Started :"+ browser);

        } else {
            throw new Exception ("Browser is not correct");
        }

        driver.get().get("https://opensource-demo.orangehrmlive.com/");
        driver.get().manage().timeouts().implicitlyWait(Duration.ofSeconds(5));
    }

    public WebDriver getDriver() {
        return driver.get();
    }

    @AfterMethod
    public  void closeBrowser() {
        driver.get().quit();
        driver.remove();
    }

}
LoginPageTests
import org.openqa.selenium.By;
import org.testng.annotations.Test;
import static org.testng.Assert.assertEquals;

public class LoginPageTests extends BaseTests {

    By userName = By.name("username");

    By passWord = By.name("password");

    By loginBtn = By.xpath("//*[@id='app']/div[1]/div/div[1]/div/div[2]/div[2]/form/div[3]/button");

    By errorMessage = By.xpath("//*[@id='app']/div[1]/div/div[1]/div/div[2]/div[2]/div/div[1]/div[1]/p");

    By blankUsername = By.xpath("//*[@id='app']/div[1]/div/div[1]/div/div[2]/div[2]/form/div[1]/div/span");

    By dashboardPage = By.xpath("//*[@id='app']/div[1]/div[1]/header/div[1]/div[1]/span/h6");

    @Test
    public void invalidCredentials()  {

        getDriver().findElement(userName).sendKeys("1234");
        getDriver().findElement(passWord).sendKeys("12342");
        getDriver().findElement(loginBtn).click();
        String actualErrorMessage = getDriver().findElement(errorMessage).getText();
        System.out.println("Actual ErrorMessage :" + actualErrorMessage);
        assertEquals(actualErrorMessage,"Invalid credentials");

    }

    @Test
    public void blankUsername()  {

        getDriver().findElement(userName).sendKeys("");
        getDriver().findElement(passWord).sendKeys("12342");
        getDriver().findElement(loginBtn).click();
        String actualErrorMessage = getDriver().findElement(blankUsername).getText();
        System.out.println("Actual ErrorMessage :" + actualErrorMessage);
        assertEquals(actualErrorMessage,"Required");

    }

    @Test
    public void successfulLogin()  {

        getDriver().findElement(userName).sendKeys("Admin");
        getDriver().findElement(passWord).sendKeys("admin123");
        getDriver().findElement(loginBtn).click();
        String actualMessage = getDriver().findElement(dashboardPage).getText();
        System.out.println("Message :" + actualMessage);
        assertEquals(actualMessage,"Dashboard");

    }
}
6. Create a testng.xml
It is very easy to create testng.xml in the case of Eclipse. Right-click on the project, and select TestNG -> Convert to TestNG. It will create a basic testng.xml structure. In case of IntelliJ, create a new file with the name of testng.xml and copy the code from here. Here, we are running the tests parallelly also.
<?xml version="1.0" encoding="UTF-8"?>
<!DOCTYPE suite SYSTEM "https://testng.org/testng-1.0.dtd">
<suite name="Suite" parallel="tests" thread-count="3">
    <test name="Chrome Test">
        <parameter name="browser" value="chrome"></parameter>
        <classes>
            <class name="com.example.tests.LoginPageTests"/>
        </classes>
    </test> <!-- Test -->

   <test name="Firefox Test">
        <parameter name="browser" value="firefox"></parameter>
        <classes>
            <class name="com.example.tests.LoginPageTests"/>
        </classes>
    </test> <!-- Test -->

    <test name="Edge Test">
        <parameter name="browser" value="edge"></parameter>
        <classes>
            <class name="com.example.tests.LoginPageTests"/>
        </classes>
    </test> <!-- Test -->
</suite> <!-- Suite -->
version: 3. It is the latest version of the docker-compose files.
services(containers): This contains the list of the images and their configurations.
image: It defines which image will be used to spin up container.
ports: Published ports with host:container format.
container_name: You can give name to your containers.
depends_on: This defines the required dependency before spinning up the container. In our docker-compose.yml file, containers Chrome and Firefox are dependent upon container hub to spin up.
SE_NODE_MAX_INSTANCES: This defines how many instances of same version of browser can run over the Remote System.
SE_NODE_MAX_SESSIONS: This defines maximum number of concurrent sessions that will be allowed.
8. Start the Selenium Grid
We have the docker compose file ready with all the configurations required to start the selenium grid.
To start the grid we need to navigate to the folder where our docker compose file is located and run the following command:
docker-compose up
Once the grid is up and running, we can navigate to http://localhost:4444and checkout the instances which are up and running as per the configurations we gave in the docker compose file.
9. Execute the tests
Go to the command line and execute the tests using the below command:
mvn clean test
The output of the above program is shown below:
Checkout the image below, this is how the selenium grid dashboard looks when the tests execution gets started
As mentioned earlier, in selenium grid 4, we have the sessions overview as well. So, when we click on the Session Tab we can see the execution happening live and there are other details as well displayed in the Dashboard like Capabilities, Start time, Duration and Node URI which are useful metrics from the test automation reporting.
We need to click on the video icon beside the browser session to watch the session live and it will ask for password here. The password is “secret”
This is how the test execution in Chrome looks like and its actually executing the tests.
10. View the Reports
TestNG generate the reports. Go to target/surefire-reports as shown in the below image.
Emailable-Report.html
Index.html
11. Stop the Selenium Grid
Once the execution of the tests are finished, it is advisable to stop the Grid. To stop the grid, we can press ctrl+c in the command prompt/terminal and it will instantly stop the containers. To Stop and remove containers, networks, volumes, and images created by docker we can use the following command:
docker-compose down
Congratulations!!. The above steps allow running Selenium tests in Docker seamlessly. Happy Learning.
Selenium Grid enables the execution of WebDriver scripts on remote machines (virtual or physical) by routing client commands to remote browser instances. Its goal is to make it simple to perform tests on numerous machines in parallel.
Selenium Grid enables us to run tests on multiple computers in parallel and to manage different browser versions and browser configurations centrally (rather than in each individual test).
What is new in Selenium Grid 4?
Grid 4 makes use of a variety of new technologies to enable scaling while allowing for local execution.
Selenium Grid 4 is a new implementation that does not share the previous version’s codebase.
I like how noVNC is packaged with Selenium Grid. In the dashboard, there is a Sessions tab that, when clicked, displays the links to the browser sessions that are now active, along with a video icon. When you click the video icon, you will be prompted to enter the password (“secret”), following which you will be taken to the current browser session where you can view the test live.
If we wanted to observe what was going on inside the browser session, we had to explicitly configure the grid for noVNC viewer in the prior version. From the grid, we just saw the browser icons highlighted, letting us know that the tests were being run in this or that browser.
What is Docker?
Docker is an open platform for developing, shipping, and running applications. Docker enables you to separate your applications from your infrastructure so you can deliver software quickly. With Docker, you can manage your infrastructure in the same ways you manage your applications.
CLI Options for Docker
What is Docker Compose?
Docker Compose is a tool that helps you define and share multi-container applications. With Compose, you can create a YAML file to define the services and with a single command, you can spin everything up or tear it all down.
Docker Desktop does not start automatically after installation. To start Docker Desktop, search for Docker, and select Docker Desktop in the search results. When the whale icon in the status bar stays steady, Docker Desktop is up-and-running, and is accessible from any terminal window.
Creating an instance of the Remote WebDriver and passing the selenium endpoint and chrome options defined in it.
To run a Remote WebDriver client, we first need to connect to the RemoteWebDriver. We do this by pointing the URL to the address of the server running our tests. In order to customize our configuration, we set desired capabilities.
BaseTests
import org.openqa.selenium.WebDriver;
import org.openqa.selenium.chrome.ChromeOptions;
import org.openqa.selenium.remote.RemoteWebDriver;
import org.testng.annotations.AfterMethod;
import org.testng.annotations.BeforeMethod;
import java.net.URL;
import java.time.Duration;

public class BaseTests {
    protected static ThreadLocal<RemoteWebDriver> driver = new ThreadLocal<RemoteWebDriver>();
    public static String remote_url = "http://localhost:4444";
    public final static int TIMEOUT = 5;

    @BeforeMethod
    public void setUp() throws Exception {

        ChromeOptions options = new ChromeOptions();
        options.addArguments("--start-maximized");
        driver.set(new RemoteWebDriver(new URL(remote_url), options));
        System.out.println("Browser Started : Chrome");

        driver.get().get("https://opensource-demo.orangehrmlive.com/");
        driver.get().manage().timeouts().implicitlyWait(Duration.ofSeconds(TIMEOUT));
        }


    public WebDriver getDriver() {
        return driver.get();
    }

    @AfterMethod
    public  void closeBrowser() {
        driver.get().quit();
        driver.remove();
    }

}
LoginPageTests
import org.openqa.selenium.By;
import org.testng.annotations.Test;
import static org.testng.Assert.assertEquals;

public class LoginPageTests extends BaseTests {

    By userName = By.name("username");
    By passWord = By.name("password");
    By loginBtn = By.xpath("//*[@id='app']/div[1]/div/div[1]/div/div[2]/div[2]/form/div[3]/button");
    By errorMessage = By.xpath("//*[@id='app']/div[1]/div/div[1]/div/div[2]/div[2]/div/div[1]/div[1]/p");
    By blankUsername = By.xpath("//*[@id='app']/div[1]/div/div[1]/div/div[2]/div[2]/form/div[1]/div/span");

   @Test
    public void invalidCredentials() {

        getDriver().findElement(userName).sendKeys("1234");
        getDriver().findElement(passWord).sendKeys("12342");
        getDriver().findElement(loginBtn).click();
        String actualErrorMessage = getDriver().findElement(errorMessage).getText();
        System.out.println("Actual ErrorMessage :" + actualErrorMessage);
        assertEquals(actualErrorMessage,"Invalid credentials");

    }

    @Test
    public void blankUsername() {

        getDriver().findElement(userName).sendKeys("");
        getDriver().findElement(passWord).sendKeys("12342");
        getDriver().findElement(loginBtn).click();
        String actualErrorMessage = getDriver().findElement(blankUsername).getText();
        System.out.println("Actual ErrorMessage :" + actualErrorMessage);
        assertEquals(actualErrorMessage,"Required");

    }
}
6. Create a testng.xml
It is very easy to create testng.xml in the case of Eclipse. Right-click on the project, and select TestNG -> Convert to TestNG. It will create a basic testng.xml structure. In case of IntelliJ, create a new file with the name of testng.xml and copy the code from here.
<?xml version="1.0" encoding="UTF-8"?>
<!DOCTYPE suite SYSTEM "https://testng.org/testng-1.0.dtd">
<suite name="Suite" parallel="none" thread-count="1">
    <test name="Chrome Test">
        <parameter name="browser" value="chrome"></parameter>
        <classes>
            <class name="com.example.tests.LoginPageTests"/>
        </classes>
    </test> <!-- Test -->

</suite> <!-- Suite -->
version: 3. It is the latest version of the docker-compose files.
services(containers): This contains the list of the images and their configurations.
image: It defines which image will be used to spin up container.
ports: Published ports with host:container format.
container_name: You can give name to your containers.
depends_on: This defines the required dependency before spinning up the container. In our docker-compose.yml file, containers Chrome and Firefox are dependent upon container hub to spin up.
SE_NODE_MAX_INSTANCES: This defines how many instances of same version of browser can run over the Remote System.
SE_NODE_MAX_SESSIONS: This defines maximum number of concurrent sessions that will be allowed.
8. Start the Selenium Grid
We have the docker compose file ready with all the configurations required to start the selenium grid.
To start the grid we need to navigate to the folder where our docker compose file is located and run the following command:
docker-compose up
Once the grid is up and running, we can navigate to http://localhost:4444. We can then check out the instances. They are up and running as per the configurations we gave in the docker compose file.
9. Execute the tests
Go to the command line and execute the tests using the below command:
mvn clean test
The output of the above program is shown below
Checkout the image below, this is how the selenium grid dashboard looks when the tests execution gets started
As mentioned earlier, in selenium grid 4, we have the sessions overview as well. So, when we click on the Session Tab we can see the execution happening live and there are other details as well displayed in the Dashboard like Capabilities, Start time, Duration and Node URI which are useful metrics from the test automation reporting.
We need to click on the video icon beside the browser session to watch the session live and it will ask for password here. The password is “secret”
This is how the test execution in Chrome looks like and its actually executing the tests.
10. View the Reports
TestNG generate the reports. Go to target/surefire-reports as shown in the below image.
Emailable-Report.html
Index.html
Congratulations!!. The above steps allow running Selenium tests in Docker seamlessly. Happy Learning.
Consider a sample JSON which has 4 sets of data. This data we will be passing to a POST request.
Create a request in Postman
Create a request in Postman. Below is the URL of the request.
https://reqres.in/api/users
Paste the body of the request in the Body part of the Postman.
Create Tests for the request
Click on the “Tests”. Write the tests as shown below:
pm.test : This is the function for writing test specifications, pm here refers to Postman api and test refers to the specification of the function which is for testing purposes
Status code is 201 : This line is just a string which is the test name. When your test is performed, this string will be written in front of the result.
function(){}: The next parameter is the function that is passed to perform the test
pm.response : This is used to capture the response received and perform assertions on it such as status code, headers etc.
If you need help in creating the test, you can refer to the snippets present on the right side of the console.
Type of Tests
1.Test to check Status code
This test check the status code of the response. Here, we are checking status code if the status code is 201, then pass the test.
pm.test("Status code is 201", function () {
    pm.response.to.have.status(201);
});
The output of the above test is
2. Test to check the Status code from a list of codes
This test check the status code of the response. Here, we are checking status code if the status code is either 201 or 202, then pass the test.
pm.test("Successful POST request", function () {
    pm.expect(pm.response.code).to.be.oneOf([201,202]);
});
The output of the above test is
3. Test to check status code is not 404
This test check the status code of the response. Here, we are checking status code if the status code is not 404, then pass the test.
pm.test("The endpoint does not return unexpected status code", () => {

  // change 404 to the response code you do not expect
  pm.response.to.not.have.status(404);
});
The output of the above test is
4. Test to check the status code name
This test check the name of the status of the response. Here, we are checking if the name of the status is “Created”, then pass the test.
pm.test("Status code name has string", function () {
    pm.response.to.have.status("Created");
});
The output of the above test is
5. Test to check Content-Type is present
This test check if the response contains header as Content-Type, then pass the test.
pm.test("Content-Type is present", function () {
    pm.response.to.have.header("Content-Type");
});
The output of the above test is
6. Test to check the expected header
This test check the headers like content-type, accept, token and so on. Here, we have checked if the content-type is “application/json” or not. If yes, then pass the test.
This test checks the text in the response. Here, it is checking if the response has text “Postman”, then passes the test.
pm.test("Body matches string", function () {
    pm.expect(pm.response.text()).to.include("Postman");
});
The output of the above test is
8. Test to check response body contains JSON value
This test checks the JSON data in the response. Here, it is checking if the JSON response contains attribute name whose value is “Postman”, then passes the test.
pm.test("Value of name", function () {
    var jsonData = pm.response.json();
    pm.expect(jsonData.name).to.eql("Postman");
});
The output of the above test is
9. Test to check field value in response
This test checks the key-value of the response. Here, it is checking if the response has key as “name “and value as “Postman” and key as job and name as “Test”, then passes the test.
pm.test("API response contains the expected fields", () => {
  const response = pm.response.json();

  // the line below checks value of the name field is Postman.
  pm.expect(response).to.have.property("name", "Postman");

  // the line below checks value of the job field is Test (string).
  pm.expect(response).to.have.property("job", "Test");
});
The output of the above test is
10. Test to check response time
This test check the response time of the response. Here, it is checking is the time taken by the response to return is less than 200 ms, then pass the test.
pm.test("Response time is less than 200ms", function () {
    pm.expect(pm.response.responseTime).to.be.below(200);
});
The output of the above test is
11. Test an assertion value type
This test check the test data type of the values of the keys. Here, we are checking if the data type for the id is number, then pass the test.
Test the type of any part of the response:
const responseJson = pm.response.json();
pm.test("Test Data Type of the response", () => {

    pm.expect(responseJson.job).to.be.a("string");
    pm.expect(parseInt(responseJson.id)).to.be.a("number");
});
The output of the above test is
12. Test to check multiple assertions
This test checks the multiple assertions in the response.
pm.test("The response has all properties", () => {
    //parse the response JSON and test three properties
    const responseJson = pm.response.json();
    pm.expect(responseJson.name).to.eql("Postman");
    pm.expect(responseJson.job).to.be.a('string')
    pm.expect(responseJson.id).to.have.lengthOf(3);
});
The output of the above test is
If any of the contained assertions fails, the test as a whole will fail. All assertions must be successful for the test to pass.
13. Test to check nested field value in response
This test checks the nested field value in the response.
Sample Response
pm.test("API response contains the expected fields", () => {
  const response = pm.response.json();

  // the line below checks value of the id field is 2 (number).
  pm.expect(response).to.have.property("id", 2);

  // the line below checks value of the name field is Morty Smith (string).
  pm.expect(response).to.have.property("name", "Morty Smith");

  // the line below checks value of the origin.name field is Earth (C-137) (string).
  pm.expect(response).to.have.nested.property("location.name", "Citadel of Ricks");
});
The output of the above test is
14. Test to check nested array value in response
We can use the below script to check the value of the second item in the episode array of the endpoint.


