Integrating JMeter with Jenkins is a powerful way to enhance CI/CD pipelines by automating performance testing. In this tutorial, we are going to learn how we can integrate JMeter with Jenkins.
Apache JMeter is a popular open-source testing tool. It is widely used for performance testing, load testing, and functional testing of web applications and other services. Jenkins is an open-source automation server. It can be used with these tools to automate the testing process easily.
Table of Contents
Why do we need to integrate JMeter with Jenkins?
A few of the main benefits of using JMeter with Jenkins are:
- Unattended test execution for each system.
- Build failure logs and recovery steps.
- Secure and easy access to test reports of each build.
- Automation of routine work.
Prerequisite
- Apache JMeter is installed on the system : It will be used for creating and executing performance test scripts.
- Jenkins is installed on the system. It is an open-source automation server. Jenkins will manage the build and deployment pipelines. It will also execute JMeter tests as part of the CI/CD process.
Implementation Steps
Step 1: Download the Performance Plugin
To generate a Performance Report in Jenkins, we need to download Performance Plugin. Please refer to this tutorial to install the plugin – How to install Plugins in Jenkins.

Step 2: Create a JMeter Script
It is advisable to have a JMeter Script built and tested that it is working locally. To know how to create a JMeter Script, please refer to this tutorial – How to send POST requests in JMeter.
Step 3: Create a new FreeStyle project
- Give the Name of the project – JMeter_Demo
- Click on the FreeStyle project.
- Click on the OK button.

In the General section, enter the project description in the Description box.

Step 4: Source Code Management
Select Source Code Management as None if the project is locally present on the machine.
Step 5: Select Execute Windows batch command
In the Build Steps section, select Execute Windows batch command.

Use the below command to go to the path where the JMeter is placed in your system.
cd C:\Users\Vibha\Documents\Vibha\Automation\apache-jmeter-5.6\apache-jmeter-5.6\bin

jmeter -n -t C:\Users\Vibha\Documents\Vibha\Automation\apache-jmeter-5.6\apache-jmeter-5.6\bin\POST_Demo.jmx -l C:\Users\Vibha\Documents\Vibha\Automation\apache-jmeter-5.6\apache-jmeter-5.6\results\result1.jtl
In the above command, we are executing the JMeter Script – POST_Demo.jmx as well as generating a result1.jtl file in the folder results.
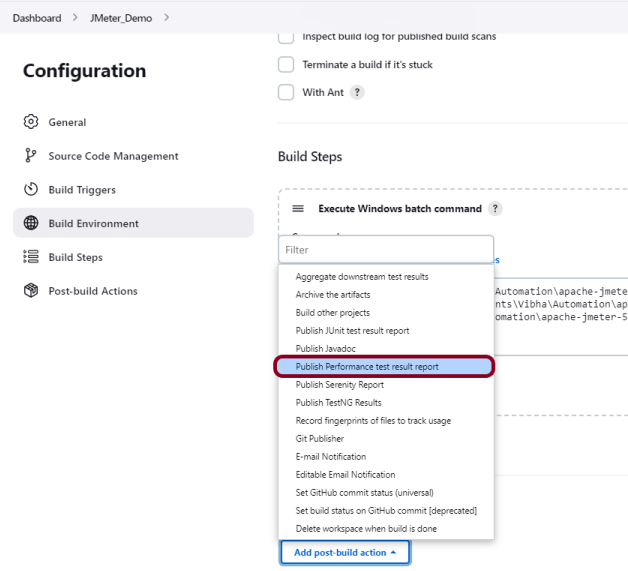
Step 6: Select “Publish Performance test result report” from “Post Build Actions”
Scroll down to ‘Post Build Actions’ and click on the ‘Add Post Build Actions’ drop-down list. Select “Publish Performance test result report.“.

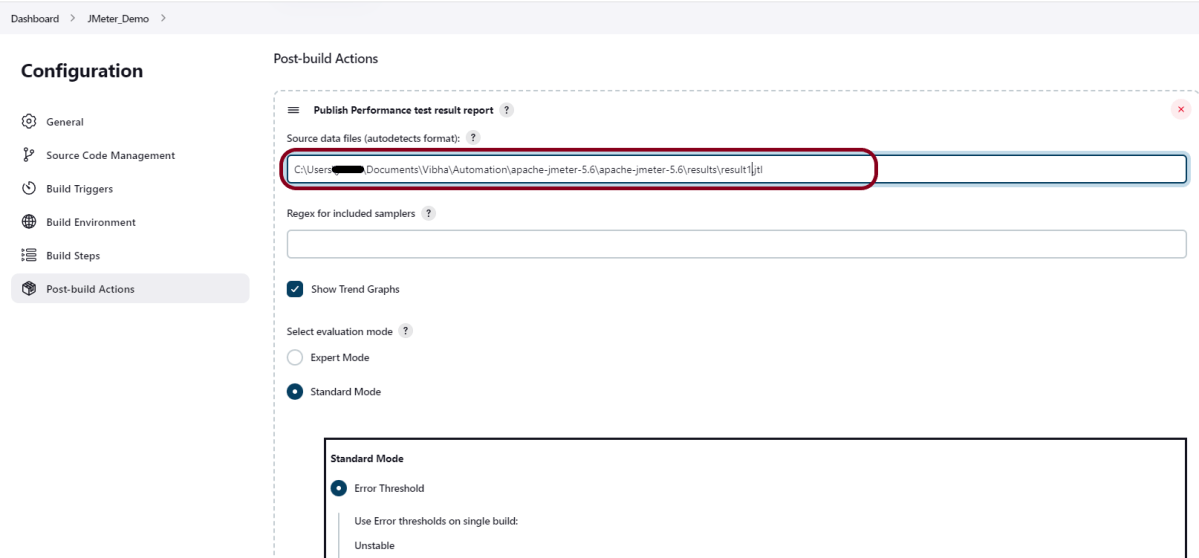
Enter the Source data files as the path in workspace where the report will be saved .

Click on the Apply and Save buttons.
We have created a new project “JMeter_Demo” with the configuration to run the JMeter and also to generate JMeter Reports after execution using Jenkins.

Step 7: Execute the tests
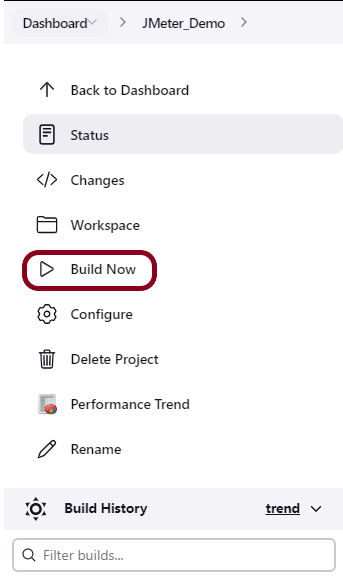
Let’s execute it now by clicking on the “Build Now” button.

Right-click on Build Number (here in my case it is #1).

Click on Console Output to see the result.

Step 8: View the Performance Report
Once the execution is completed, we can see a link to view the ‘Performance Report’.

Click on the Performance Report. It displays the summary of the tests.

Congratulations on making it through this tutorial and hope you found it useful! Happy Learning!! Cheers!!