Last Updated On
Postman contains a full-featured testing sandbox that enables you to write and execute JavaScript-based tests for your API. You can then integrate Postman with your CI/CD build system using Newman, the command-line collection runner for Postman. In this tutorial, we are going to learn how we can create a Newman Report in Jenkins.
Table of Contents
Prerequisite:
- Jenkins installed on the machine
- NodeJS installed on the machine
Implementation Steps
Step 1: Download the NodeJS Plugin
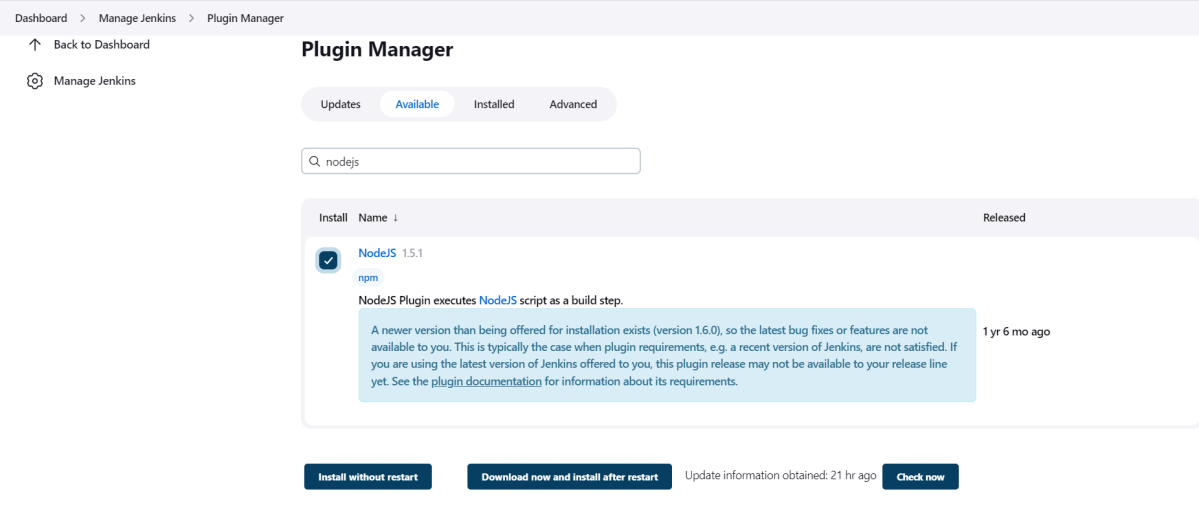
To generate a Performance Report in Jenkins, we need to download NodeJS Plugin. Please refer to this tutorial to install the plugin – How to install Plugins in Jenkins.
Go to Manage Jenkins > Manage Plugins and install the NodeJS plugin.
Step 2: Global Tool Configuration for NodeJS
Go to Manage Jenkins > Global Tool Configuration and under NodeJS, select Add NodeJS.

Enter a name for the Node.js installation.
Select the version of NodeJS installed on your machine from the Version dropbox.
In Global npm packages to install, enter newman.
Click on the Apply and Save buttons.
Step 3: Create a new FreeStyle project
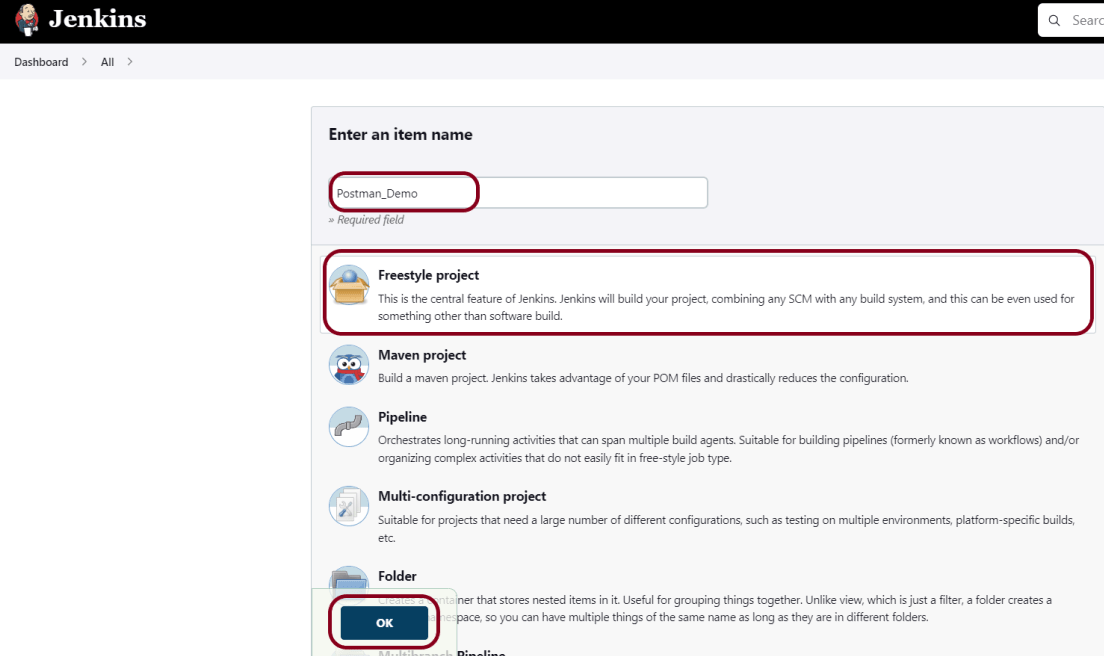
- Give the Name of the project – Postman_Demo
- Click on the FreeStyle project.
- Click on the OK button.
In the General section, enter the project description in the Description box.
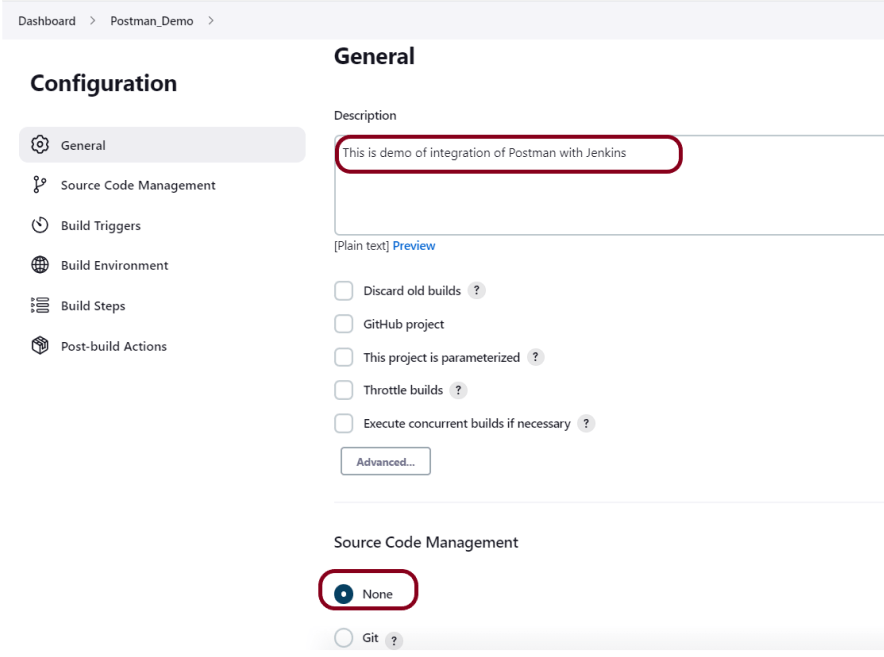
Step 4: Source Code Management
Select Source Code Management as None if the project is locally present on the machine.
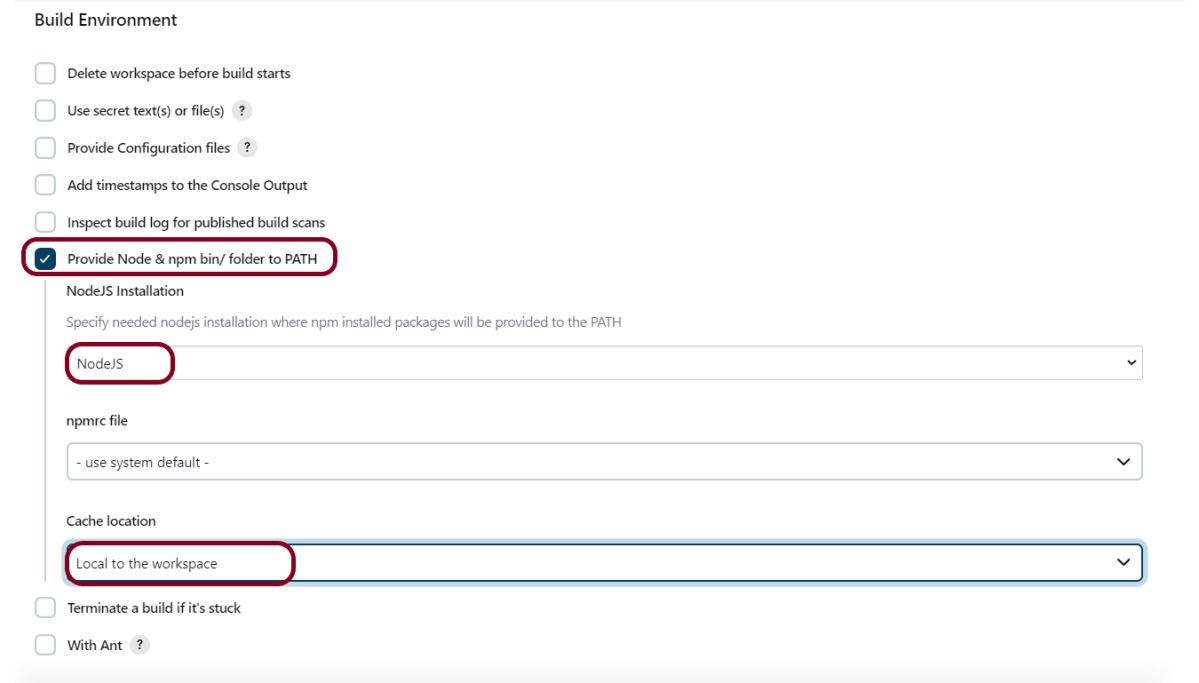
Step 5: Build Environment
Select the “Provide Node & npm bin/folder to PATH” option.
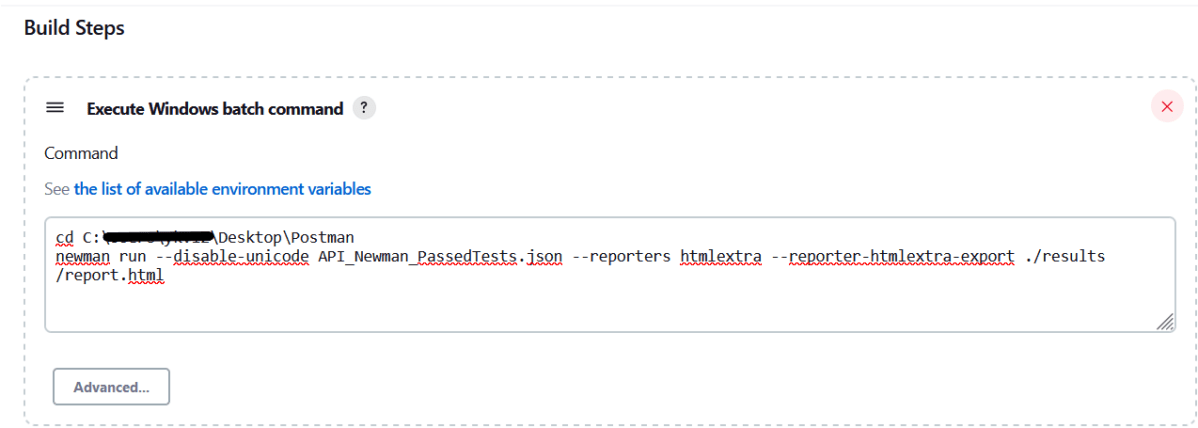
Step 6: Select Execute Windows batch command
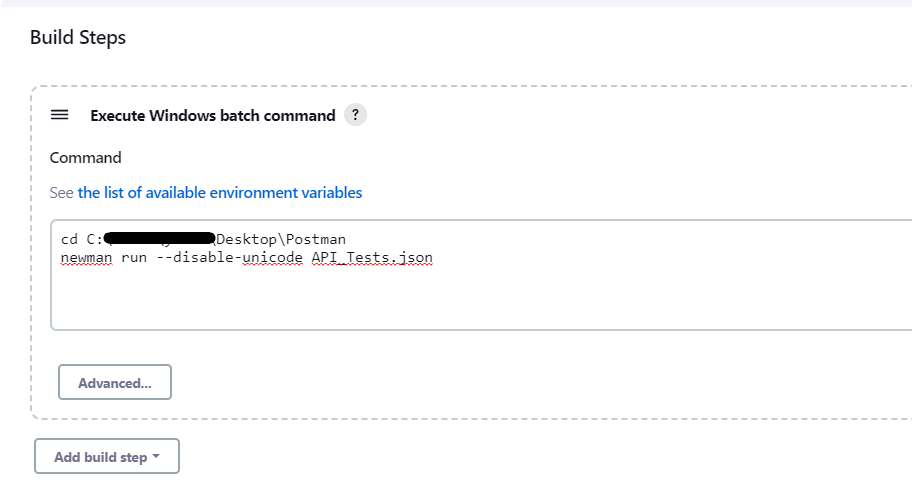
In the Build Steps section, select Execute Windows batch command.

Use the below command to go to the path where the JMeter is placed in your system.
cd C:\Users\Vibha\Desktop\Postman
newman run --disable-unicode API_Newman_PassedTests.json --reporters htmlextra --reporter-htmlextra-export ./results/report.html
Step 7: Select “Publish HTML reports” from “Post Build Actions”
Scroll down to “Post Build Actions” and click on the “Add Post Build Actions” drop-down list. Select “Publish HTML reports“.
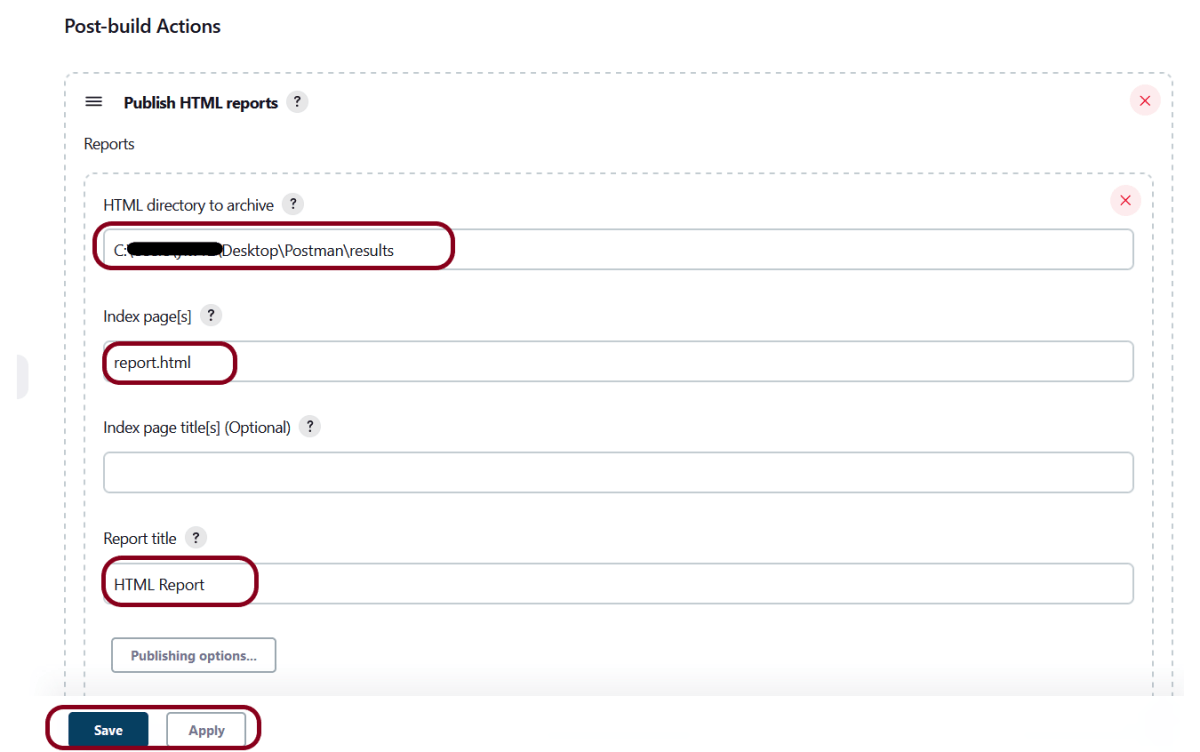
Enter the HTML directory to archive – ..\Postman\results, Index page[s] – report.html and Report title – HTML Report.
Click on the Apply and Save buttons.
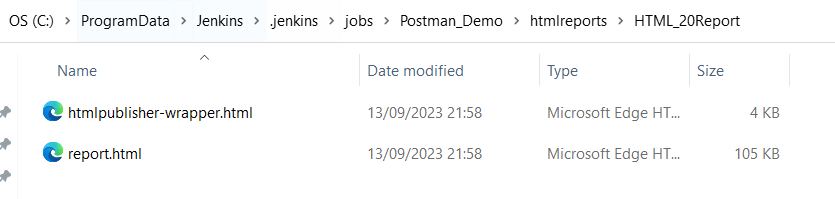
If you want to see where the report is saved on desktop, go to – C:\ProgramData\Jenkins.jenkins\jobs\Postman_Demo\htmlreports\HTML_20Report.
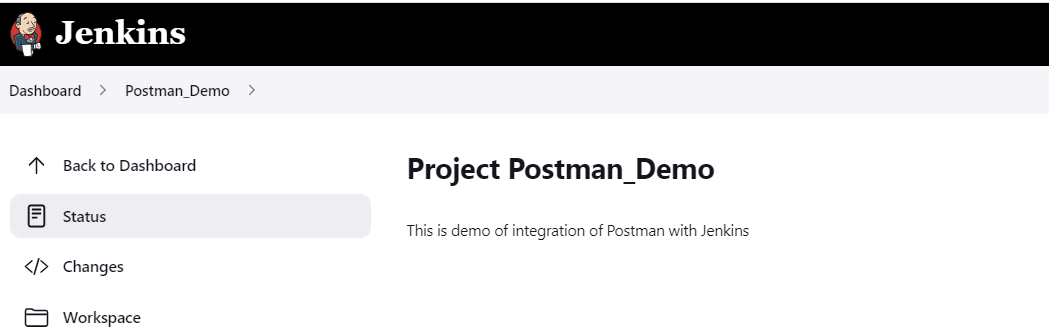
We have created a new project “Postman_Demo” with the configuration to run the Postman scripts.
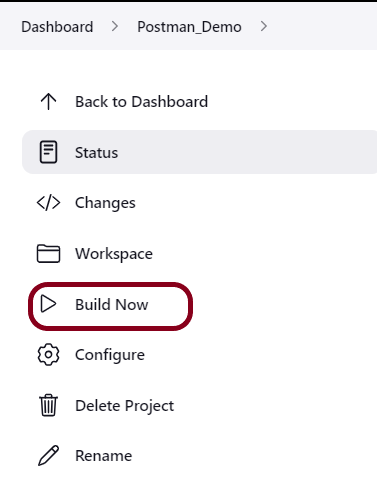
Step 8: Execute the tests
Let’s execute it now by clicking on the “Build Now” button.
Right-click on Build Number (here in my case it is #1).
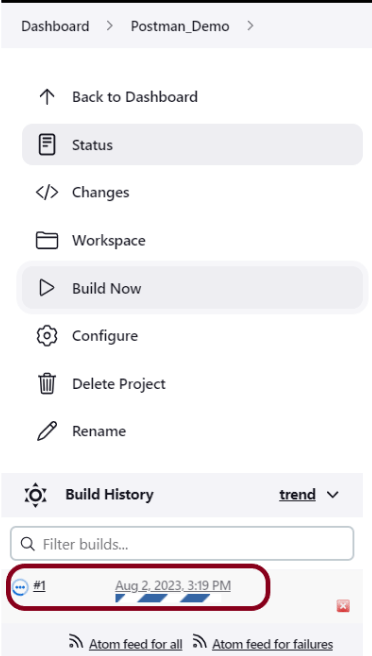
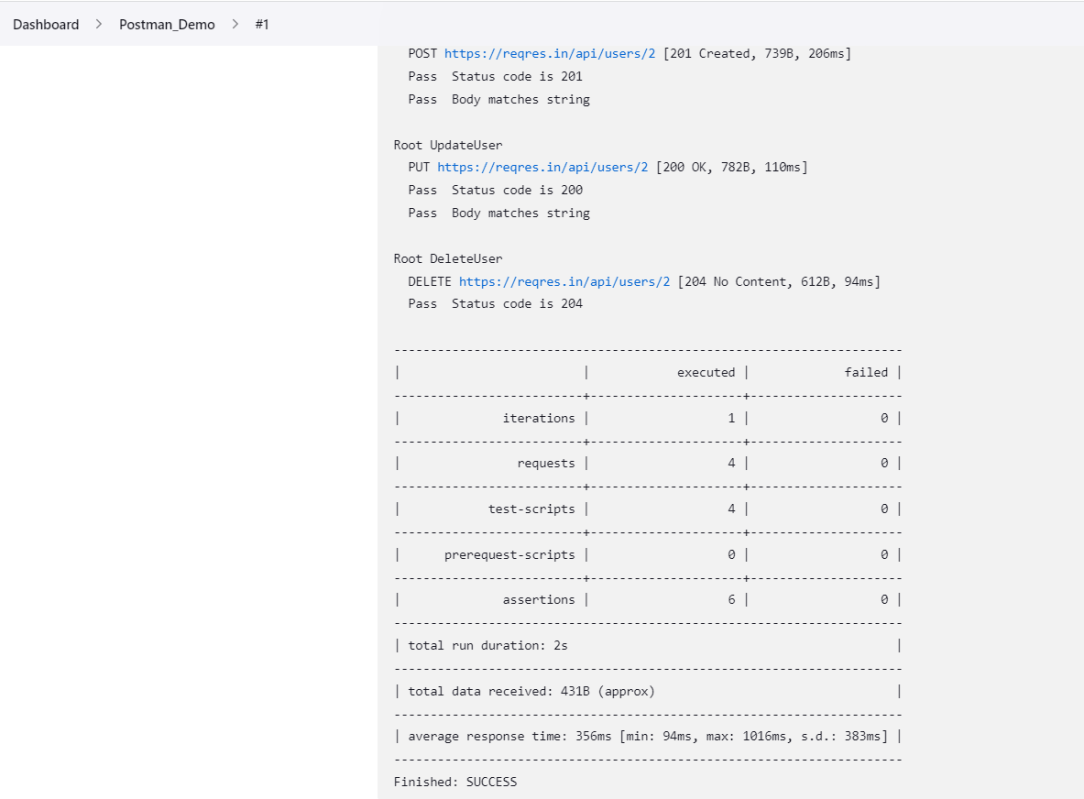
Click on Console Output to see the result.
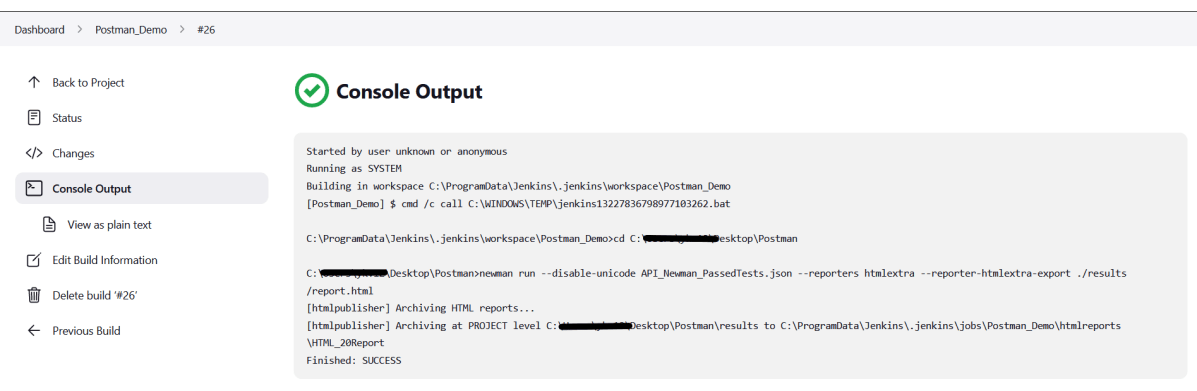
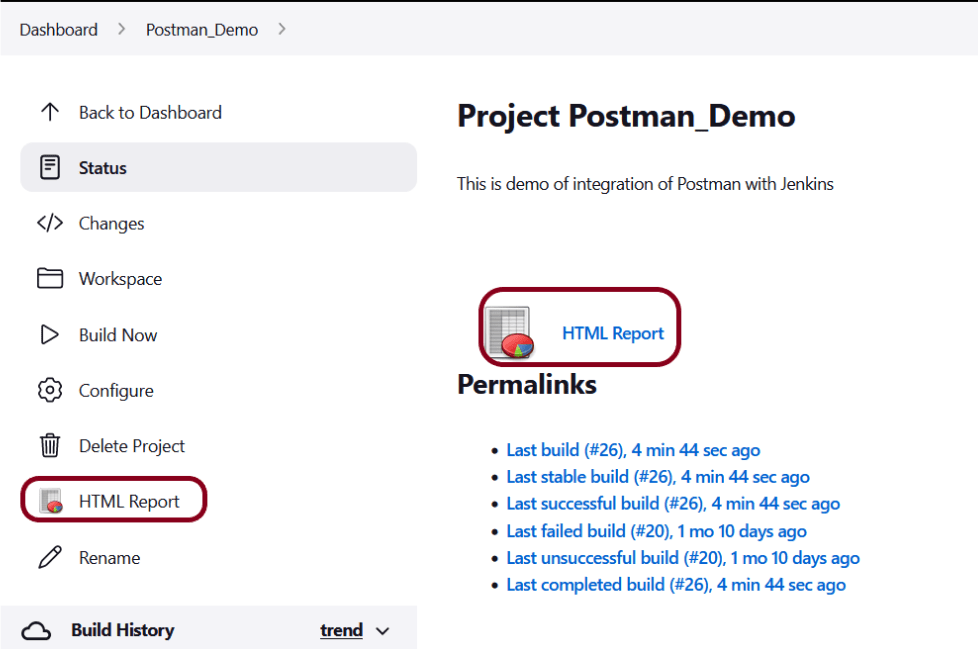
Step 9: View the HTML Report
Once the execution is completed, click on go “Back to Project“, and we could see a link to view the “HTML Report“.
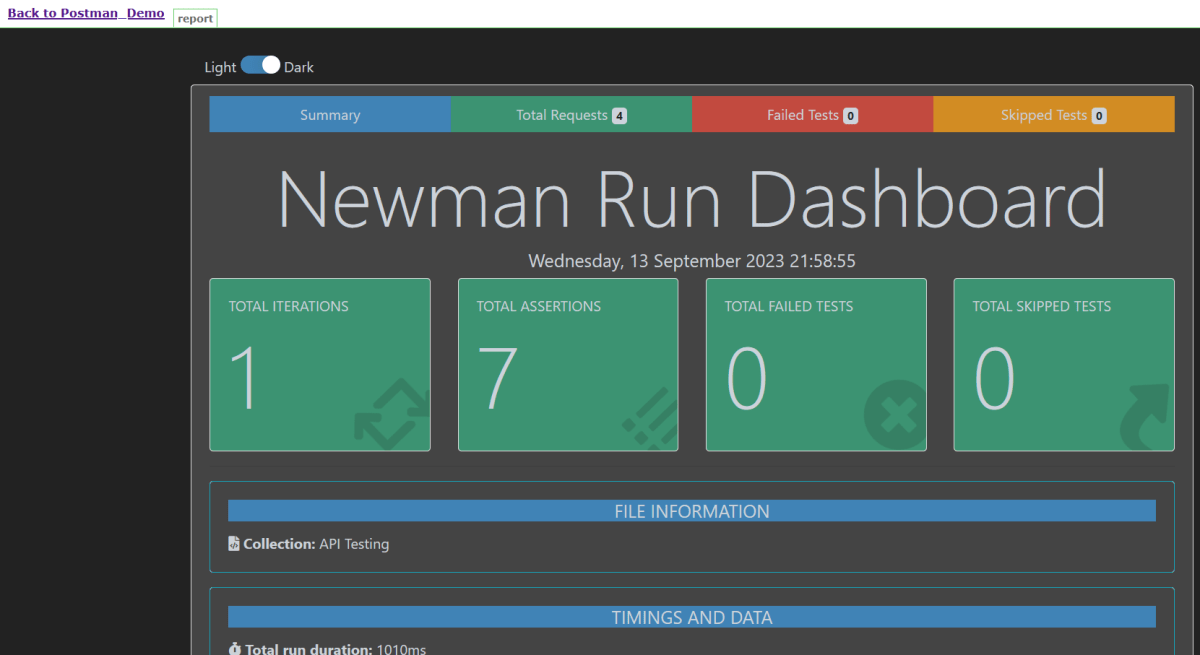
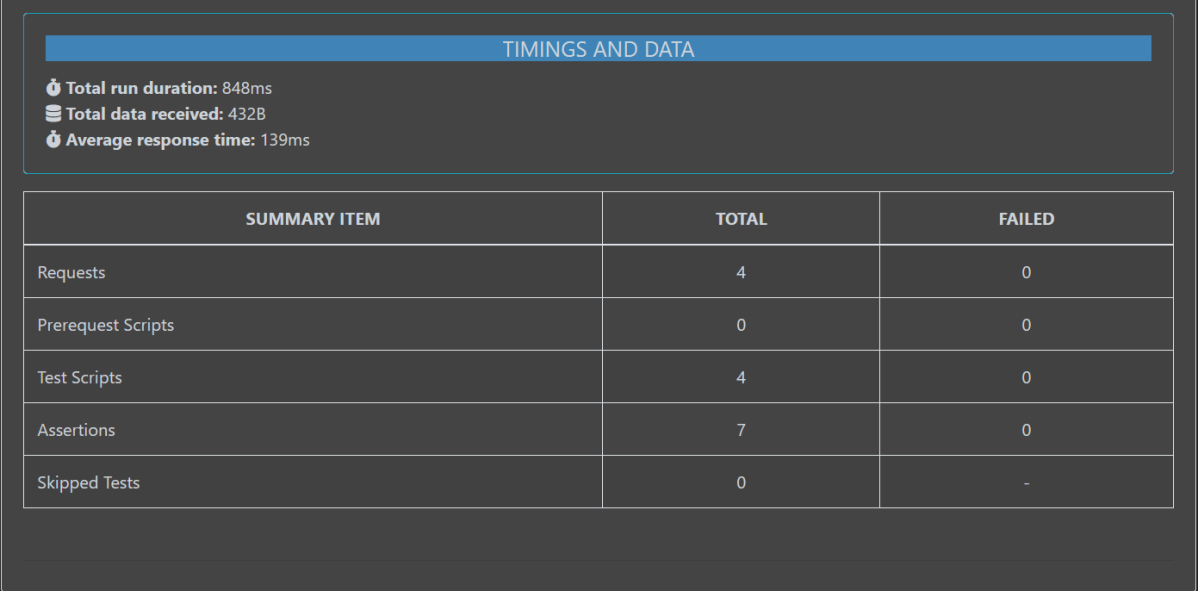
Below is the HTML Report generated in Jenkins.
In the case, we see that HTML Report does not look very pretty. The reason is that CSS is stripped out because of the Content Security Policy in Jenkins.
Go to Manage Jenkins -> Manage Nodes and Clouds. Click on the Script Console option. Type in the following command and Press Run. If you see the output as ‘Result:’ then the protection is disabled. Re-Run your build and you can see that the new HTML files archived will have the CSS enabled.
System.setProperty("hudson.model.DirectoryBrowserSupport.CSP","")
Rerun the build again. Now you will see a beautiful report.
Congratulations on making it through this tutorial and hope you found it useful! Happy Learning!! Cheers!!