Introduction of JMeter

HOME

What is Apache JMeter?

The Apache JMeter™ application is open-source software, a 100% pure Java application designed to load test functional behaviour and measure performance. JMeter is mainly used for testing Web applications or FTP applications but currently, it is applicable in functional testing, JDBC database connections, Web services, generic TCP connections, and OS native processes. You can perform various testing activities like Performance, Load, Stress, Regression, and Functional testing, in order to get accurate performance metrics against your web server.

JMeter is not a browser, it works at the protocol level. As far as web services and remote services are concerned, JMeter looks like a browser (or rather, multiple browsers); however, JMeter does not perform all the actions supported by browsers. In particular, JMeter does not execute the JavaScript found in HTML pages. Nor does it render the HTML pages as a browser does (it’s possible to view the response as HTML etc., but the timings are not included in any samples, and only one sample in one thread is ever displayed at a time). More detail about JMeter can be found here.

Apache JMeter features include:

  1. Open Source – JMeter is a 100% pure Java desktop application
  2. Platform independent -JMeter is written and developed using Java, so it can run on any environment/workstation that accepts a Java virtual machine, for example – Windows, Linux, Mac, etc.
  3. Supports cross platformJMeter has unlimited testing capabilities allowing you to work both with local and server-based instances. The only thing you need to get started is Java (JRE) installed on the host.
  4. Simulation – JMeter can simulate multiple users by using virtual users or unique users in order to generate a heavy load against the web application under test.
  5. Supports Concurrency – Full multi-threading framework allows concurrent sampling by many threads and simultaneous sampling of different functions by separate thread groups.
  6. Easy to Use – On Linux/Unix, JMeter can be invoked by clicking on JMeter shell script. On Windows, it can be invoked by starting the jmeter.bat file.
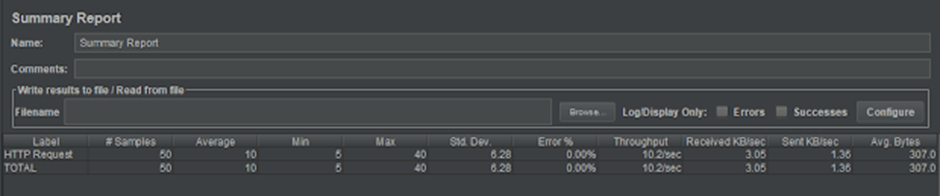
  7. Test Result Visualization – JMeter has a set of tools for collecting and displaying results, like table, graph, tree, and reports. The results can be saved in CSV, XML, HTML etc.
  8. Support various server types JMeter is highly extensible and capable to load the performance test in different server types: HTTP, HTTPS, SOAP, JDBC, LDAP, JMS, POP3
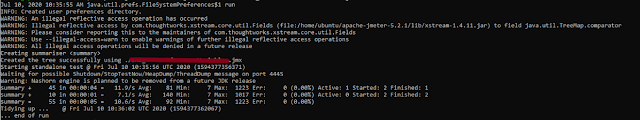
  9. Works great even without UI – Test cases are executable in the command line which allows for their full integration into CI tools’ cases.

JMeter Workflow

JMeter sends requests to a target server by simulating a group of users. Server process the requests. Subsequently, data is collected to calculate statistics and display performance metrics of the target server through various formats.                                                                         

Congratulations on making it through this tutorial and hope you found it useful! Happy Learning!! Cheers!!

Additional Tutorials

 How to send POST requests in JMeter
JMeter Authorization with access token
 How to run JMeter tests from the command line
Constant Throughput Timer in JMeter
How to generate Random Variables in JMeter

Constant Throughput Timer in JMeter

HOME

What is Throughput?

Throughput is calculated as requests/units of time. The time is calculated from the start of the first sample to the end of the last sample. This includes any intervals between samples, as it is supposed to represent the load on the server.

The formula is: Throughput = (number of requests) / (total time)

Suppose we want to run the load test with constant throughput in JMeter, then JMeter has a group of elements, which are called “Timers”.  And one of them has the obvious title – “Constant Throughput Timer”. That is what we need. 

What is Constant Throughput Timer?

This timer allows us to keep total throughput constant. Constant Throughput Timer is only capable of pausing JMeter threads in order to slow them down to reach the target throughput, so make sure you have enough threads in order to guarantee the desired amount of requests per second. Also, be aware that the Constant Throughput Timer is precise enough only on a minute level, so you need to properly calculate the ramp-up period and let your test run long enough. Of course, if the server is not able to handle such a load, the throughput will be lowered. Throughput may decrease if other timers contradict the Constant Throughput timer.

Constant Throughput Timer will introduce random delays between requests in such a way that a load/stress of required throughput is sent to the application.

Screenshot of Control Panel of Constant Throughput Timer

Create a Test Plan in JMeter

Step 1 –  Add Thread Group

Select Test Plan on the tree

Add Thread Group                     

To add Thread Group: Right-click on the “Test Plan” and add a new thread group: Add -> Threads (Users) -> Thread Group

In the Thread Group control panel, enter Thread Properties as follows: 

Number of Threads: 1 – Number of users connects to the target website

Loop Count: Infinite  – Number of times to execute testing

Ramp-Up Period:

Duration: 5 sec

Step 2 –  Adding JMeter elements  

The JMeter element used here is HTTP Request Sampler. In HTTP Request Control Panel, the Path field indicates which URL request you want to send

Add HTTP Request Sampler

 To add: Right-click on Thread Group and select: Add -> Sampler -> HTTP Request

Below-mentioned are the values used in HTTP Request to perform the test

Name – HTTP Request 

Server Name or IP – localhost

Port– 8010

Method– POST

Path– /demo/helloworld

Step 3 –  Add Constant Throughput Timer

To add: Right-click on Thread Group and select: Add -> Timer-> Constant Throughput Timer

Add Target Throughput: 600 (means 600 requests in 60 sec, so 10 requests per sec) Select Calculate Throughput based on – this thread only (More details about the option are present.

Step 4 – Adding Listeners to Test Plan

Listeners – They show the results of the test execution. They can show results in a different format such as a tree, table, graph, or log file

We are adding the View Result Tree listener

View Result Tree – View Result Tree shows the results of the user request in basic HTML format

To add: Right-click Test Plan, Add -> Listener -> View Result Tree

We are adding a Summary Report listener

Summary Report – The summary report creates a table row for each differently named request in your test. This is similar to the Aggregate Report, except that it uses less memory.

To add: Right-click Test Plan, Add -> Listener -> Summary Report

Step 5 – Save the Test Plan

To Save: Click File Select -> Save Test Plan as ->Give the name of the Test Plan. It will be saved as .jmx format.

Step 6  – Run the Test Plan

Click on Green Triangle as shown at the top to run the test.

Step 7 – View the Execution Status

Click on Summary Report to see the status of Run. As we can see in the summary report, 50 requests are executed as 10 requests per sec (10*5=50 requests).

Congratulations on making it through this tutorial and hope you found it useful! Happy Learning!! Cheers!!

Install Apache JMeter in Ubuntu

HOME

What is Apache JMeter?

The Apache JMeter™ application is open-source software, a 100% pure Java application designed to load test functional behaviour and measure performance. 

It can use to simulate a heavy load on a server, group of servers, network or object to test its strength or to analyze overall performance under different load types.

In this tutorial, will discuss how to install JMeter in Ubuntu. For example, I’ll use Ubuntu Desktop 18.04.

We need to install Java, before installing Apache JMeter. 

How to Install Java in Ubuntu Desktop 18.04

The command below will display the version of Java installed on the system

java --version

The command below will download Java on the system in headless mode

sudo apt-get install openjdk-11-jre-headless

How to Install Apache JMeter in Ubuntu Desktop 18.04

After Java is installed, copy the link to the archive with the latest version of Apache JMeter from the official site http://jmeter.apache.org/download_jmeter.cgi and download it:

wget http://apache.volia.net//jmeter/binaries/apache-jmeter-5.2.1.tgz

Extract the archive:

tar -xf apache-jmeter-5.2.1.tgz

How to run Apache JMeter in Ubuntu?

The command below will run the test named – PerfTest.jmx in Apache Ubuntu

./apache-jmeter-5.2.1/bin/jmeter.sh -n -t ./PerfTest.jmx

The output of JMeter Test will look like as below. 

We can see the summary of the test which include Total number of Requests processed, Total Execution Time, Throughput, Average time taken to process a request, Minimum time taken to process a request, maximum time taken to process a request and error percentage.

Congratulations on making it through this tutorial and hope you found it useful! Happy Learning!! Cheers!!

Additional Tutorials

 How to send POST requests in JMeter
JMeter Authorization with access token
 Install Apache JMeter in Ubuntu
Constant Throughput Timer in JMeter
How to generate Random Variables in JMeter

How to send GET Request in JMeter

HOME

What is Apache JMeter?

The Apache JMeter™ application is open source software, a 100% pure Java application designed to load test functional behavior and measure performance. It was design for testing Web Applications but has since expanded to other test functions.
It can used to simulate a heavy load on a server, group of servers, network or object to test its strength or to analyze overall performance under different load types.

How to send GET HTTP Request in JMeter?

We can perform GET as well as POST operation in JMeter. In this tutorial, we will only explain how we can perform GET operation.

Create a Test Plan in JMeter

Step 1 – Add Thread Group

  • Select Test Plan on the tree
  • Add Thread Group                                                                                           
    • To add Thread Group: Right click on the “Test Plan” and add a new thread group: Add -> Threads (Users) -> Thread Group

In the Thread Group control panel, enter Thread Properties as follows: We will take an example of row no 5.

  • Number of Threads: 5 – Number of users connects to the target website
  • Loop Count: 5  – Number of time to execute testing
  • Ramp-Up Period: 5 – It tells JMeter how long to delay before starting the next user. For example, if we have 5 users and a 5 -second Ramp-Up period, then the delay between starting users would be 1 second (5 seconds /5 users).

Step 2 –  Adding JMeter elements

The JMeter element used here is HTTP Request Sampler. In HTTP Request Control Panel, the Path field indicates which URL request you want to send.

2.1 Add HTTP Request Sampler

To add: Right-click on Thread Group and select: Add -> Sampler -> HTTP Request.

Below mentioned are the values use in HTTP Request to perform the test

  • Name – HTTP Request 
  • Server Name or IP – localhost
  • Port – 8010
  • Method – GET
  • Path – /demo/helloworld/demo

OR

URL – https://reqres.in/api/users?page=2

  • Name – HTTP GET Request 
  • Protocol – https
  • Server Name or IP – reqres.in
  • Port –
  • Method – GET
  • Path – /api/users?page=2

Step 3 – Adding Listeners to Test Plan

Listeners – They shows the results of the test execution. They can show results in a different format such as a tree, table, graph or log file

We are adding  View Result Tree listener

View Result Tree – View Result Tree show results of the user request in basic HTML format

To add: Right click Test Plan, Add -> Listener -> View Result Tree

Complete Test Plan will look like as shown below

Step 4 – Save the Test Plan

To Save: Click File Select -> Save Test Plan as ->Give name of the Test Plan. It will be save as .jmx format.

Sample .jmx File

Step 5  – Run the Test Plan

Click on Green Triangle as shown below to run the test.

Step 6 – View the Execution Status

Click on View Result Tree to see the status of Run. Successful request will be of Green color in the Text Section.

Sample of Failed Request. Failed request will be of Red color in View Result Tree under Text option. This screen sows the reason for the failure of the request like Connection refused here.

That’s it! Congratulations on making it through this tutorial and hope you found it useful! Happy Learning!!