Last Modified Date
JMeter supports dashboard report generation to get graphs and statistics from a test plan. In this tutorial, we will explain how to generate JMeter HTML Report.
The dashboard generator is a modular extension of JMeter. Its default behaviour is to read and process samples from CSV files to generate HTML files containing graph views. It can generate the report at the end of a load test or on demand.
There are 2 ways to generate HTML Report
- Generation after load test
- Generation from an existing sample CSV log file
Create a Test Plan in JMeter
Sample Request
{
    "name": "Test",
    "job": "JMeter"
}
Sample Response
{
  "name":"Test",
  "job":"JMeter",
  "id":"955",
  "createdAt":"2023-07-03T15:46:18.038Z"
}
Step 1 – Add Thread Group
- Select Test Plan on the tree
- Add Thread Group To add Thread Group: Right-click on the “Test Plan” and add a new thread group: Add -> Threads (Users) -> Thread Group

In the Thread Group control panel, enter Thread Properties as follows: We will take an example of row no 5
Number of Threads: 5 – Number of users connects to the target website
Loop Count: 5 – Number of times to execute testing
Ramp-Up Period: 5 – It tells JMeter how long to delay before starting the next user. For example, if we have 5 users and a 5 -second Ramp-Up period, then the delay between starting users would be 1 second (5 seconds /5 users).

Step 2 – Adding JMeter elements
The JMeter element used here is HTTP Request Sampler. In HTTP Request Control Panel, the Path field indicates which URL request you want to send
2.1 Add HTTP Request Sampler
To add: Right-click on Thread Group and select: Add -> Sampler -> HTTP Request

The below-mentioned are the values used in HTTP Request to perform the test
- Name – HTTP POST Request Demo
- Server Name or IP – reqres.in
- Port – Blank
- Method – POST
- Path – /api/users

2.2 Add HTTP Head Manager
The Header Manager lets you add or override HTTP request headers like can add Accept-Encoding, Accept, Cache-Control
To add: Right-click on Thread Group and select: Add -> Config Element -> HTTP Read Manager
The below-mentioned are the values used in Http Request to perform the test
Content-type = application/json
accept – application/json

Step 3 – Adding Listeners to Test Plan
Listeners – They show the results of the test execution. They can show results in a different format such as a tree, table, graph, or log file
We are adding the View Result Tree listener
View Result Tree – View Result Tree shows the results of the user request in basic HTML format
To add: Right-click on Test Plan, Add -> Listener -> View Result Tree

Aggregate Report
It is almost the same as Summary Report except Aggregate Report gives a few more parameters like, “Median”, “90% Line”, “95% Line” and “99% Line”.
To add: Right Click on Thread Group > Add > Listener > Aggregate Report

Step 4 – Save the Test Plan
To Save: Click File Select -> Save Test Plan as ->Give the name of the Test Plan. It will be saved in .jmx format.

The below image shows that the test is saved in Documents with the name POST_Load.jmx.

Report Generation after load test
Step 5 – Run the Test Plan from Command Line
Open the command prompt and go into JMeter’s bin folder.
cd C:\Users\Vibha\Documents\apache-jmeter-5.6\apache-jmeter-5.6\bin
Step 6 – View the Execution Status
Enter the following command:
jmeter -n -t <test JMX file> -l <test log file> -e -o <Path to output folder>
This is the command used in the script:
jmeter -n -t C:\Users\Vibha\Documents\apache-jmeter-5.6\apache-jmeter-5.6\POST_Load.jmx -l C:\Users\Vibha\Documents\JMeterResult\result1.csv -e -o C:\Users\Vibha\Documents\JMeterResult\Report
Below is the detail about the commands used in the execution.
-n: This specifies JMeter is to run in cli mode
-t: [name of JMX file that contains the Test Plan]
-l: [name of JTL file to log sample results to]
–e: generate report dashboard after load test
-o: output folder where to generate the report dashboard after the load test. The folder must not exist or be empty
The test execution is displayed in the command line as shown below:

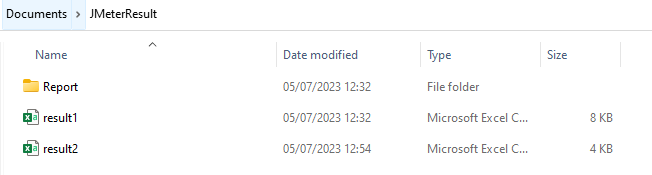
The result1.csv is saved as mentioned in the above command in the JMeterResult folder present in Documents:

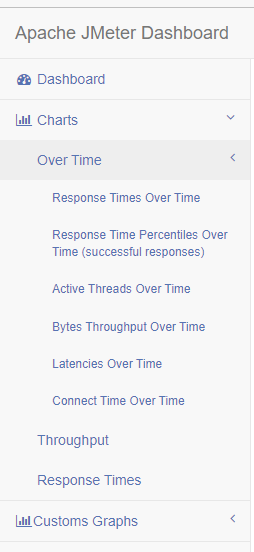
Go to the Report Folder. You can find the generated HTML files in the given report path.

This report provides the following metrics:
In the Dashboard of the report;
- APDEX (Application Performance Index) table that computes for every transaction the APDEX based on configurable values for tolerated and satisfied thresholds
- A request summary graph showing the Success and failed requests

A Statistics table providing in one table a summary of all metrics per transaction including 3 configurable percentiles:

An error table providing a summary of all errors and their proportion in the total requests

A Top 5 Errors by Sampler table providing for every Sampler (excluding Transaction Controller by default) the top 5 Errors:

You can see that there are a lot of other types of reports too. You should explore these reports.
Generation from an existing sample CSV log file
Imagine, we have run the tests from JMeter GUI. Mention the path where we want to save the result file in the Filename option of one of the listeners.
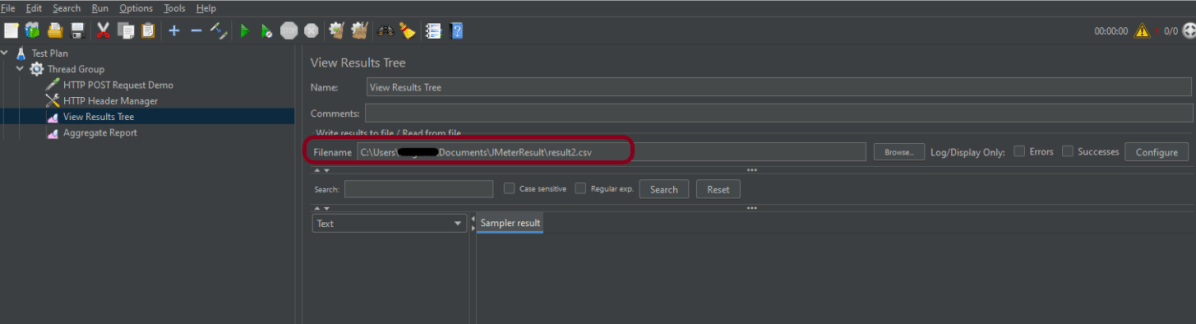
Run the tests, and we can see that the result is generated.
Now, let us create a Report.
jmeter -g C:\Users\Vibha\Documents\JMeterResult\Result2.csv -o C:\Users\Vibha\Documents\JMeterResult\Report1
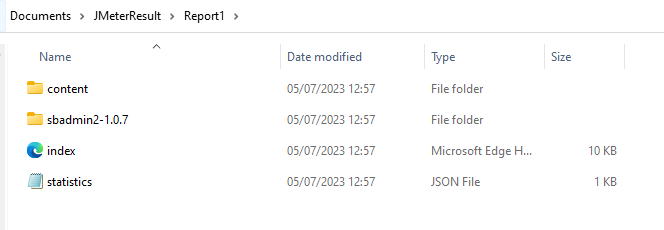
We can see that a new folder – Report1 is created.
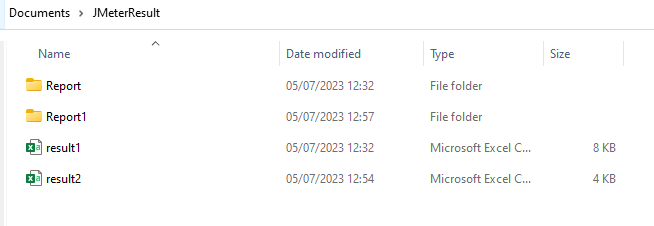
Go inside the Report1 folder and see that the Index.html report is generated.
We are done! Congratulations on making it through this tutorial and hope you found it useful! Happy Learning!!

how can i get date in source file name : like Jpetstore_01_9/19/2023. like that i want any command for that.
LikeLike
Hi , How to share Index.html file to other team member
LikeLike