Database load testing simulates multiple users interacting with a database simultaneously, measuring performance, scalability, and reliability under heavy loads. It helps identify bottlenecks, issues, and potential errors that occur with high traffic volumes.
JMeter is a popular open-source tool for load testing databases.
Table of Contents
- Prerequisite
- Implementation Steps
Prerequisite:
Install JMeter on your system
Implementation Steps:
1. Adding JDBC Driver
Add the JDBC Driver to JMeter to connect to the database.
I’m using MySQL for database testing. So, I have downloaded MySQL connector from MySQL Community Downloads

The JDBC driver should be placed in the JMeter’s `lib` directory.

2. Create a Test Plan in JMeter
Create a new test plan in JMeter by selecting File > New Test Plan. Name your test plan (e.g., “Database Load Testing”) and click Create. This will create a new test plan with a default thread group.

3. Add Thread Group
- Select Test Plan on the tree
- Add Thread Group
- To add Thread Group: Right click on the “Test Plan” and add a new thread group: Add -> Threads (Users) -> Thread Group

In the Thread Group control panel, enter Thread Properties as follows:
- Number of Threads: 5 – Number of users connects to the target website
- Loop Count: 5 – Number of time to execute testing
- Ramp-Up Period: 1 – It tells JMeter how long to delay before starting the next user.

4. Configuring Database Connection
The JMeter element used here is HTTP Request Sampler. In HTTP Request Control Panel, the Path field indicates which URL request you want to send.
Add JDBC Connection Configuration
To add: Right-click on Thread Group and select: Add –> Config Element –> JDBC Connection Configuration

Set up the following fields (these assume we will be using a MySQL database called ‘demo’):
- Variable name (here: myDatabase) bound to pool. This needs to uniquely identify the configuration. It is used by the JDBC Sampler to identify the configuration to be used. Here, it is db_variable
- Database URL: jdbc:mysql://ipOfTheServer:3306/demo
- JDBC Driver class: com.mysql.jdbc.Driver
- Username: the username of the database
- Password: password for the username
The other fields on the screen can be left as the defaults.


Add a JDBC Request Sampler
This is used to send SQL queries to the database. You can configure it to perform various operations such as SELECT, INSERT, UPDATE, DELETE.
Click your right mouse button to get the Add menu, and then select Add –> Sampler –> JDBC Request

JMeter sends requests in the order that you add them to the tree.
Enter the Pool Name: ‘db_variable’ (same as in the configuration element)
Enter the Query Type: Select Statement.
Enter the SQL query (e.g., SELECT * FROM demo.login_attempts)
Handle ResultSet: Store as String

5. Adding Listeners to Test Plan
Listeners – They shows the results of the test execution. They can show results in a different format such as a tree, table, graph or log file
We are adding View Result Tree listener & Aggregate Report
View Result Tree
View Result Tree show results of the user request in basic HTML format
To add: Right click Test Plan, Add -> Listener -> View Result Tree

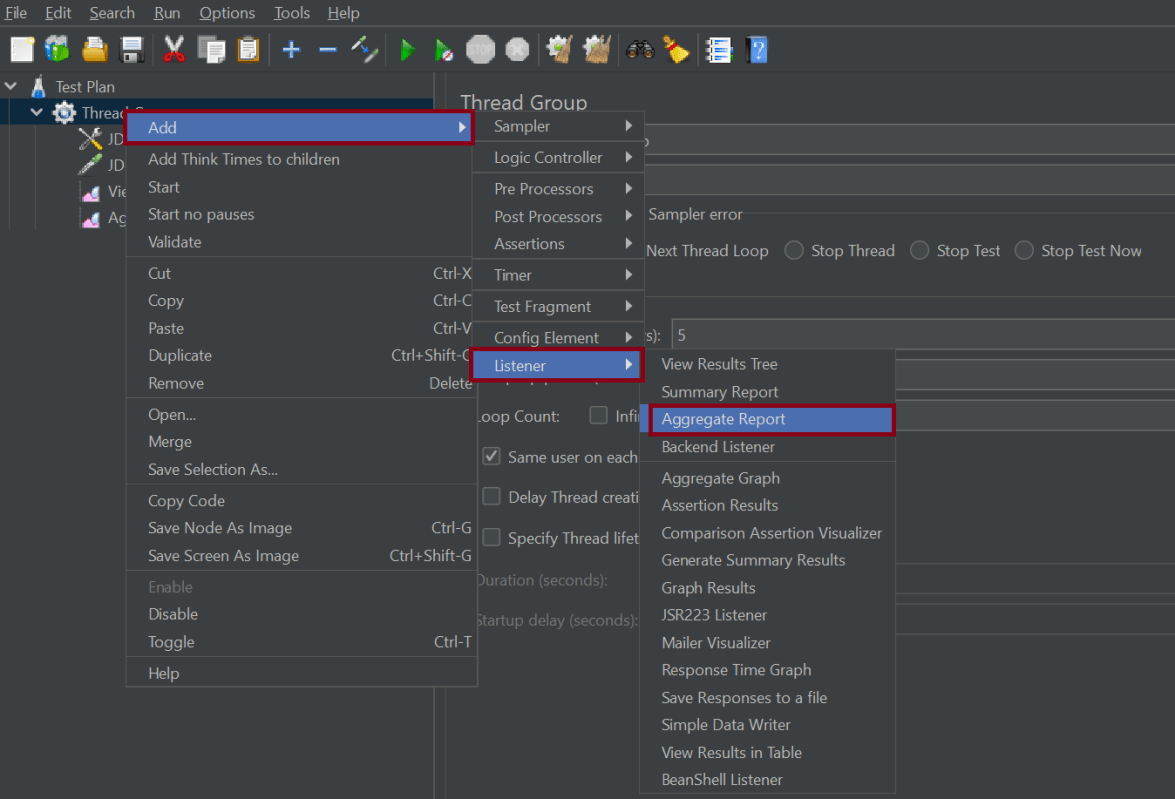
Aggregate Report
Displays a comprehensive summary of the request data.
To add: Right click Test Plan, Add -> Listener -> Aggregate Report
The entire Test Plan will look like as shown below

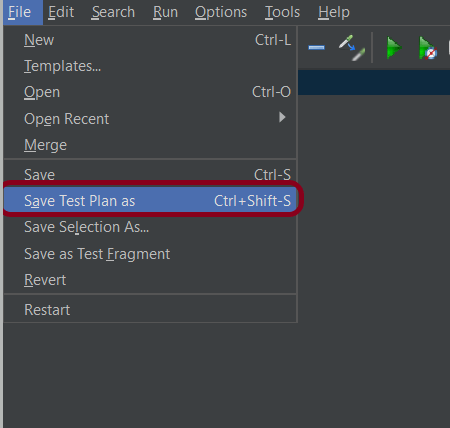
6. Save the Test Plan
To Save: Click File Select -> Save Test Plan as ->Give name of the Test Plan. It will be save as .jmx format.
Sample .jmx File

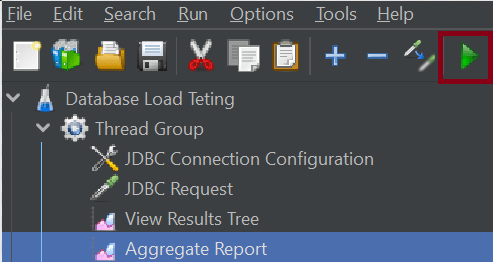
7. Run the Test Plan
Click on Green Triangle as shown below to run the test.
8. View the Execution Status
Click on View Result Tree to see the status of Run. Successful request will be of Green color in the Text Section. The View Results Tree listener breaks down each request and response in detail, including:
- Error messages (if any)
- Response time
- Bytes sent

The response body as well as response headers can be seen in the listener.

The Aggregate Report listener gives you a quick overview of the test results. It shows key details like:
- Average
- Min/Max
- Std. Dev.
- Error
Provides an aggregate of multiple sample results.
9. Troubleshooting
Connection Issues:
JMeter is incapable of connecting to the database. Make sure that the JDBC driver is correctly placed in the `lib` directory of JMeter.
SQL Errors:
Errors occur during the execution of SQL queries.Double-check the SQL syntax used in the JDBC Request Sampler.
Resource Constraints:
JMeter consumes excessive resources, or the database server becomes unresponsive. Monitor the database server’s resource utilization to make sure it is not being maxed out. Use JMeter in Non-GUI mode to reduce resource consumption on the client side.
That’s it! Congratulations on making it through this tutorial and hope you found it useful! Happy Learning!!
