What is Throughput?
Throughput is calculated as requests/units of time. The time is calculated from the start of the first sample to the end of the last sample. This includes any intervals between samples, as it is supposed to represent the load on the server.
The formula is: Throughput = (number of requests) / (total time)
Suppose we want to run the load test with constant throughput in JMeter, then JMeter has a group of elements, which are called “Timers”. And one of them has the obvious title – “Constant Throughput Timer”. That is what we need.
What is Constant Throughput Timer?
This timer allows us to keep total throughput constant. Constant Throughput Timer is only capable of pausing JMeter threads in order to slow them down to reach the target throughput, so make sure you have enough threads in order to guarantee the desired amount of requests per second. Also, be aware that the Constant Throughput Timer is precise enough only on a minute level, so you need to properly calculate the ramp-up period and let your test run long enough. Of course, if the server is not able to handle such a load, the throughput will be lowered. Throughput may decrease if other timers contradict the Constant Throughput timer.
Constant Throughput Timer will introduce random delays between requests in such a way that a load/stress of required throughput is sent to the application.

Screenshot of Control Panel of Constant Throughput Timer


Create a Test Plan in JMeter
Step 1 – Add Thread Group
Select Test Plan on the tree
Add Thread Group
To add Thread Group: Right-click on the “Test Plan” and add a new thread group: Add -> Threads (Users) -> Thread Group

In the Thread Group control panel, enter Thread Properties as follows:
Number of Threads: 1 – Number of users connects to the target website
Loop Count: Infinite – Number of times to execute testing
Ramp-Up Period: 1
Duration: 5 sec

Step 2 – Adding JMeter elements
The JMeter element used here is HTTP Request Sampler. In HTTP Request Control Panel, the Path field indicates which URL request you want to send
Add HTTP Request Sampler
To add: Right-click on Thread Group and select: Add -> Sampler -> HTTP Request

Below-mentioned are the values used in HTTP Request to perform the test
Name – HTTP Request
Server Name or IP – localhost
Port– 8010
Method– POST
Path– /demo/helloworld

Step 3 – Add Constant Throughput Timer
To add: Right-click on Thread Group and select: Add -> Timer-> Constant Throughput Timer

Add Target Throughput: 600 (means 600 requests in 60 sec, so 10 requests per sec) Select Calculate Throughput based on – this thread only (More details about the option are present.

Step 4 – Adding Listeners to Test Plan
Listeners – They show the results of the test execution. They can show results in a different format such as a tree, table, graph, or log file
We are adding the View Result Tree listener
View Result Tree – View Result Tree shows the results of the user request in basic HTML format
To add: Right-click Test Plan, Add -> Listener -> View Result Tree

We are adding a Summary Report listener
Summary Report – The summary report creates a table row for each differently named request in your test. This is similar to the Aggregate Report, except that it uses less memory.
To add: Right-click Test Plan, Add -> Listener -> Summary Report

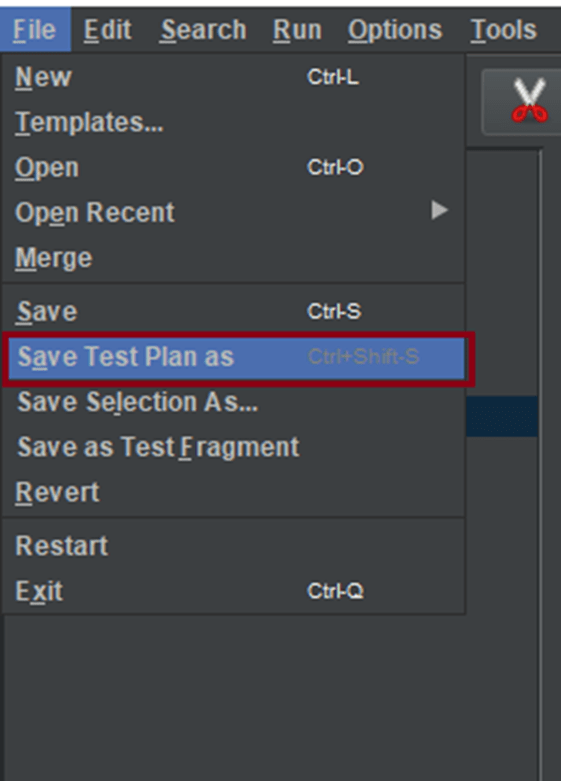
Step 5 – Save the Test Plan
To Save: Click File Select -> Save Test Plan as ->Give the name of the Test Plan. It will be saved as .jmx format.
Step 6 – Run the Test Plan
Click on Green Triangle as shown at the top to run the test.
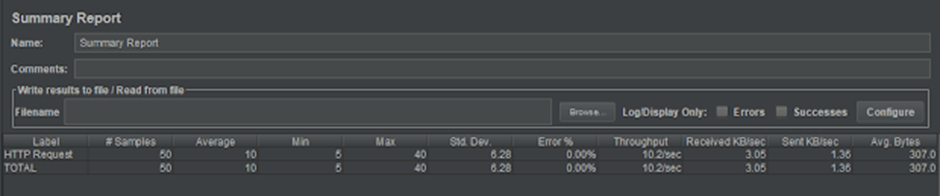
Step 7 – View the Execution Status
Click on Summary Report to see the status of Run. As we can see in the summary report, 50 requests are executed as 10 requests per sec (10*5=50 requests).
Congratulations on making it through this tutorial and hope you found it useful! Happy Learning!! Cheers!!
